


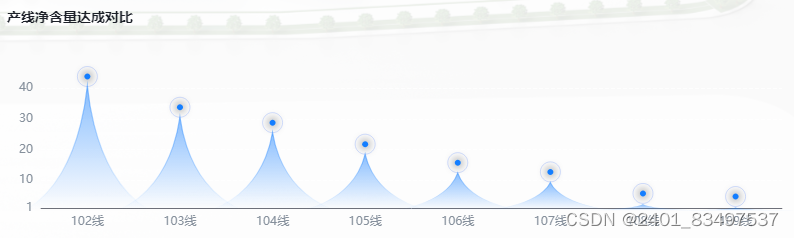
绘制技巧:先绘制外圆,背景透明,带蓝色边框,实现空心效果。在绘制内圆,蓝色实心带模糊光晕效果。最后绘制三角形柱体,带边框,边框和柱体颜色为蓝色渐变色。
效果如下:
代码如下:
<template>
  <div class="bar-chart-container">
    <div class="title">产线净含量达成对比</div>
    <div id="bar-chart" class="bar-chart"></div>
  </div>
</template>

<script setup lang="ts">
import * as echarts from 'echarts'
//echarts只能接受svg的path语法,https://echarts.apache.org/en/option.html#series-bar.markPoint.symbol
//在线查看path的形状(记得删除path://),https://svg-path-visualizer.netlify.app/
//外部大圆
const barCircleSvgLarge = 'path://M7.5 0.5C11.3639 0.5 14.5 3.63614 14.5 7.5C14.5 11.3639 11.3639 14.5 7.5 14.5C3.63614 14.5 0.5 11.3639 0.5 7.5C0.5 3.63614 3.63614 0.5 7.5 0.5Z'
//内部小圆
const barCircleSvgSmall = 'path://M10 7.5C10 6.12 8.88 5 7.5 5C6.12 5 5 6.12 5 7.5C5 8.88 6.12 10 7.5 10C8.88 10 10 8.88 10 7.5Z'
//三角形柱体
const barTriangleSvg = 'path://M35.8696 24.3537C36.4724 36.2003 37.5771 51.355 39.601 67.481C41.8079 85.0646 45.1099 103.821 50.0529 120.712C54.7947 136.915 61.0651 151.467 69.3794 161.612H2.41281C10.647 151.552 16.8754 137.047 21.5996 120.869C26.5263 103.996 29.8377 85.2287 32.0646 67.6226C34.1105 51.4473 35.2428 36.2369 35.8696 24.3537Z'


const initChart = () => {
  const pathSymbols = {
    barCircleSvgLarge: barCircleSvgLarge,
    barCircleSvgSmall: barCircleSvgSmall
  };

  const option = {
    grid: {
      left: '8%',
      right: '8%',
      height: '60%',
      width: '80%'
    },
    tooltip: {
      trigger: 'axis',
      axisPointer: {
        type: 'none'
      },
      formatter: function (params: any) {
        return params[0].name + ': ' + params[0].value;
      }
    },
    xAxis: {
      data: ['102线', '103线', '104线', '105线', '106线', '107线', '108线', '109线'],
      axisTick: {show: false},
      axisLabel: {
        color: '#86909C'
      }
    },
    yAxis: {

      type: 'value',
      min: function (value) {//取最小值向下取整为最小刻度
        return Math.floor(value.min)
      },
      max: function (value) {//取最大值向上取整为最大刻度
        return Math.ceil(value.max)
      },
      splitLine: {
        // 网格线
        show: true,
        lineStyle: { //分割线
          color: "#FFFFFFCC",
          width: 1,
          type: "dashed" //dotted:虚线 solid:实线
        }
      },
      scale: true, //自适应
      minInterval: 0.1, //分割刻度
      axisLine: {
        onZero: false,
        lineStyle: {
          color: '#86909C'
        }
      },
    },
    color: ['rgba(20, 126, 255, 1)'],
    series: [
      {
        name: 'hill',
        type: 'pictorialBar',
        barCategoryGap: '-30%',
        symbol: barTriangleSvg,
        itemStyle: {
          opacity: 0.5,
          borderWidth: 4,
          borderColor: new echarts.graphic.LinearGradient(0, 1, 0, 0, [
            {
              offset: 0,
              color: 'rgba(20, 126, 255, 0)'
            },
            {
              offset: 1,
              color: 'rgba(20, 126, 255, 1)'
            }
          ]),
          color: new echarts.graphic.LinearGradient(0, 1, 0, 0, [
            {
              offset: 0,
              color: 'rgba(20, 126, 255, 0)'
            },
            {
              offset: 1,
              color: 'rgba(20, 126, 255, 1)'
            }
          ])
        },
        emphasis: {
          itemStyle: {
            opacity: 1
          }
        },
        data: [40, 30, 25, 18, 12, 9, 2, 1],
        z: 10
      },
      {
        name: 'glyph',
        type: 'pictorialBar',
        barGap: '-100%',
        symbolPosition: 'end',
        symbolSize: 50,
        symbolOffset: [0, '-120%'],
        data: [
          {
            value: 40,
            symbol: pathSymbols.barCircleSvgLarge,
            symbolSize: [20, 20],
            itemStyle: {
              color: 'transparent',
              opacity: 0.8,
              borderWidth: 5,
              borderColor: "#2B66FF",
            },
          },
          {
            value: 30,
            symbol: pathSymbols.barCircleSvgLarge,
            symbolSize: [20, 20],
            itemStyle: {
              color: 'transparent',
              opacity: 0.8,
              borderWidth: 5,
              borderColor: "#2B66FF",
            },
          },
          {
            value: 25,
            symbol: pathSymbols.barCircleSvgLarge,
            symbolSize: [20, 20],
            itemStyle: {
              color: 'transparent',
              opacity: 0.8,
              borderWidth: 5,
              borderColor: "#2B66FF",
            },
          },
          {
            value: 18,
            symbol: pathSymbols.barCircleSvgLarge,
            symbolSize: [20, 20],
            itemStyle: {
              color: 'transparent',
              opacity: 0.8,
              borderWidth: 5,
              borderColor: "#2B66FF",
            },
          },
          {
            value: 12,
            symbol: pathSymbols.barCircleSvgLarge,
            symbolSize: [20, 20],
            itemStyle: {
              color: 'transparent',
              opacity: 0.8,
              borderWidth: 5,
              borderColor: "#2B66FF",
            },
          },
          {
            value: 9,
            symbol: pathSymbols.barCircleSvgLarge,
            symbolSize: [20, 20],
            itemStyle: {
              color: 'transparent',
              opacity: 0.8,
              borderWidth: 5,
              borderColor: "#2B66FF",
            },
          },
          {
            value: 2,
            symbol: pathSymbols.barCircleSvgLarge,
            symbolSize: [20, 20],
            itemStyle: {
              color: 'transparent',
              opacity: 0.8,
              borderWidth: 5,
              borderColor: "#2B66FF",
            },
          },
          {
            value: 1,
            symbol: pathSymbols.barCircleSvgLarge,
            symbolSize: [20, 20],
            itemStyle: {
              color: 'transparent',
              opacity: 0.8,
              borderWidth: 5,
              borderColor: "#2B66FF",
            },
          }
        ]
      },
      {
        name: 'glyph',
        type: 'pictorialBar',
        barGap: '-100%',
        symbolPosition: 'end',
        symbolSize: 50,
        symbolOffset: [0, '-240%'],
        data: [
          {
            value: 40,
            symbol: pathSymbols.barCircleSvgSmall,
            symbolSize: [6, 6],
            itemStyle: {
              shadowBlur: 10
            }
          },
          {
            value: 30,
            symbol: pathSymbols.barCircleSvgSmall,
            symbolSize: [6, 6],
            itemStyle: {
              shadowBlur: 10
            }
          },
          {
            value: 25,
            symbol: pathSymbols.barCircleSvgSmall,
            symbolSize: [6, 6],
            itemStyle: {
              shadowBlur: 10
            }
          },
          {
            value: 18,
            symbol: pathSymbols.barCircleSvgSmall,
            symbolSize: [6, 6],
            itemStyle: {
              shadowBlur: 10
            }
          },
          {
            value: 12,
            symbol: pathSymbols.barCircleSvgSmall,
            symbolSize: [6, 6],
            itemStyle: {
              shadowBlur: 10
            }
          },
          {
            value: 9,
            symbol: pathSymbols.barCircleSvgSmall,
            symbolSize: [6, 6],
            itemStyle: {
              shadowBlur: 10
            }
          },
          {
            value: 2,
            symbol: pathSymbols.barCircleSvgSmall,
            symbolSize: [6, 6],
            itemStyle: {
              shadowBlur: 10
            }
          },
          {
            value: 1,
            symbol: pathSymbols.barCircleSvgLarge,
            symbolSize: [6, 6],
            itemStyle: {
              shadowBlur: 10
            }
          }
        ]
      }
    ]
  };
  const dom = document.getElementById('bar-chart')
// 初始化echarts实例
  const myChart = echarts.init(dom)
  myChart.setOption(option)
};
const dataFun = async (params) => {
  initChart()
}
onMounted(async () => {
  const params = {
  }
  await dataFun(params)
})
</script>

<style scoped lang="scss">
.bar-chart-container {
  .title {
    font-size: 14px;
    font-weight: 700;
    line-height: 22px;
    text-align: left;
    color: #1D2129;
    margin-left: 40px;
  }

  .bar-chart {
    width: 100%;
    height: 200px;
  }
}

</style>


 833
833

 被折叠的 条评论
为什么被折叠?
被折叠的 条评论
为什么被折叠?
 到【灌水乐园】发言


