


 本文详细介绍了MATLAB编程中的变量命名规则、数据类型、基本数学运算、矩阵操作、逻辑控制结构、脚本与函数编写,以及绘图和文件导入方法。同时提及了适用于不同水平Python开发者的学习资源。
clear all % 清除Workspace中的所有变量
clc % 清除Command Window中的所有命令
%%II. 变量命令规则=========
%%
%1. 变量名区分大小写
A = 2
a = 3
%%
%2. 变量名长度不超过63位
ABCDEFGHIJKLMNOPQRSTUVWXYZ123456ABCDEFGHIJKLMNOPQRSTUVWXYZ123456 = 3
%%
%=3. 变量名以字母开头,可以由字母、数字和下划线组成,但不能使用标点
% 3A = 4
% .a = 5
% /b = 5
a_2 = 3
% a.2 = 4
%%
%4. 变量名应简洁明了,通过变量名可以直观看出变量所表示的物理意义
A = rand(3,5)
rows = size(A, 1)
cols = size(A, 2)
%%III. MATLAB数据类型=============
%%
%1. 数字=
2 + 4
10 - 7
3 * 5
8 / 2
%%
%2. 字符与字符串
s = ‘a’
abs(s)
char(65)
num2str(65)
str = ‘I Love MATLAB & Machine Learning.’
length(str)
doc num2str
%%
%3. 矩阵=
A = [1 2 3; 4 5 2; 3 2 7]
B = A’%转置
C = A(😃%列向量
D = inv(A)%逆
A * D
E = zeros(10,5,3)
E(:,:,1) = rand(10,5)
E(:,:,2) = randi(5, 10,5)
E(:,:,3) = randn(10,5)
%%
%4. 元胞数组
A = cell(1, 6)
A{2} = eye(3)
A{5} = magic(5)
B = A{5}
%%
%5. 结构体
books = struct(‘name’,{{‘Machine Learning’,‘Data Mining’}},‘price’,[30 40])
books.name
books.name(1)
books.name{1}
%%IV. MATLAB矩阵操作=================
%%
%=1. 矩阵的定义与构造
A = [1 2 3 5 8 5 4 6]
B = 1:2:9
C = repmat(B, 3, 1)%复制,将B复制成3行1列
D = ones(2, 4)
%%
%2. 矩阵的四则运算=
A = [1 2 3 4; 5 6 7 8]
B = [1 1 2 2; 2 2 1 1]
C = A + B
D = A - B
E = A * B’%矩阵进行计算
F = A .* B具体数值进行计算
G = A / B % G * B = A G * B * pinv(B) = A * pinv(B) G = A * pinv(B)
H = A ./ B
%%
%3. 矩阵的下标=
A = magic(5)
B = A(2,3)
C = A(3,:)
D = A(:,4)
[m, n] = find(A > 20)
%%=V. MATLAB逻辑与流程控制=
%%
%1. if … else … end
A = rand(1,10)
limit = 0.75;
B = (A > limit); % B is a vector of logical values
if any(B)
fprintf(‘Indices of values > %4.2f: \n’, limit);
disp(find(B))%dis输出
else
disp(‘All values are below the limit.’)
end
%%
%2. for … end
k = 10;
hilbert = zeros(k,k); % Preallocate matrix
for m = 1:k
for n = 1:k
hilbert(m,n) = 1/(m+n -1);
end
end
hilbert
%%
%3. while … end
n = 1;
nFactorial = 1;
while nFactorial < 1e100
n = n + 1;
nFactorial = nFactorial * n;
end
n
factorial(69)
factorial(70)
prod(1:69)
prod(1:70)
%%
%4. switch … case … end
mynumber = input(‘Enter a number:’);
switch mynumber
case -1
disp(‘negative one’);
case 0
disp(‘zero’);
case 1
disp(‘positive one’);
otherwise
disp(‘other value’);
end
%%=VI. MATLAB脚本与函数文件===
%%
%=1. 脚本文件
myScript
%%
%2. 函数文件=
mynumber = input(‘Enter a number:’);
output = myFunction(mynumber)
%%=VII. MATLAB基本绘图操作====
%%
%1. 二维平面绘图====
x = 0:0.01:2*pi;
y = sin(x);
figure
plot(x, y)
title(‘y = sin(x)’)
xlabel(‘x’)
ylabel(‘sin(x)’)
xlim([0 2*pi])
x = 0:0.01:20;
y1 = 200exp(-0.05x).*sin(x);
y2 = 0.8exp(-0.5x).sin(10x);
figure
[AX,H1,H2] = plotyy(x,y1,x,y2,‘plot’);%两个纵坐标
set(get(AX(1),‘Ylabel’),‘String’,‘Slow Decay’)
set(get(AX(2),‘Ylabel’),‘String’,‘Fast Decay’)
xlabel(‘Time (\musec)’)
title(‘Multiple Decay Rates’)
set(H1,‘LineStyle’,‘–’)
set(H2,‘LineStyle’,‘:’)
%%
%2. 三维立体绘图=======
t = 0:pi/50:10*pi;
plot3(sin(t),cos(t),t)
xlabel(‘sin(t)’)
ylabel(‘cos(t)’)
zlabel(‘t’)
grid on
axis square
%%
%3. 图形的保存与导出
% (1) Edit → Copy Figure
% (2) Toolbar → Save
% (3) print(‘-depsc’,‘-tiff’,‘-r300’,‘picture1’)
% (4) File → Export Setup
%%VIII. MATLAB文件导入
%%
%1. mat格式
save data.mat x y1 y2
clear all
load data.mat
%%
%2. txt格式
M = importdata(‘myfile.txt’);
S = M.data;
save ‘data.txt’ S -ascii
T = load(‘data.txt’);
isequal(S, T)
%%
%3. xls格式
xlswrite(‘data.xls’,S)
W = xlsread(‘data.xls’);
isequal(S, W)
xlswrite(‘data.xlsx’,S)
U = xlsread(‘data.xlsx’);
isequal(S, U)
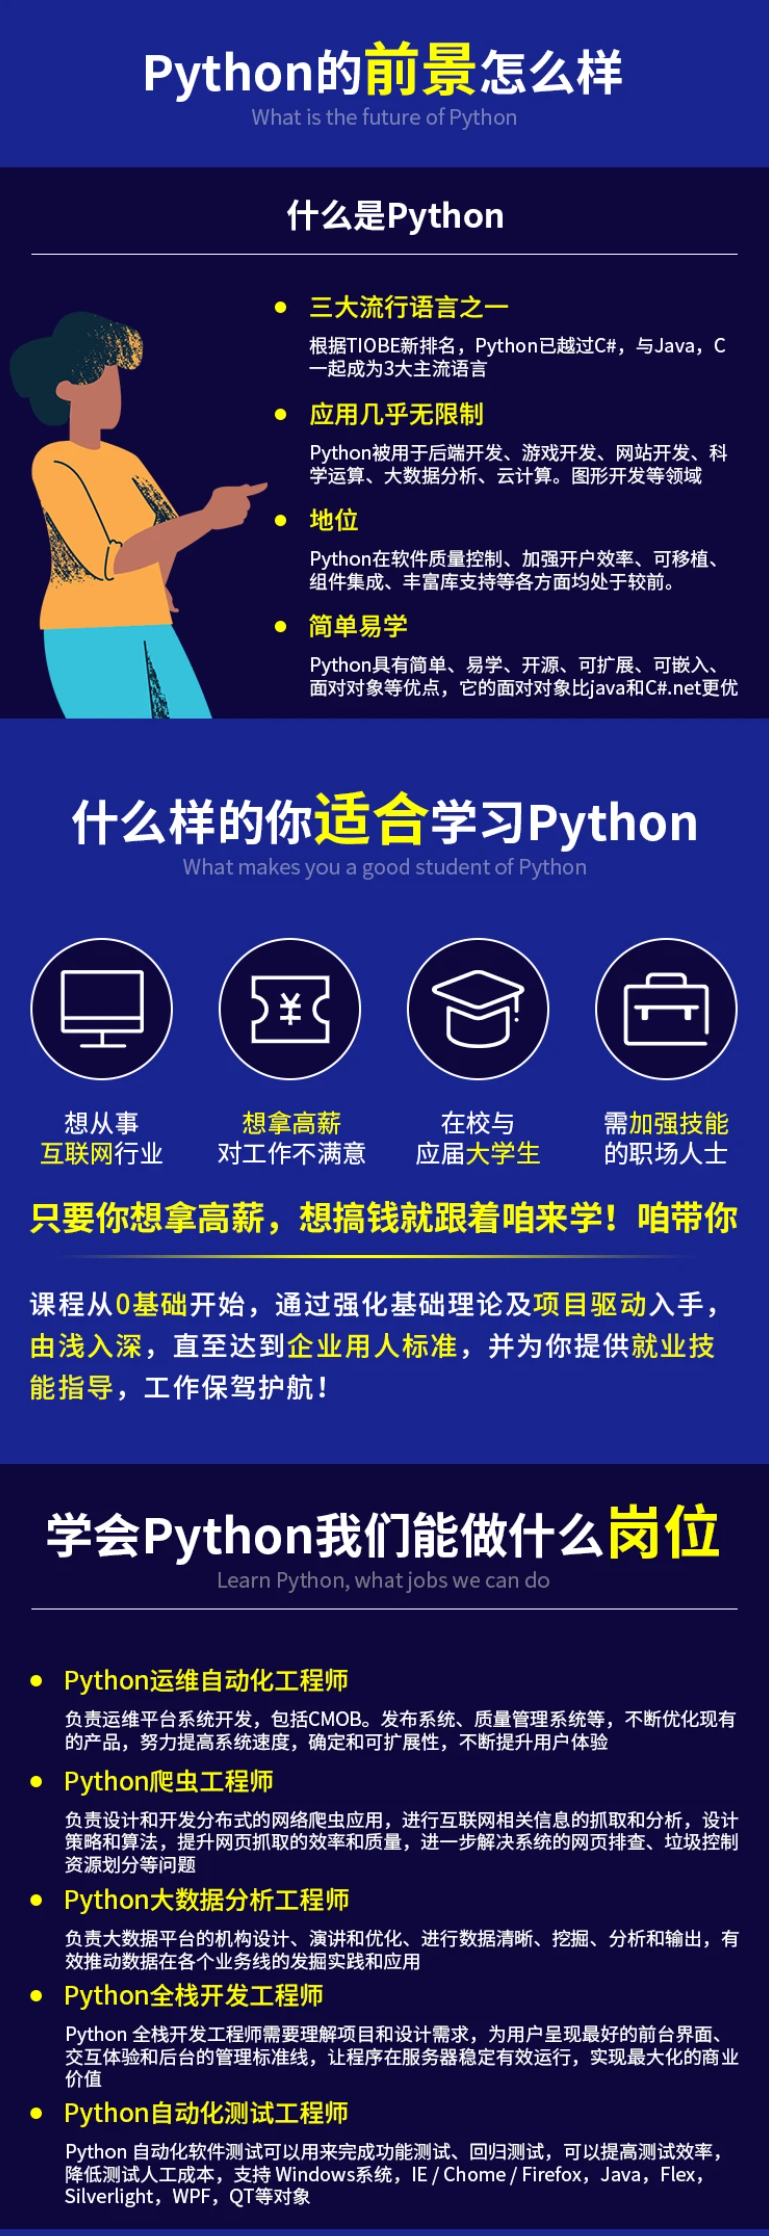
自我介绍一下,小编13年上海交大毕业,曾经在小公司待过,也去过华为、OPPO等大厂,18年进入阿里一直到现在。
深知大多数Python工程师,想要提升技能,往往是自己摸索成长或者是报班学习,但对于培训机构动则几千的学费,着实压力不小。自己不成体系的自学效果低效又漫长,而且极易碰到天花板技术停滞不前!
因此收集整理了一份《2024年Python开发全套学习资料》,初衷也很简单,就是希望能够帮助到想自学提升又不知道该从何学起的朋友,同时减轻大家的负担。
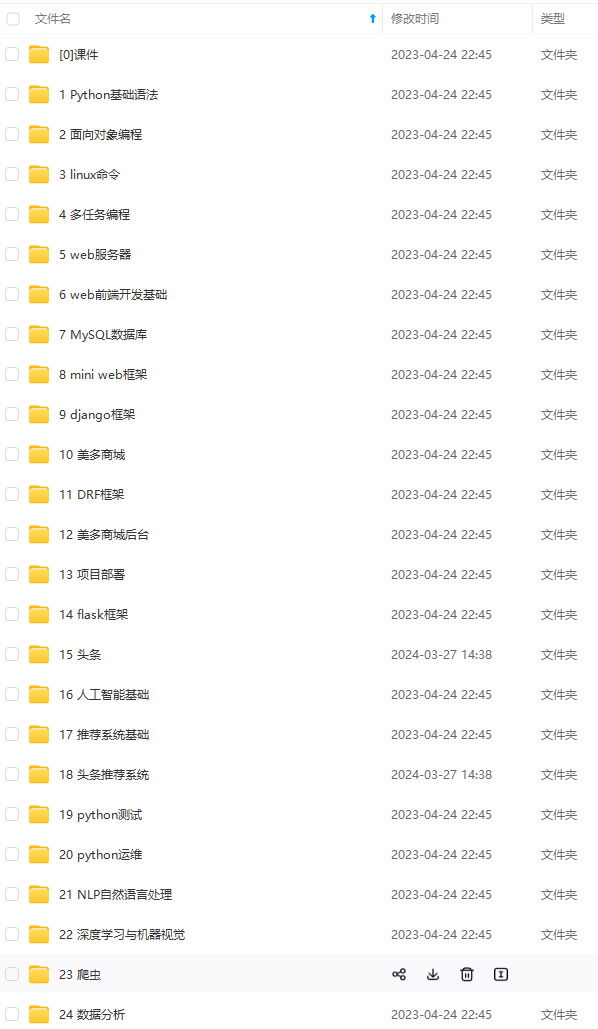

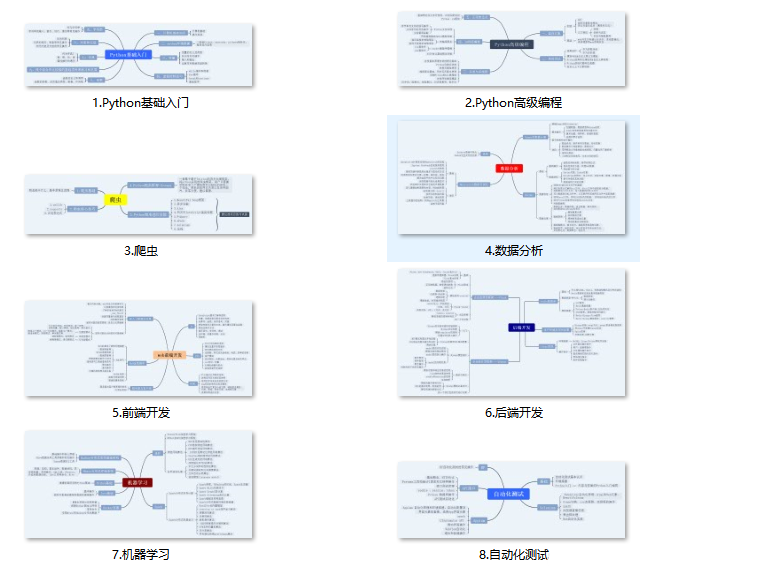
既有适合小白学习的零基础资料,也有适合3年以上经验的小伙伴深入学习提升的进阶课程,基本涵盖了95%以上前端开发知识点,真正体系化!
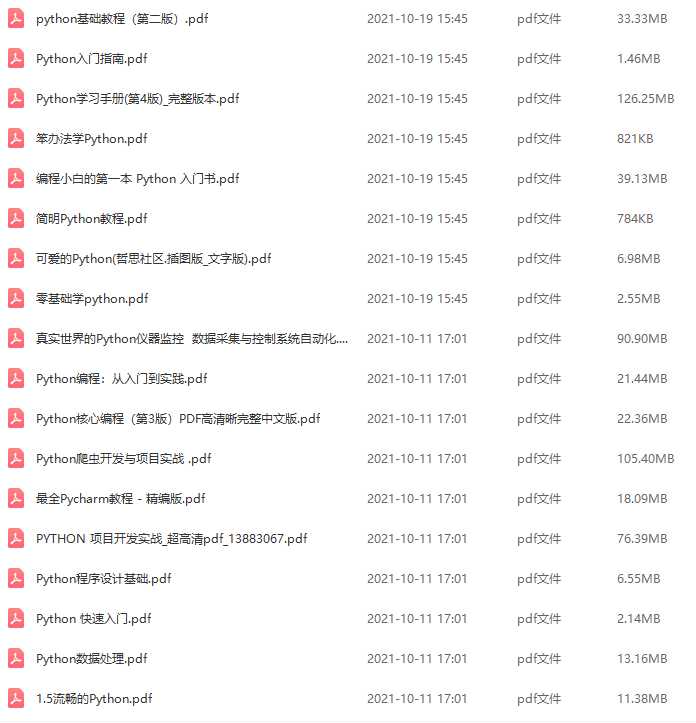
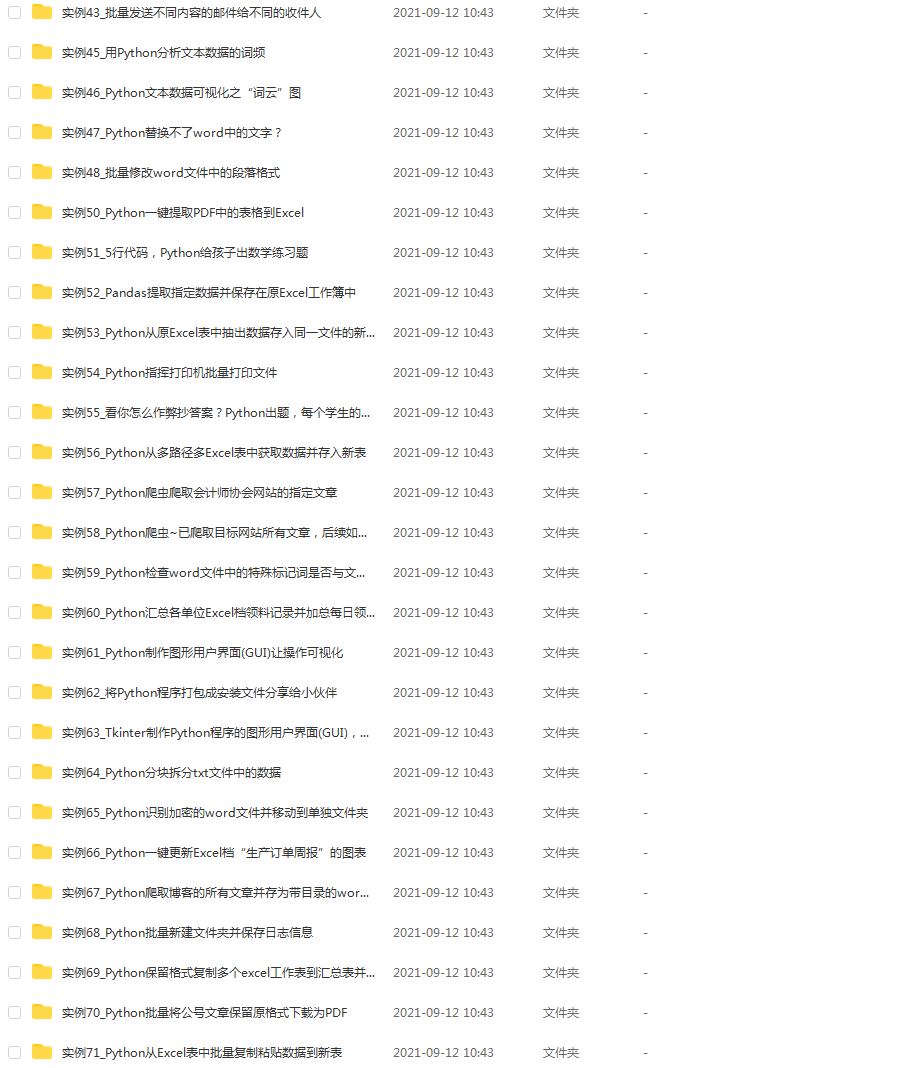
由于文件比较大,这里只是将部分目录大纲截图出来,每个节点里面都包含大厂面经、学习笔记、源码讲义、实战项目、讲解视频,并且后续会持续更新
如果你觉得这些内容对你有帮助,可以扫码获取!!!(备注Python)
g_convert/46506ae54be168b93cf63939786134ca.png)
既有适合小白学习的零基础资料,也有适合3年以上经验的小伙伴深入学习提升的进阶课程,基本涵盖了95%以上前端开发知识点,真正体系化!
由于文件比较大,这里只是将部分目录大纲截图出来,每个节点里面都包含大厂面经、学习笔记、源码讲义、实战项目、讲解视频,并且后续会持续更新
如果你觉得这些内容对你有帮助,可以扫码获取!!!(备注Python)


 4043
4043


 被折叠的 条评论
为什么被折叠?
被折叠的 条评论
为什么被折叠?
 到【灌水乐园】发言


