


题目
Task:
使用运行时检测工具来检测 Pod tomcat123 单个容器中频发生成和执行的异常进程。
有两种工具可供使用:
    sysdig
    falco

注:这些工具只预装在 cluster 的工作节点 node02 上,不在 master 节点。
使用工具至少分析 30 秒 ,使用过滤器检查生成和执行的进程,将事件写到 /opt/KSR00101/incidents/summary 文件中,
其中包含检测的事件, 格式如下:
timestamp,uid/username,processName
保持工具的原始时间戳格式不变。

注:确保事件文件存储在集群的工作节点上。
请注意,考试时,考题里已表明 sysdig 在工作节点上,所以你需要ssh 到开头写的工作节点上。
环境搭建
安装sysdig
在下方github参考链接的Release下载即可
博主下载的sysdig-0.31.5-x86_64.tar.gz,之后把可执行文件移动即可
命令
tar -zxf sysdig-0.31.5-x86_64.tar.gz
cp sysdig-0.31.5-x86_64/usr/bin/sysdig /usr/bin/sysdig
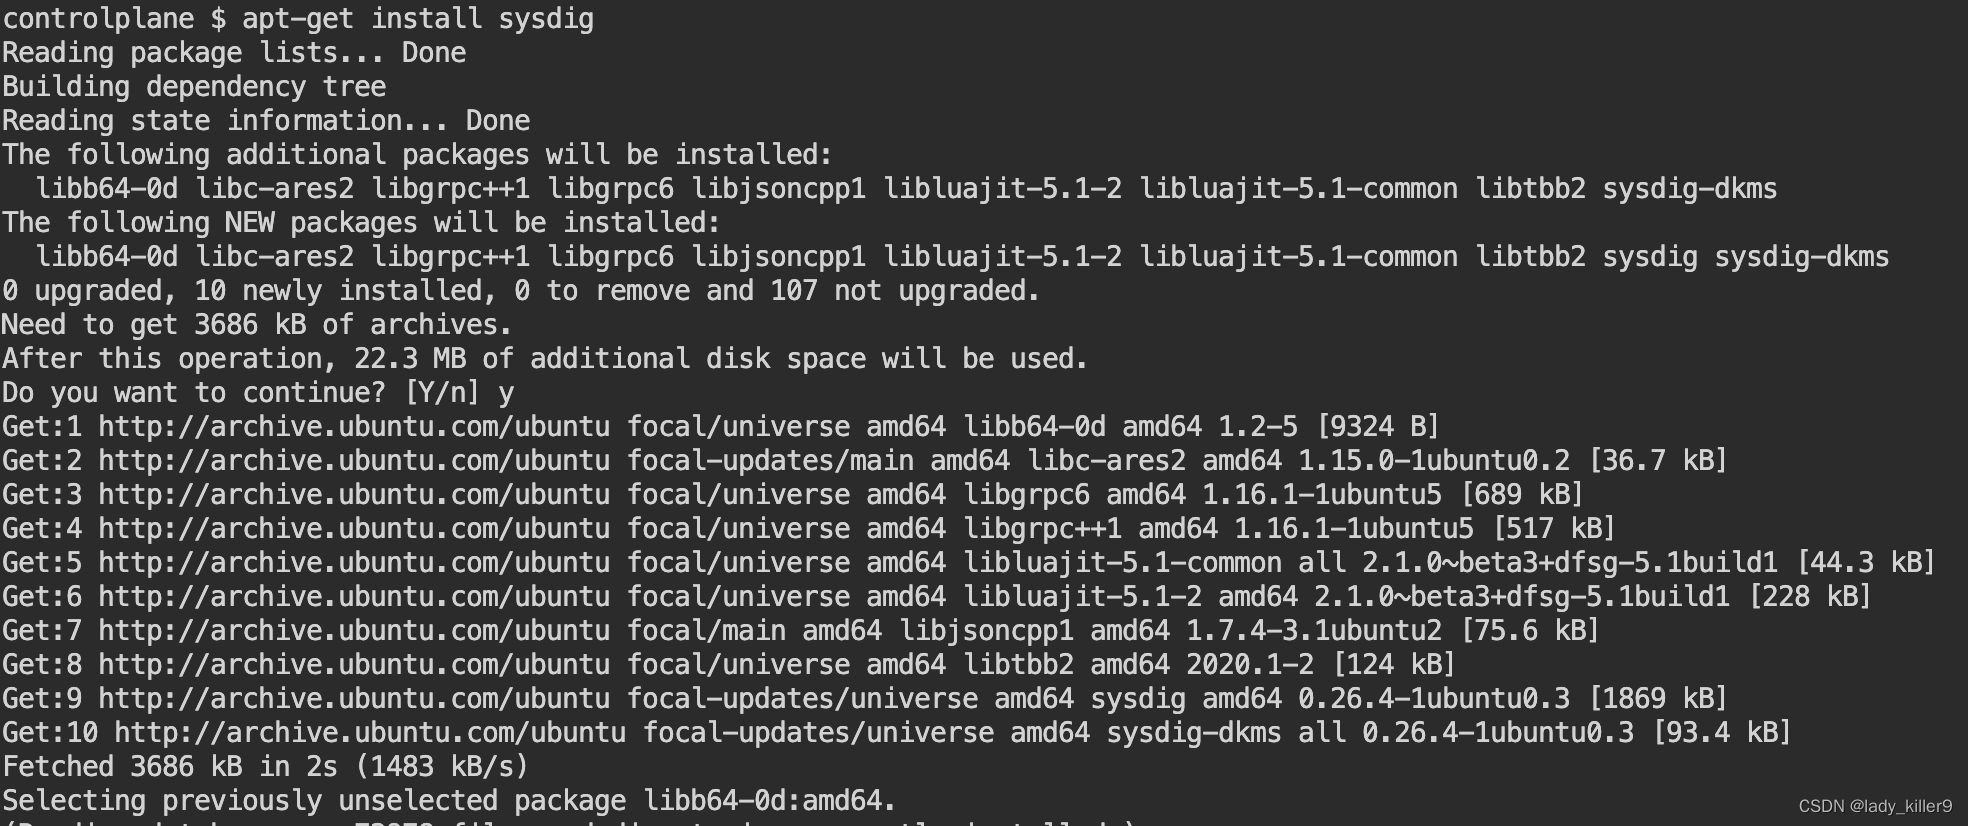
ubuntu 安装sysdig
命令
apt-get install -y sysdig
截图
sysdig --help
sysdig version 0.31.5
Usage: sysdig [options] [-p <output_format>] [filter]

Options:
 -A, --print-ascii  Only print the text portion of data buffers, and echo
                    end-of-lines. This is useful to only display human-readable
                    data.
 -b, --print-base64 Print data buffers in base64. This is useful for encoding
                    binary data that needs to be used over media designed to
                    handle textual data (i.e., terminal or json).
 -B<bpf_probe>, --bpf=<bpf_probe>
                    Enable live capture using the specified BPF probe instead of the kernel module.
                    The BPF probe can also be specified via the environment variable
                    SYSDIG_BPF_PROBE. If <bpf_probe> is left empty, sysdig will
                    try to load one from the scap-driver-loader script.
 -c <chiselname> <chiselargs>, --chisel <chiselname> <chiselargs>
                    run the specified chisel. If the chisel require arguments,
                    they must be specified in the command line after the name.
 -cl, --list-chisels
                    lists the available chisels. Sysdig looks for chisels in the
                    following directories: ./chisels, ~/.chisels, /usr/share/sysdig/chisels.
  --cpus-for-each-buffer <cpus_num>
                    [EXPERIMENTAL] Please note this config regards only the modern BPF probe.
                    They are experimental so they could change over releases.
                    How many CPUs you want to assign to a single syscall buffer (ring buffer).
                    By default, every syscall buffer is associated to 2 CPUs, so the mapping is
                    1:2. The modern BPF probe allows you to choose different mappings, for
                    example, 1:1 would mean a syscall buffer for each CPU.
 -C <file_size>, --file-size=<file_size>
                    Before writing an event, check whether the file is
                    currently larger than file_size and, if so, close the
                    current file and open a new one. Saved files will have the
                    name specified with the -w flag, with a number after it,
                    starting at 0 and continuing upward. The units of file_size
                    are millions of bytes (10^6, not 2^20). Use the -W flag to
                    determine how many files will be saved to disk.
 --cri <path>       Path to CRI socket for container metadata
                    Use the specified socket to fetch data from a CRI-compatible runtime

 --cri-timeout <timeout_ms>
                    Wait at most <timeout_ms> milliseconds for response from CRI
 -d, --displayflt   Make the given filter a display one
                    Setting this option causes the events to be filtered
                    after being parsed by the state system. Events are
                    normally filtered before being analyzed, which is more
                    efficient, but can cause state (e.g. FD names) to be lost.
 -D, --debug        Capture events about sysdig itself, display internal events
                    in addition to system events, and print additional
                    logging on standard error.
 -E, --exclude-users
                    Don't create the user/group tables by querying the OS when
 sysdig starts. This also means that no user or group info
 will be written to the trace file by the -w flag.
 The user/group tables are necessary to use filter fields
 like user.name or group.name. However, creating them can
 increase sysdig's startup time. Moreover, they contain
                    information that could be privacy sensitive.
 -e <num_events>    If used together with -w option, creates a series of dump files
                    containing only a specified number of events given in num_events
                    parameter each.
                    Used alongside -W flags creates a ring buffer of file containing
                    num_events each.
 -F, --fatfile      Enable fatfile mode
                    when writing in fatfile mode, the output file will contain
                    events that will be invisible when reading the file, but
                    that are necessary to fully reconstruct the state.
                    Fatfile mode is useful when saving events to disk with an
                    aggressive filter. The filter could drop events that would
                    the state to be updated (e.g. clone() or open()). With
                    fatfile mode, those events are still saved to file, but
                    'hidden' so that they won't appear when reading the file.
 Be aware that using this flag might generate substantially
 bigger traces files.
 --filter-proclist apply the filter to the process table
 a full dump of /proc is typically included in any trace file
 to make sure all the state required to decode events is in the
 file. This could cause the file to contain unwanted or sensitive
 information. Using this flag causes the command line filter to
 be applied to the /proc dump as well.
 -g, --gvisor-config
 Parse events from gVisor using the specified configuration file.
 A sysdig-compatible configuration file can be generated with --gvisor-generate-config
 and can be used for both runsc and sysdig.
 --gvisor-generate-config [=<socket\_path>(=/tmp/gvisor.sock)]
 Generate a configuration file that can be used for gVisor.
 --gvisor-root <gvisor\_root>
 gVisor root directory for storage of container state. Equivalent to runsc --root flag.
 -G <num\_seconds>, --seconds=<num\_seconds>
 Rotates the dump file specified with the -w option every
 num\_seconds seconds. Saved files will have the name specified
 by -w which should include a time format as defined by strftime(3).
 If no time format is specified, a counter will be used.
 If no data format is specified, this can be used with -W flag to
 create a ring buffer of events.
 -h, --help Print this page
 -H <pluginname>[:<initconfig>], --plugin <pluginname>[:<initconfig>]
 Registers a plugin, using the passed init config if present.
 The format of initconf is controlled by the plugin, refer to each
 plugin's documentation to learn about it.
                    A path can also be used as pluginname.
 -I <pluginname>[:<openparams>], --input <pluginname>[:<openparams>]
                    Set a previously registered plugin as input,
                    capturing events using it and passing the
                    openparams string as open parameters.
                    Only a single source plugin can be registered.
                    If no plugins were registered, any found plugin in the directories
                    specified by ;-separated environment variable SYSDIG_PLUGIN_DIR and
                    in /usr/share/sysdig/plugins is registered; then use the provided one as input source.
                    The format of openparams is controlled by the plugin, refer to each
                    plugin's documentation to learn about it.
 See https://falco.org/docs/plugins/plugin-api-reference/#ss-plugin-t-plugin-init-const-char-config-int32-t-rc-required-yes
 and https://falco.org/docs/plugins/plugin-api-reference/#ss-instance-t-plugin-open-ss-plugin-t-s-const-char-params-int32-t-rc-required-yes for more infos.
 The event sources available for capture vary depending on which
 plugins have been installed.
 -Il Lists the loaded plugins. If no plugin has been registered through '-H',
 Sysdig looks for plugins in the directories
 specified by ;-separated environment variable SYSDIG\_PLUGIN\_DIR and
 in /usr/share/sysdig/plugins.
 -i <chiselname>, --chisel-info <chiselname>
 Get a longer description and the arguments associated with
 a chisel found in the -cl option list.
 -j, --json Emit output as json, data buffer encoding will depend from the
 print format selected.
 -k <url>, --k8s-api=<url>
 Enable Kubernetes support by connecting to the API server
 specified as argument. E.g. "http://admin:password@127.0.0.1:8080".
 The API server can also be specified via the environment variable
 SYSDIG\_K8S\_API.
 --node-name=<url>
 The node name is used as a filter when requesting metadata of pods
 to the API server; if empty, no filter is set
 -K <bt\_file> | <cert\_file>:<key\_file[#password]>[:<ca\_cert\_file>], --k8s-api-cert=<bt\_file> | <cert\_file>:<key\_file[#password]>[:<ca\_cert\_file>]
 Use the provided files names to authenticate user and (optionally) verify the K8S API
 server identity.
 Each entry must specify full (absolute, or relative to the current directory) path
 to the respective file.
 Private key password is optional (needed only if key is password protected).
 CA certificate is optional. For all files, only PEM file format is supported.
 Specifying CA certificate only is obsoleted - when single entry is provided
 for this option, it will be interpreted as the name of a file containing bearer token.
 Note that the format of this command-line option prohibits use of files whose names contain
 ':' or '#' characters in the file name.
                    Option can also be provided via the environment variable SYSDIG_K8S_API_CERT.
 -L, --list-events  List the events that the engine supports
 -l, --list         List the fields that can be used for filtering and output
                    formatting. Use -lv to get additional information for each
                    field.
 --libs-version     Print the falcosecurity/libs version
 --large-environment
                    Support environments larger than 4KiB
                    When the environment is larger than 4KiB, load the whole
                    environment from /proc instead of truncating to the first 4KiB
                    This may fail for short-lived processes and in that case
                    the truncated environment is used instead.
 --log-level=<trace|debug|info|notice|warning|error|critical|fatal>
                    Select log level. Useful together with --debug.
 --list-markdown    like -l, but produces markdown output
 -m <url[,marathon_url]>, --mesos-api=<url[,marathon_url]>
                    Enable Mesos support by connecting to the API server
                    specified as argument. E.g. "http://admin:password@127.0.0.1:5050".
                    Marathon url is optional and defaults to Mesos address, port 8080.
                    The API servers can also be specified via the environment variable
                    SYSDIG_MESOS_API.
--modern-bpf
                    [EXPERIMENTAL] Enable live capture using the modern BPF probe instead of
                    of the kernel module.
 -M <num_seconds>   Stop collecting after <num_seconds> reached.
 -n <num>, --numevents=<num>
                    Stop capturing after <num> events
 --page-faults      Capture user/kernel major/minor page faults
 --plugin-config-file
                    Load the plugin configuration from a Falco-compatible yaml file.
                    Do not mix this option with the '-H' or '-I' options: it is unsupported.
                    See the plugin section in https://falco.org/docs/configuration/ for
                    additional information
 -P, --progress     Print progress on stderr while processing trace files
 -p <output_format>, --print=<output_format>
                    Specify the format to be used when printing the events.
                    With -pc or -pcontainer will use a container-friendly format.
                    With -pk or -pkubernetes will use a kubernetes-friendly format.
                    With -pm or -pmesos will use a mesos-friendly format.
                    See the examples section below for more info.
 --plugin-info <pluginname>
                    Print info for a single plugin. This includes name, author,
                    and all the descriptive info of the plugin. If present,
                    this also prints the schema format for the init configuration
                    and a list of suggested open parameters.
                    All this info is controlled by the plugin, refer to each
                    plugin's documentation to learn more about it.
 This can be combined with the -H option to load the plugin
 with a given configuration.
 A path can also be used as pluginname.
 -q, --quiet Don't print events on the screen
                    Useful when dumping to disk.
 -R                 Resolve port numbers to names.
 -r <readfile>, --read=<readfile>
                    Read the events from <readfile>.
 -S, --summary      print the event summary (i.e. the list of the top events)
                    when the capture ends.
 -s <len>, --snaplen=<len>
                    Capture the first <len> bytes of each I/O buffer.
                    By default, the first 80 bytes are captured. Use this
                    option with caution, it can generate huge trace files.
 -t <timetype>, --timetype=<timetype>
                    Change the way event time is displayed. Accepted values are
                    h for human-readable string, a for absolute timestamp from
                    epoch, r for relative time from the beginning of the
                    capture, d for delta between event enter and exit, and
                    D for delta from the previous event.
 -T, --force-tracers-capture
                    Tell the driver to make sure full buffers are captured from
                    /dev/null, to make sure that tracers are completely
                    captured. Note that sysdig will enable extended /dev/null
                    capture by itself after detecting that tracers are written
                    there, but that could result in the truncation of some
                    tracers at the beginning of the capture. This option allows
                    preventing that.
 --unbuffered       Turn off output buffering. This causes every single line
                    emitted by sysdig to be flushed, which generates higher CPU
                    usage but is useful when piping sysdig's output into another
 process or into a script.
 -U, --suppress-comm
 Ignore all events from processes having the provided comm.
 -v, --verbose Verbose output.
 This flag will cause the full content of text and binary
 buffers to be printed on screen, instead of being truncated
 to 40 characters. Note that data buffers length is still
 limited by the snaplen (refer to the -s flag documentation)
 -v will also make sysdig print some summary information at
 the end of the capture.
 --version Print version number.
 -w <writefile>, --write=<writefile>
 Write the captured events to <writefile>.
 -W <num>, --limit <num>
 Used in conjunction with the -C option, this will limit the number
 of files created to the specified number, and begin overwriting files
 from the beginning, thus creating a 'rotating' buffer.

 Used in conjunction with the -G option, this will limit the number
 of rotated dump files that get created, exiting with status 0 when
 reaching the limit. If used with -C as well, the behavior will result
 in cyclical files per timeslice.
 -x, --print-hex Print data buffers in hex.
 -X, --print-hex-ascii
 Print data buffers in hex and ASCII.
 -z, --compress Used with -w, enables compression for trace files.

Output format:

By default, sysdig prints the information for each captured event on a single
 line with the following format:

 %evt.num %evt.outputtime %evt.cpu %proc.name (%thread.tid) %evt.dir %evt.type %evt.info

where:
 evt.num is the incremental event number
 evt.time is the event timestamp
 evt.cpu is the CPU number where the event was captured
 proc.name is the name of the process that generated the event
 thread.tid id the TID that generated the event, which corresponds to the
 PID for single thread processes
 evt.dir is the event direction, > for enter events and < for exit events
 evt.type is the name of the event, e.g. 'open' or 'read'
 evt.info is the list of event arguments.

The output format can be customized with the -p switch, using any of the
fields listed by 'sysdig -l'.

Using -pc or -pcontainer, the default format will be changed to a container-friendly one:

%evt.num %evt.outputtime %evt.cpu %container.name (%container.id) %proc.name (%thread.tid:%thread.vtid) %evt.dir %evt.type %evt.info

Using -pk or -pkubernetes, the default format will be changed to a kubernetes-friendly one:

%evt.num %evt.outputtime %evt.cpu %k8s.pod.name (%container.id) %proc.name (%thread.tid:%thread.vtid) %evt.dir %evt.type %evt.info

Using -pm or -pmesos, the default format will be changed to a mesos-friendly one:

%evt.num %evt.outputtime %evt.cpu %mesos.task.name (%container.id) %proc.name (%thread.tid:%thread.vtid) %evt.dir %evt.type %evt.info

Examples:

 Capture all the events from the live system and print them to screen
 $ sysdig

 Capture all the events from the live system and save them to disk
 $ sysdig -w dumpfile.scap

 Read events from a file and print them to screen
 $ sysdig -r dumpfile.scap

 Print all the open system calls invoked by cat
 $ sysdig proc.name=cat and evt.type=open

 Print the name of the files opened by cat
 $ sysdig -p"%evt.arg.name" proc.name=cat and evt.type=open

 Register any found plugin and use dummy as input source passing to it open params
 $ sysdig -I dummy:10'

 Load and register dummy source plugin passing to it init config and open params
   $ sysdig -H dummy:'{"jitter":50}' -I dummy:10
创建容器
kubectl run tomcat123 --image=nginx
创建目录、文件
mkdir -p /opt/KSR00101/incidents/ && touch /opt/KSR00101/incidents/summary
解题 - sysdig
最后
自我介绍一下,小编13年上海交大毕业,曾经在小公司待过,也去过华为、OPPO等大厂,18年进入阿里一直到现在。
深知大多数网络安全工程师,想要提升技能,往往是自己摸索成长,但自己不成体系的自学效果低效又漫长,而且极易碰到天花板技术停滞不前!
因此收集整理了一份《2024年网络安全全套学习资料》,初衷也很简单,就是希望能够帮助到想自学提升又不知道该从何学起的朋友。
既有适合小白学习的零基础资料,也有适合3年以上经验的小伙伴深入学习提升的进阶课程,基本涵盖了95%以上网络安全知识点!真正的体系化!
如果你觉得这些内容对你有帮助,需要这份全套学习资料的朋友可以戳我获取!!
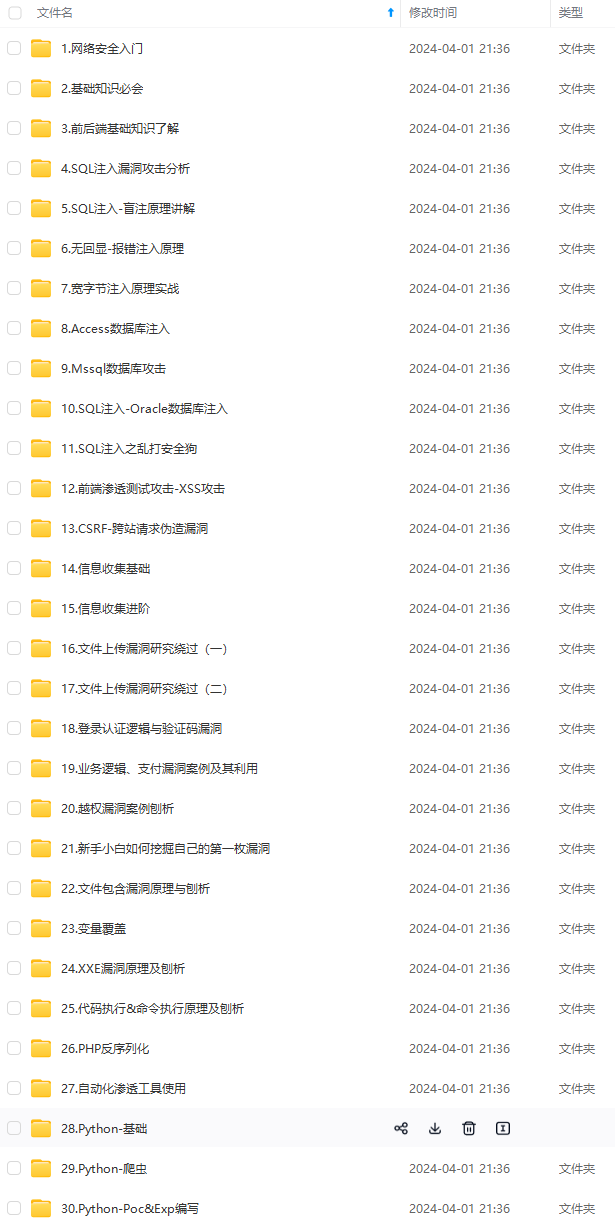
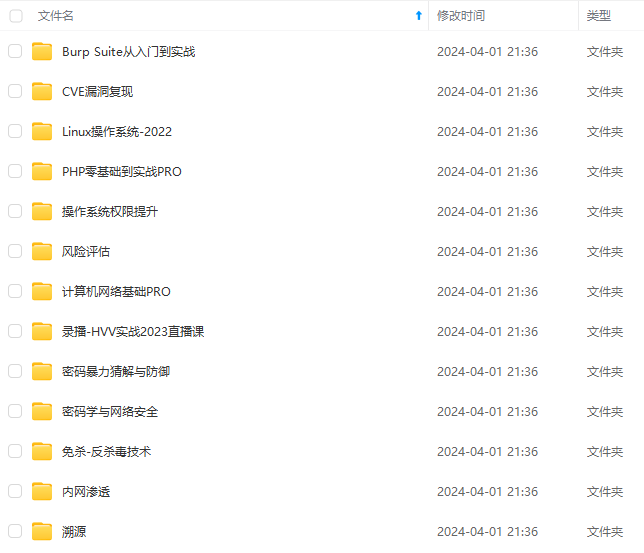
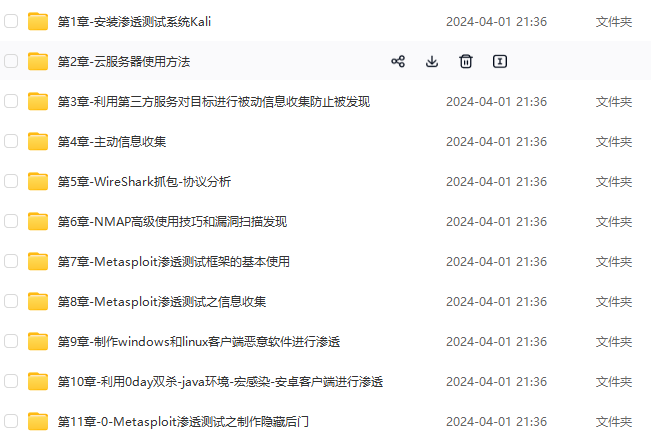
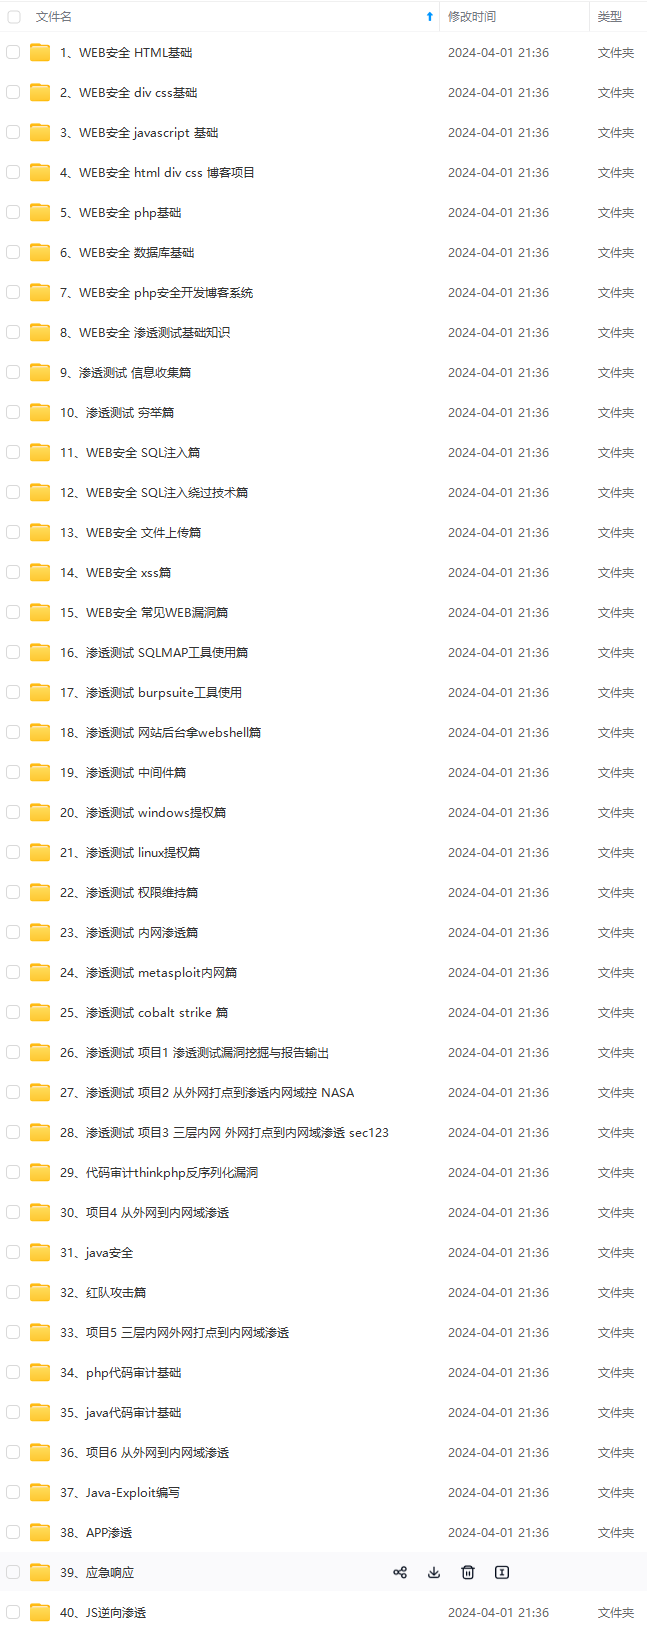
由于文件比较大,这里只是将部分目录截图出来,每个节点里面都包含大厂面经、学习笔记、源码讲义、实战项目、讲解视频,并且会持续更新!
1221)]
[外链图片转存中…(img-XzWaUN7y-1715883151222)]
[外链图片转存中…(img-ZqixwUNE-1715883151222)]
[外链图片转存中…(img-oWT7tmn4-1715883151222)]
[外链图片转存中…(img-37yJj87h-1715883151223)]
既有适合小白学习的零基础资料,也有适合3年以上经验的小伙伴深入学习提升的进阶课程,基本涵盖了95%以上网络安全知识点!真正的体系化!
如果你觉得这些内容对你有帮助,需要这份全套学习资料的朋友可以戳我获取!!
由于文件比较大,这里只是将部分目录截图出来,每个节点里面都包含大厂面经、学习笔记、源码讲义、实战项目、讲解视频,并且会持续更新!


 2738
2738


 被折叠的 条评论
为什么被折叠?
被折叠的 条评论
为什么被折叠?
 到【灌水乐园】发言


