


代码如下:
<!DOCTYPE html>
<html>

<head>
    <meta charset="utf-8">
    <!--引入ECharts脚本-->
    <script src="js/echarts.js"></script>
</head>

<body>
    <!---为ECharts准备一个具备大小(宽高)的DOM-->
    <div id="main" style="width: 800px; height: 400px"></div>
    <script type="text/javascript">
        //基于准备好的DOM,初始化ECharts图表
        var myChart = echarts.init(document.getElementById("main"));
        //指定图表的配置项和数据

        var colors = [' #DBDB70', ' #9F5F9F', '#7093DB'];

 option = {
    title: {
        text: '混合图',
    },

    color: colors,

    tooltip: {
        trigger: 'axis',
        axisPointer: {
            type: 'cross'
        }
    },
    grid: {
        right: '20%'
    },
    toolbox: {
        feature: {
            dataView: {show: true, readOnly: false},
            restore: {show: true},
            saveAsImage: {show: true}
        }
    },
    legend: {
        data: ['蒸发量', '降水量', '平均温度']
    },
    xAxis: [
        {
            type: 'category',
            axisTick: {
                alignWithLabel: true
            },
            data: ['1月', '2月', '3月', '4月', '5月', '6月', '7月', '8月', '9月', '10月', '11月', '12月']
        }
    ],
    yAxis: [
        {
            type: 'value',
            name: '蒸发量',
            min: 0,
            max: 250,
            position: 'right',
            axisLine: {
                lineStyle: {
                    color: colors[0]
                }
            },
            axisLabel: {
                formatter: '{value} ml'
            }
        },
        {
            type: 'value',
            name: '降水量',
            min: 0,
            max: 250,
            position: 'right',
            offset: 80,
            axisLine: {
                lineStyle: {
                    color: colors[1]
                }
            },
            axisLabel: {
                formatter: '{value} ml'
            }
        },
        {
            type: 'value',
            name: '温度',
            min: 0,
            max: 25,
            position: 'left',
            axisLine: {
                lineStyle: {
                    color: colors[2]
                }
            },
            axisLabel: {
                formatter: '{value} °C'
            }
        }
    ],
    series: [
        {
            name: '蒸发量',
            type: 'bar',
            data: [2.0, 4.9, 7.0, 23.2, 25.6, 76.7, 135.6, 162.2, 32.6, 20.0, 6.4, 3.3]
        },
        {
            name: '降水量',
            type: 'bar',
            yAxisIndex: 1,
            data: [2.6, 5.9, 9.0, 26.4, 28.7, 70.7, 175.6, 182.2, 48.7, 18.8, 6.0, 2.3]
        },
        {
            name: '平均温度',
            type: 'line',
            yAxisIndex: 2,
            data: [2.0, 2.2, 3.3, 4.5, 6.3, 10.2, 20.3, 23.4, 23.0, 16.5, 12.0, 6.2]
        }
    ]
};
//使用刚指定的配置项和数据显示图表
myChart.setOption(option);
    </script>
</body>

</html>
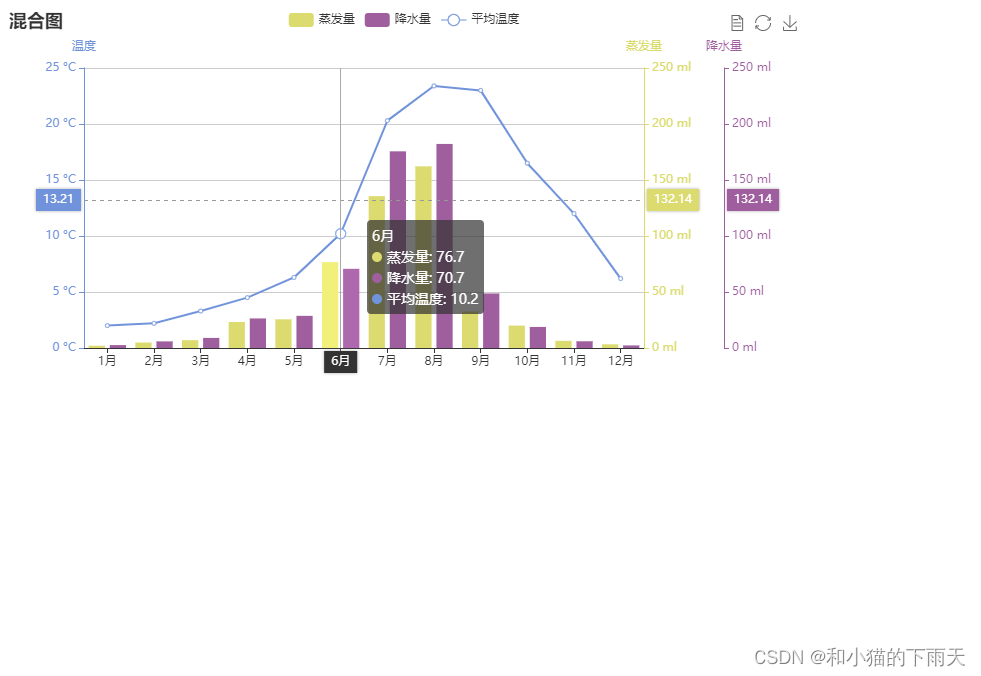
效果展示:
谢谢观看


 1504
1504


 被折叠的 条评论
为什么被折叠?
被折叠的 条评论
为什么被折叠?
 到【灌水乐园】发言


