


如何使用MATLAB数字滤波器 滤波器设计方法 数字滤波器去噪
基于MATLAB的数字滤波器设计及其语音信号去噪应用。
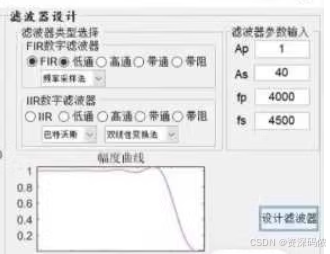
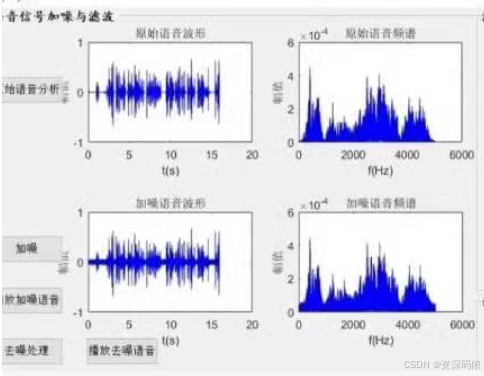
其中数字滤波器包括IIR和FIR的低通、高通、带通、带阻四大类型及其多种设计方法。GUI界面中有语音信号输入模块,滤波器设计模块,语音信号分析及加噪去噪输出模块。
在MATLAB中设计数字滤波器并应用于语音信号的去噪处理,通常包括几个步骤:加载或录制语音信号、设计滤波器、应用滤波器去噪、分析结果。下面我将提供一个基于FIR和IIR滤波器的基本示例代码,涵盖低通、高通、带通和带阻滤波器的设计,并展示如何将其应用于语音信号的去噪。
加载语音信号
首先,我们需要加载一个语音信号。这里假设你有一个.wav格式的语音文件。
% 加载语音信号
[x, fs] = audioread('your_voice_file.wav');
设计FIR滤波器
FIR滤波器可以通过窗函数法等方法设计。以下是设计低通、高通、带通和带阻FIR滤波器的例子:
% 设计参数
fc = 1000; % 截止频率
f1 = 500; f2 = 1500; % 带通/带阻的下限和上限频率
n = 50; % 滤波器阶数

% FIR低通滤波器
b_low = fir1(n, fc/(fs/2));
% FIR高通滤波器
b_high = fir1(n, fc/(fs/2), 'high');
% FIR带通滤波器
b_band = fir1(n, [f1/(fs/2) f2/(fs/2)]);
% FIR带阻滤波器
b_notch = fir1(n, [f1/(fs/2) f2/(fs/2)], 'stop');

% 应用滤波器
y_low = filter(b_low, 1, x);
y_high = filter(b_high, 1, x);
y_band = filter(b_band, 1, x);
y_notch = filter(b_notch, 1, x);
设计IIR滤波器
IIR滤波器通常使用Butterworth、Chebyshev等原型来设计。以下是如何设计这些滤波器的例子:
% IIR低通滤波器
[b_lp, a_lp] = butter(6, fc/(fs/2)); % Butterworth滤波器
% IIR高通滤波器
[b_hp, a_hp] = butter(6, fc/(fs/2), 'high');
% IIR带通滤波器
[b_bp, a_bp] = butter(6, [f1/(fs/2) f2/(fs/2)]);
% IIR带阻滤波器
[b_bs, a_bs] = butter(6, [f1/(fs/2) f2/(fs/2)], 'stop');

% 应用滤波器
y_iir_low = filter(b_lp, a_lp, x);
y_iir_high = filter(b_hp, a_hp, x);
y_iir_band = filter(b_bp, a_bp, x);
y_iir_notch = filter(b_bs, a_bs, x);
分析与播放结果
你可以使用subplot绘制原始和过滤后的信号频谱,并使用sound函数播放它们以比较效果。
% 绘制原始和过滤后信号的频谱
figure;
subplot(2,1,1); spectrogram(x,1024,512,1024,fs,'yaxis'); title('Original Signal');
subplot(2,1,2); spectrogram(y_iir_low,1024,512,1024,fs,'yaxis'); title('Filtered Signal (Low Pass)');

% 播放原始和过滤后的语音信号
sound(x, fs);
pause(length(x)/fs + 1); % 确保原声播放完毕再播放滤波后的音频
sound(y_iir_low, fs);
请注意,上述代码仅为基本示例,实际应用中可能需要根据具体需求调整滤波器的设计参数和类型。此外,MATLAB提供了强大的GUI开发工具(如App Designer),可以用于创建包含语音信号输入、滤波器设计、语音信号分析及加噪去噪输出模块的用户界面。

要实现一个基于MATLAB的GUI应用,用于语音信号的加噪和滤波处理,可以使用MATLAB的App Designer。以下是一个基本的示例代码,展示了如何设计这样的应用,包括加载语音信号、添加噪声、设计滤波器以及应用滤波器进行去噪。
步骤 1: 创建一个新的App Designer项目
- 打开MATLAB。
- 在命令窗口中输入
appdesigner并按回车键。 - 在App Designer中创建一个新的空白应用程序。
步骤 2: 设计用户界面
在App Designer中设计用户界面,包括:
- 按钮(用于加载、播放、加噪、去噪等操作)
- 图形显示区域(用于显示原始信号、加噪信号、滤波后的信号)
- 下拉菜单(用于选择滤波器类型)
- 文本框(用于输入滤波器参数)
步骤 3: 编写回调函数
以下是具体的代码实现:
classdef VoiceFilterApp < matlab.apps.AppBase

    % Properties that correspond to app components
    properties (Access = public)
        UIFigure           matlab.ui.Figure
        LoadButton         matlab.ui.control.Button
        PlayButton         matlab.ui.control.Button
        AddNoiseButton     matlab.ui.control.Button
        FilterButton       matlab.ui.control.Button
        PlotAxes           matlab.ui.control.UIAxes
        SpectrumAxes       matlab.ui.control.UIAxes
        NoisyPlotAxes      matlab.ui.control.UIAxes
        NoisySpectrumAxes  matlab.ui.control.UIAxes
        FilterTypeDropdown matlab.ui.control.DropDown
        ApTextBox          matlab.ui.control.EditField
        AsTextBox          matlab.ui.control.EditField
        FpTextBox          matlab.ui.control.EditField
        FsTextBox          matlab.ui.control.EditField
        FilterPlotAxes     matlab.ui.control.UIAxes
    end

    % Callbacks that handle component events
    methods (Access = private)

        function onButtonLoad(app, event)
            [x, fs] = audioread('your_voice_file.wav');
            app.x = x;
            app.fs = fs;
            plot(app.PlotAxes, (0:length(x)-1)/fs, x);
            title(app.PlotAxes, 'Original Signal');
            xlabel(app.PlotAxes, 'Time (s)');
            ylabel(app.PlotAxes, 'Amplitude');
            axis(app.PlotAxes, [0 length(x)/fs -1 1]);

            [Pxx, f] = periodogram(x, [], [], fs);
            plot(app.SpectrumAxes, f, Pxx);
            title(app.SpectrumAxes, 'Original Spectrum');
            xlabel(app.SpectrumAxes, 'Frequency (Hz)');
            ylabel(app.SpectrumAxes, 'Magnitude');
            axis(app.SpectrumAxes, [0 fs/2 0 max(Pxx)]);
        end

        function onButtonPlay(app, event)
            sound(app.x, app.fs);
        end

        function onButtonAddNoise(app, event)
            noise = randn(size(app.x));
            noisySignal = app.x + 0.5 * noise;
            app.noisySignal = noisySignal;
            plot(app.NoisyPlotAxes, (0:length(noisySignal)-1)/app.fs, noisySignal);
            title(app.NoisyPlotAxes, 'Noisy Signal');
            xlabel(app.NoisyPlotAxes, 'Time (s)');
            ylabel(app.NoisyPlotAxes, 'Amplitude');
            axis(app.NoisyPlotAxes, [0 length(noisySignal)/app.fs -1 1]);

            [Pxx, f] = periodogram(noisySignal, [], [], app.fs);
            plot(app.NoisySpectrumAxes, f, Pxx);
            title(app.NoisySpectrumAxes, 'Noisy Spectrum');
            xlabel(app.NoisySpectrumAxes, 'Frequency (Hz)');
            ylabel(app.NoisySpectrumAxes, 'Magnitude');
            axis(app.NoisySpectrumAxes, [0 app.fs/2 0 max(Pxx)]);
        end

        function onButtonFilter(app, event)
            filterType = app.FilterTypeDropdown.Value;
            Ap = str2double(app.ApTextBox.Text);
            As = str2double(app.AsTextBox.Text);
            Fp = str2double(app.FpTextBox.Text);
            Fs = str2double(app.FsTextBox.Text);

            if strcmp(filterType, 'Lowpass')
                [b, a] = butter(6, Fp/(Fs/2), 'low', [Ap As]);
            elseif strcmp(filterType, 'Highpass')
                [b, a] = butter(6, Fp/(Fs/2), 'high', [Ap As]);
            elseif strcmp(filterType, 'Bandpass')
                [b, a] = butter(6, [Fp/(Fs/2) 4000/(Fs/2)], 'bandpass', [Ap As]);
            elseif strcmp(filterType, 'Bandstop')
                [b, a] = butter(6, [Fp/(Fs/2) 4000/(Fs/2)], 'stop', [Ap As]);
            else
                error('Invalid filter type');
            end

            filteredSignal = filter(b, a, app.noisySignal);
            app.filteredSignal = filteredSignal;
            plot(app.FilterPlotAxes, (0:length(filteredSignal)-1)/app.fs, filteredSignal);
            title(app.FilterPlotAxes, 'Filtered Signal');
            xlabel(app.FilterPlotAxes, 'Time (s)');
            ylabel(app.FilterPlotAxes, 'Amplitude');
            axis(app.FilterPlotAxes, [0 length(filteredSignal)/app.fs -1 1]);

            [Pxx, f] = periodogram(filteredSignal, [], [], app.fs);
            plot(app.FilterPlotAxes, f, Pxx);
            title(app.FilterPlotAxes, 'Filtered Spectrum');
            xlabel(app.FilterPlotAxes, 'Frequency (Hz)');
            ylabel(app.FilterPlotAxes, 'Magnitude');
            axis(app.FilterPlotAxes, [0 app.fs/2 0 max(Pxx)]);
        end
    end

    % App initialization and setup
    methods (Access = private)

        function createComponents(app)
            app.UIFigure = uifigure;
            app.LoadButton = uibutton(app.UIFigure, 'Text', 'Load', 'Position', [20 20 80 22], 'ButtonPushedFcn', @(~,~) app.onButtonLoad(~,~));
            app.PlayButton = uibutton(app.UIFigure, 'Text', 'Play', 'Position', [110 20 80 22], 'ButtonPushedFcn', @(~,~) app.onButtonPlay(~,~));
            app.AddNoiseButton = uibutton(app.UIFigure, 'Text', 'Add Noise', 'Position', [200 20 80 22], 'ButtonPushedFcn', @(~,~) app.onButtonAddNoise(~,~));
            app.FilterButton = uibutton(app.UIFigure, 'Text', 'Filter', 'Position', [290 20 80 22], 'ButtonPushedFcn', @(~,~) app.onButtonFilter(~,~));
            app.PlotAxes = uiaxes(app.UIFigure, 'Position', [20 50 200 200]);
            app.SpectrumAxes = uiaxes(app.UIFigure, 'Position', [230 50 200 200]);
            app.NoisyPlotAxes = uiaxes(app.UIFigure, 'Position', [20 270 200 200]);
            app.NoisySpectrumAxes = uiaxes(app.UIFigure, 'Position', [230 270 200 200]);
            app.FilterPlotAxes = uiaxes(app.UIFigure, 'Position', [20 490 200 200]);
            app.FilterTypeDropdown = uidropdown(app.UIFigure, 'Items', {'Lowpass', 'Highpass', 'Bandpass', 'Bandstop'}, 'Position', [290 50 100 22]);
            app.ApTextBox = uieditfield(app.UIFigure, 'numeric', 'Position', [290 100 50 22]);
            app.AsTextBox = uieditfield(app.UIFigure, 'numeric', 'Position', [345 100 50 22]);
            app.FpTextBox = uieditfield(app.UIFigure, 'numeric', 'Position', [290 150 50 22]);
            app.FsTextBox = uieditfield(app.UIFigure, 'numeric', 'Position', [345 150 50 22]);
        end
    end

    % Called when the app starts
    methods (Access = public)

        function start(app)
            createComponents(app);
        end
    end
end
解释
- 加载语音信号:通过
audioread函数读取语音文件,并绘制原始信号及其频谱。 - 播放语音信号:使用
sound函数播放语音信号。 - 添加噪声:生成随机噪声并将其添加到原始信号中,然后绘制加噪信号及其频谱。
- 设计滤波器:根据用户选择的滤波器类型和参数,设计相应的IIR滤波器。
- 应用滤波器:使用
filter函数对加噪信号进行滤波,并绘制滤波后的信号及其频谱


 1042
1042

 被折叠的 条评论
为什么被折叠?
被折叠的 条评论
为什么被折叠?
 到【灌水乐园】发言


