


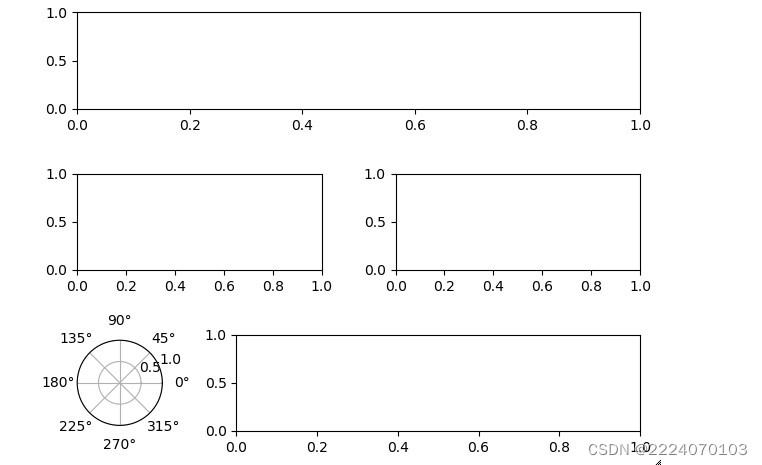
%matplotlib notebook
import matplotlib.pyplot as plt
import matplotlib.gridspec as gridspec
#1.创建画布实例

fig=plt.figure()

#2.创建“区域规划图”实例
spec=gridspec.GridSpec(3,4,figure=fig)

#3.根据给定的“区域规划图”,创建对应的坐标系实例
ax1=plt.subplot(spec[0,:])
ax2=plt.subplot(spec[1,0:2])
ax3=plt.subplot(spec[1,2:4])
ax4=plt.subplot(spec[2,0],projection='polar')
ax5=plt.subplot(spec[2,1:4])
plt.tight_layout()
plt.show()
运行结果


 813
813


 被折叠的 条评论
为什么被折叠?
被折叠的 条评论
为什么被折叠?
 到【灌水乐园】发言


