


 本文概述了图像分割质量的评价方法,包括主观评价、分析方法、无监督和监督方法。监督方法如误分类错误(Misclassification Error)、召回率(Recall)和结构相似性指数(SSIM)依赖于理想分割图像,而无监督方法如区域不均匀性(Region Nonuniformity)、F和Q指标则不需要参考图像。这些评价标准在衡量分割算法的性能和比较不同算法时起着关键作用。
图像分割质量评价方法
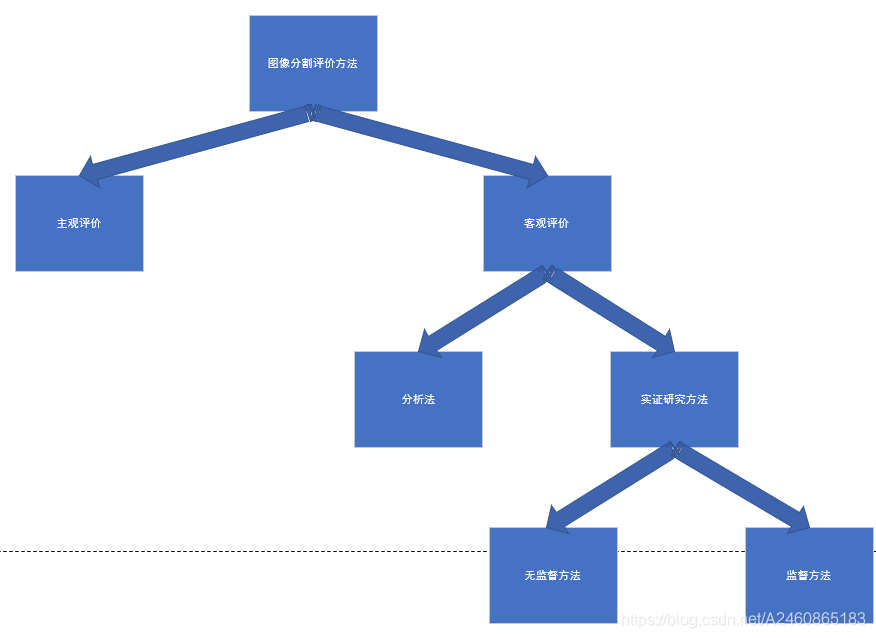
- 主观评价由人对分割结果进行评价。这种方法的缺点是视觉或定性评价本质上是主观的。主观评价分数可能会有很大的不同,从一个人评估到另一个,因为每个评估者有自己独特的标准来评估分割图像的质量。
- 分析方法直接处理分割算法本身,考虑算法的原理、要求、用途、复杂度等。分析方法只适用于评价分割算法的算法或实现特性。这些特性通常与算法分割结果的质量无关,因此这些特性不能有效地表征不同分割算法的性能差异。
- 无监督方法通过判断分割图像的质量来评价算法的性能。不需要参考图像,而是根据分割图像与人类所期望的分割图像的广泛特征的匹配程度来评估分割图像。无监督评估是定量和客观的。它有明显的优势,也许最关键的是它不需要参考图像。手工创建的参考图像本质上是主观的,创建这样的参考图像是乏味和耗时的,对于许多应用程序来说,这是困难的,甚至是不可能的。
- 监督方法通过分割图像和正确/理想分割图像(参考图像)之间的差距来评估算法的性能。难点在于理想分割图像的获取。必须指明:两个(实际分割和参考)图像都是从相同的输入图像中获得的。
参考文献:
[1]Zhang Y J. A survey on evaluation methods for image segmentation[J]. Pattern recognition, 1996, 29(8): 1335-1346.
[2]Zhang H, Fritts J E, Goldman S A. Image segmentation evaluation: A survey of unsupervised methods[J]. computer vision and image understanding, 2008, 110(2): 260-280.
1 监督方法
1.1 Misclassification error (误分割错误)
误分类错误(ME)的标准是衡量分割的性能的方法之一。ME是根据图像与人类观察的相关性来定义的。它对应的是错误分配给前景的背景像素的比例,反之亦然。
M
E
=
1
−
∣
B
O
∩
B
T
∣
+
∣
F
O
∩
F
T
∣
∣
B
O
∣
∩
∣
F
O
∣
ME = 1-\dfrac{{\vert}B_O{\cap}B_T{\vert}+{\vert}F_O{\cap}F_T{\vert}}{{\vert}B_O{\vert}{\cap}{\vert}F_O{\vert}}
ME=1−∣BO∣∩∣FO∣∣BO∩BT∣+∣FO∩FT∣
其中,
B
O
B_O
BO和
F
O
F_O
FO分别表示理想图像的背景和前景。而
B
T
B_T
BT和
F
T
F_T
FT表示结果图像的背景和前景。运算符
∣
⋅
∣
| \cdot|
∣⋅∣表示集合
⋅
\cdot
⋅中的元素数目。综上,在阈值最优的情形下,ME的值等于0,在最坏情况下,ME的值等于1。
注:Misclassification error (误分割错误)的思维虽然简单,但是难点在于给定图像的理想图像的获取。
参考文献:
[1]Nie F, Zhang P, Li J, et al. A novel generalized entropy and its application in image thresholding[J]. Signal Processing, 2017, 134: 23-34.
[2]Lin Q, Ou C. Tsallis entropy and the long-range correlation in image thresholding[J]. Signal Processing, 2012, 92(12): 2931-2939.
[3]Sezgin M, Sankur B. Survey over image thresholding techniques and quantitative performance evaluation[J]. Journal of Electronic imaging, 2004, 13(1): 146-165.
1.2 Recall
Recall用来评价一种方法的前景提取能力。其计算如下:
R
e
c
a
l
l
=
∣
F
O
∩
F
T
∣
∣
F
T
∣
Recall=\dfrac{{\vert}F_O{\cap}F_T{\vert}}{{\vert}F_T{\vert}}
Recall=∣FT∣∣FO∩FT∣
其中,
F
O
F_O
FO表示理想图像的前景。
F
T
F_T
FT表示结果图像的前景。
参考文献:
[1]Xing J, Yang P, Qingge L. Automatic thresholding using a modified valley emphasis[J]. IET Image Processing, 2020, 14(3): 536-544.
[2]Huang D, Zhang J, Huang K. Automatic microblog-oriented unknown word recognition with unsupervised method[J]. Chinese Journal of Electronics, 2018, 27(1): 1-8.
1.3 SSIM(图像相似度)
SSIM算法用来评价图像的结构相似性。其计算如下:
S
S
I
M
(
x
,
y
)
=
(
2
μ
x
μ
y
+
C
1
)
(
2
σ
x
y
+
C
2
)
(
μ
x
2
+
μ
y
2
+
C
1
)
(
σ
x
2
+
σ
y
2
+
C
2
)
SSIM(x,y)=\dfrac{(2{\mu}_x{\mu}_y+C_1)(2{\sigma}_{xy}+C_2)}{({\mu}_x^2+{\mu}_y^2+C_1)({\sigma}_x^2+{\sigma}_y^2+C_2)}
SSIM(x,y)=(μx2+μy2+C1)(σx2+σy2+C2)(2μxμy+C1)(2σxy+C2)
其中,
μ
x
{\mu}_x
μx和
μ
y
{\mu}_y
μy表示图像
x
,
y
x,y
x,y的像素平均强度,
σ
x
{\sigma}_x
σx和
σ
y
{\sigma}_y
σy表示图像
x
,
y
x,y
x,y的像素标准差,
σ
x
y
{\sigma}_{xy}
σxy表示
x
,
y
x,y
x,y的相关系数。返回值在(0,1)之间,值越大表示图像质量越好。
参考文献:
[1]Wang Z, Bovik A C, Sheikh H R, et al. Image quality assessment: from error visibility to structural similarity[J]. IEEE transactions on image processing, 2004, 13(4): 600-612.
2 无监督方法
2.1 Region Nonuniformity(区域不均匀性)
区域不均匀性(RN)的标准是一种不需要用到理想图像的测量图像分割质量的方法。
N
U
=
∣
F
T
∣
∣
F
T
+
B
T
∣
⋅
σ
f
2
σ
2
NU = \dfrac{{\vert}F_T{\vert}}{{\vert}F_T+B_T{\vert}}{\cdot}\dfrac{\sigma_f^2}{\sigma^2}
NU=∣FT+BT∣∣FT∣⋅σ2σf2
其中,
B
T
B_T
BT和
F
T
F_T
FT表示结果图像的背景和前景。
σ
2
\sigma^2
σ2表示整个图像的方差,而
σ
f
2
\sigma_f^2
σf2表示前景图像的方差。运算符
∣
⋅
∣
| \cdot|
∣⋅∣表示集合
⋅
\cdot
⋅中的元素数目。在理想的情形下,NU的值将会接近0,而在最坏的情形下,NU的值将会接近于1。
注:在文献[2][3][4]中有一般的RN表达式,适用于多分类。
参考文献:
[1]Sezgin M, Sankur B. Survey over image thresholding techniques and quantitative performance evaluation[J]. Journal of Electronic imaging, 2004, 13(1): 146-165.
[2]Levine M D, Nazif A M. Dynamic measurement of computer generated image segmentations[J]. IEEE transactions on pattern analysis and machine intelligence, 1985 (2): 155-164.
[3]Sahoo P K, Soltani S, Wong A K C. A survey of thresholding techniques[J]. Computer vision, graphics, and image processing, 1988, 41(2): 233-260.
[4]Zhang H, Fritts J E, Goldman S A. Image segmentation evaluation: A survey of unsupervised methods[J]. computer vision and image understanding, 2008, 110(2): 260-280.
2.2 F
Liu和Yang1994提出了一个不需要任何用户集参数或阈值的函数,用于定量评价彩色图像分割算法的性能。
F
(
I
)
=
1
1000
(
N
×
M
)
×
R
×
∑
i
=
1
R
[
e
i
2
A
i
]
F(I) = \dfrac{1}{1000(N{\times}M)}{\times}{\sqrt{R}}{\times}{\sum_{i=1}^R{}}{\bigg[}\dfrac{e_i^2}{{\sqrt{A_i}}}{\bigg]}
F(I)=1000(N×M)1×R×∑i=1R[Aiei2]
其中,
(
M
×
N
)
(M{\times}N)
(M×N)为图像的像素个数,
R
R
R是分割图像的区域个数。
A
i
A_i
Ai表示第
i
i
i个区域的像素个数。
e
i
2
e_i^2
ei2表示第
i
i
i个区域的平方颜色误差。
注:式中1000仅为比例压缩系数。
参考文献:
[1]Liu J, Yang Y H. Multiresolution color image segmentation[J]. IEEE Transactions on Pattern Analysis and Machine Intelligence, 1994, 16(7): 689-700.
[2]Borsotti M, Campadelli P, Schettini R. Quantitative evaluation of color image segmentation results[J]. Pattern recognition letters, 1998, 19(8): 741-747.
2.3 Q
M. Borsotti对F法的改进。
Q
(
I
)
=
1
10000
(
N
×
M
)
×
R
×
∑
i
=
1
R
[
e
i
2
1
+
l
o
g
A
i
+
(
R
(
A
i
)
A
i
)
2
]
Q(I) = \dfrac{1}{10000(N{\times}M)}{\times}{\sqrt{R}}{\times}{\sum_{i=1}^R{}}{\bigg[}\dfrac{e_i^2}{1+logA_i}+\big(\dfrac{R(A_i)}{A_i}\big)^2{\bigg]}
Q(I)=10000(N×M)1×R×∑i=1R[1+logAiei2+(AiR(Ai))2]
其中,
(
M
×
N
)
(M{\times}N)
(M×N)为图像的像素个数,
R
R
R是分割图像的区域个数。
A
i
A_i
Ai表示第
i
i
i个区域的像素个数。
R
(
A
i
)
R(A_i)
R(Ai)是面积为
A
i
A_i
Ai的区域数,
e
i
2
e_i^2
ei2表示第
i
i
i个区域的平方颜色误差。
注:上式中有的文献中是1000,原文是10000,不过都是比例系数。
参考文献:
[1]Borsotti M, Campadelli P, Schettini R. Quantitative evaluation of color image segmentation results[J]. Pattern recognition letters, 1998, 19(8): 741-747.
[2]Zhang H, Fritts J E, Goldman S A. Image segmentation evaluation: A survey of unsupervised methods[J]. computer vision and image understanding, 2008, 110(2): 260-280.
[3]Zhang H, Fritts J E, Goldman S A. Entropy-based objective evaluation method for image segmentation[C]//Storage and Retrieval Methods and Applications for Multimedia 2004. International Society for Optics and Photonics, 2003, 5307: 38-49.


 1459
1459

 被折叠的 条评论
为什么被折叠?
被折叠的 条评论
为什么被折叠?
 到【灌水乐园】发言


