Seaborn 颜色设置

通过在seaborn的plot方法中对其 palette 参数进行调色盘设置即可

import pandas as pd
import numpy as np
import matplotlib as mpl
import matplotlib.pyplot as plt
import matplotlib.colors as colors
import seaborn as sns


# 初始化画板
def initPlot():
    sns.set(style="whitegrid", palette="muted",
            color_codes=True, font='SimHei')  # set( )设置主题,调色板更常用
    # mpl.rcParams['font.family'] = 'SimHei'
    plt.rcParams['axes.unicode_minus'] = False  # 解决坐标轴负数的负号显示问题


initPlot()
df_A = readData()  # 读取excel数据

plt.figure(figsize=(50,10)) # 扩大行间距
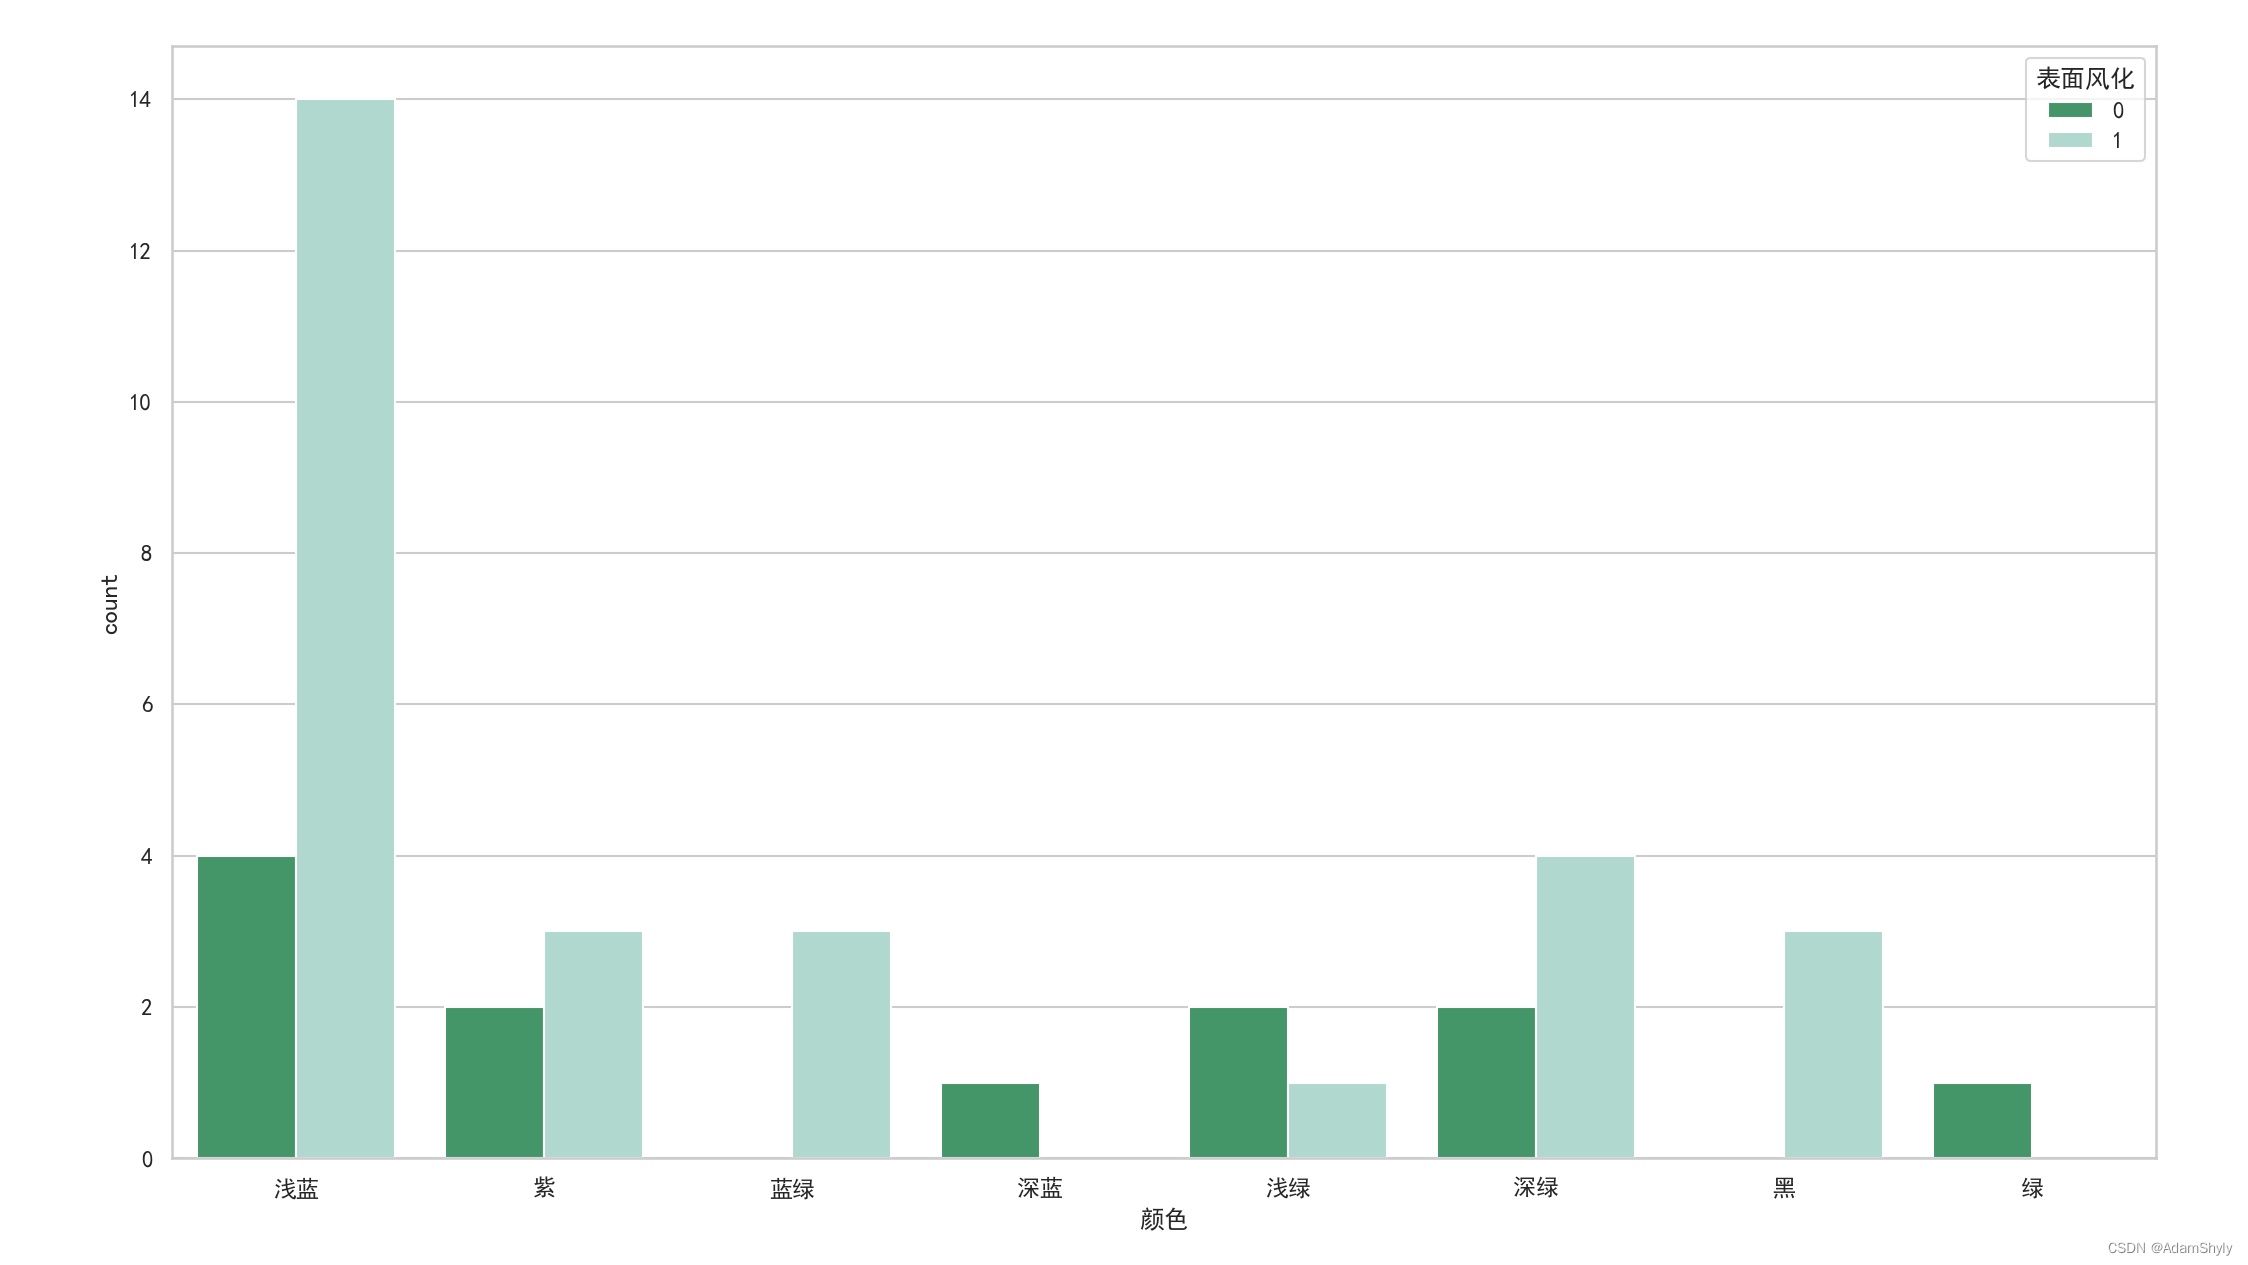
sns.countplot(x="颜色", hue="表面风化", data=df_A,
              palette=sns.color_palette("BuGn_r", 2))
plt.show()

效果如下 

  • 1
    点赞
  • 7
    收藏
    觉得还不错? 一键收藏
  • 0
    评论
1. 目录 1. 目录 2 2. 绘图函数Plotting functions 4 2.1. 可视化的统计关系Visualizing statistical relationships 4 2.1.1. 用散点图联系变量Relating variables with scatter plots 4 2.1.2. 强调线条图的连续性Emphasizing continuity with line plots 10 2.1.3. 显示与切面的多个关系Showing multiple relationships with facets 21 2.2. 分类数据绘图Plotting with categorical data 24 2.2.1. 分类散点图Categorical scatterplots 26 2.2.2. 分类观测值分布Distributions of observations within categories 31 2.2.3. 分类统计估计Statistical estimation within categories 37 2.2.4. 对“wide-form”数据作图Plotting “wide-form” data 41 2.2.5. 显示与facet的多个关系Showing multiple relationships with facets 43 2.3. 可视化数据集的分布Visualizing the distribution of a dataset 44 2.3.1. 绘制单变量分布Plotting univariate distributions 45 2.3.2. 绘制二元分布Plotting bivariate distributions 51 2.3.3. 在数据集中可视化成对关系Visualizing pairwise relationships in a dataset 55 2.4. 可视化线性关系Visualizing linear relationships 57 2.4.1. 函数绘制线性模型Functions to draw linear regression models 58 2.4.2. 拟合不同种类的模型Fitting different kinds of models 61 2.4.3. 在其他变量上的情况Conditioning on other variables 68 2.4.4. 控制图表的大小和形状Controlling the size and shape of the plot 71 2.4.5. 在其他上下文中绘制回归图Plotting a regression in other contexts 73 3. 多图网格Multi-plot grids 76 3.1. 构建结构化的多图网格Building structured multi-plot grids 76 3.2. 有条件的小倍数Conditional small multiples 77 3.3. 使用定制函数Using custom functions 86 3.4. 绘制成对的数据关系Plotting pairwise data relationships 90 4. 绘图美学Plot aesthetics 99 4.1. 控制图表美学Controlling figure aesthetics 99 4.1.1. Seaborn图表风格Seaborn figure styles 101 4.1.2. 删除轴上的小凸起Removing axes spines 104 4.1.3. 临时设置图表样式Temporarily setting figure style 105 4.1.4. 覆盖Seaborn样式的元素Overriding elements of the seaborn styles 106 4.1.5. 缩放图表元素Scaling plot elements 108 4.2. 选择调色板Choosing color palettes 111 4.2.1. 创建颜色调色板Building color palettes 111 4.2.2. 定性调色板Qualitative color palettes 112 4.2.3. 连续调色板Sequential color palettes 116 4.2.4. 不同颜色的调色板Diverging color palettes 122 4.2.5. 设置默认调色板Setting the default color palette 124 5. 教程中的数据集 125
Seaborn是在matplotlib的基础上进行了更高级的封装,可以更方便地绘制各种精美和方便分析数据的图表。其中,直方图Seaborn中的一种常见图表之一。直方图用来展示数据的分布情况,通过将数据划分为不同的分组(也称为bin),并统计每个分组中的数据数量来展示数据的分布情况。 在Seaborn中,通过histplot函数可以绘制直方图。可以使用不同的参数来控制直方图的外观和展示方式。例如,可以自定义直方图颜色、线条样式和填充方式等。另外,还可以添加边界箱线图(boxplot)来同时展示数据的分布和离群值的情况。 此外,Seaborn还提供了边际图(marginal plot)的功能。边际图可以很好地展示两个数值变量之间的关系。通常中央图表显示两个变量的相关性,可以是散点图、hexbin图、2D直方图或2D密度图。边缘图通常在顶部和右侧,使用直方图或密度图显示两个变量的分布。可以使用kind参数来指定不同类型的边际图,如scatter(散点图)、reg(边界回归图)、resid(边界残差图)、kde(边界核密度图)或hex(边界六角图)。 下面是使用Seaborn绘制直方图的示例代码: import seaborn as sns sns.histplot(data=df, x="sepal_length") 这段代码将通过Seaborn绘制一个直方图,其中数据来自DataFrame df,x轴表示sepal_length列的数据。你可以根据需要进行相应的修改和定制。<span class="em">1</span><span class="em">2</span><span class="em">3</span> #### 引用[.reference_title] - *1* [python-seaborn库数据可视化{直方图、散点图、箱线图、变量关系图、热力图、条形图}](https://blog.csdn.net/weixin_57501965/article/details/126625267)[target="_blank" data-report-click={"spm":"1018.2226.3001.9630","extra":{"utm_source":"vip_chatgpt_common_search_pc_result","utm_medium":"distribute.pc_search_result.none-task-cask-2~all~insert_cask~default-1-null.142^v93^chatsearchT3_1"}}] [.reference_item style="max-width: 50%"] - *2* *3* [[seaborn] seaborn学习笔记3-直方图Histogramplot](https://blog.csdn.net/LuohenYJ/article/details/90704424)[target="_blank" data-report-click={"spm":"1018.2226.3001.9630","extra":{"utm_source":"vip_chatgpt_common_search_pc_result","utm_medium":"distribute.pc_search_result.none-task-cask-2~all~insert_cask~default-1-null.142^v93^chatsearchT3_1"}}] [.reference_item style="max-width: 50%"] [ .reference_list ]

“相关推荐”对你有帮助么?

  • 非常没帮助
  • 没帮助
  • 一般
  • 有帮助
  • 非常有帮助
提交
评论
添加红包

请填写红包祝福语或标题

红包个数最小为10个

红包金额最低5元

当前余额3.43前往充值 >
需支付:10.00
成就一亿技术人!
领取后你会自动成为博主和红包主的粉丝 规则
hope_wisdom
发出的红包
实付
使用余额支付
点击重新获取
扫码支付
钱包余额 0

抵扣说明:

1.余额是钱包充值的虚拟货币,按照1:1的比例进行支付金额的抵扣。
2.余额无法直接购买下载,可以购买VIP、付费专栏及课程。

余额充值