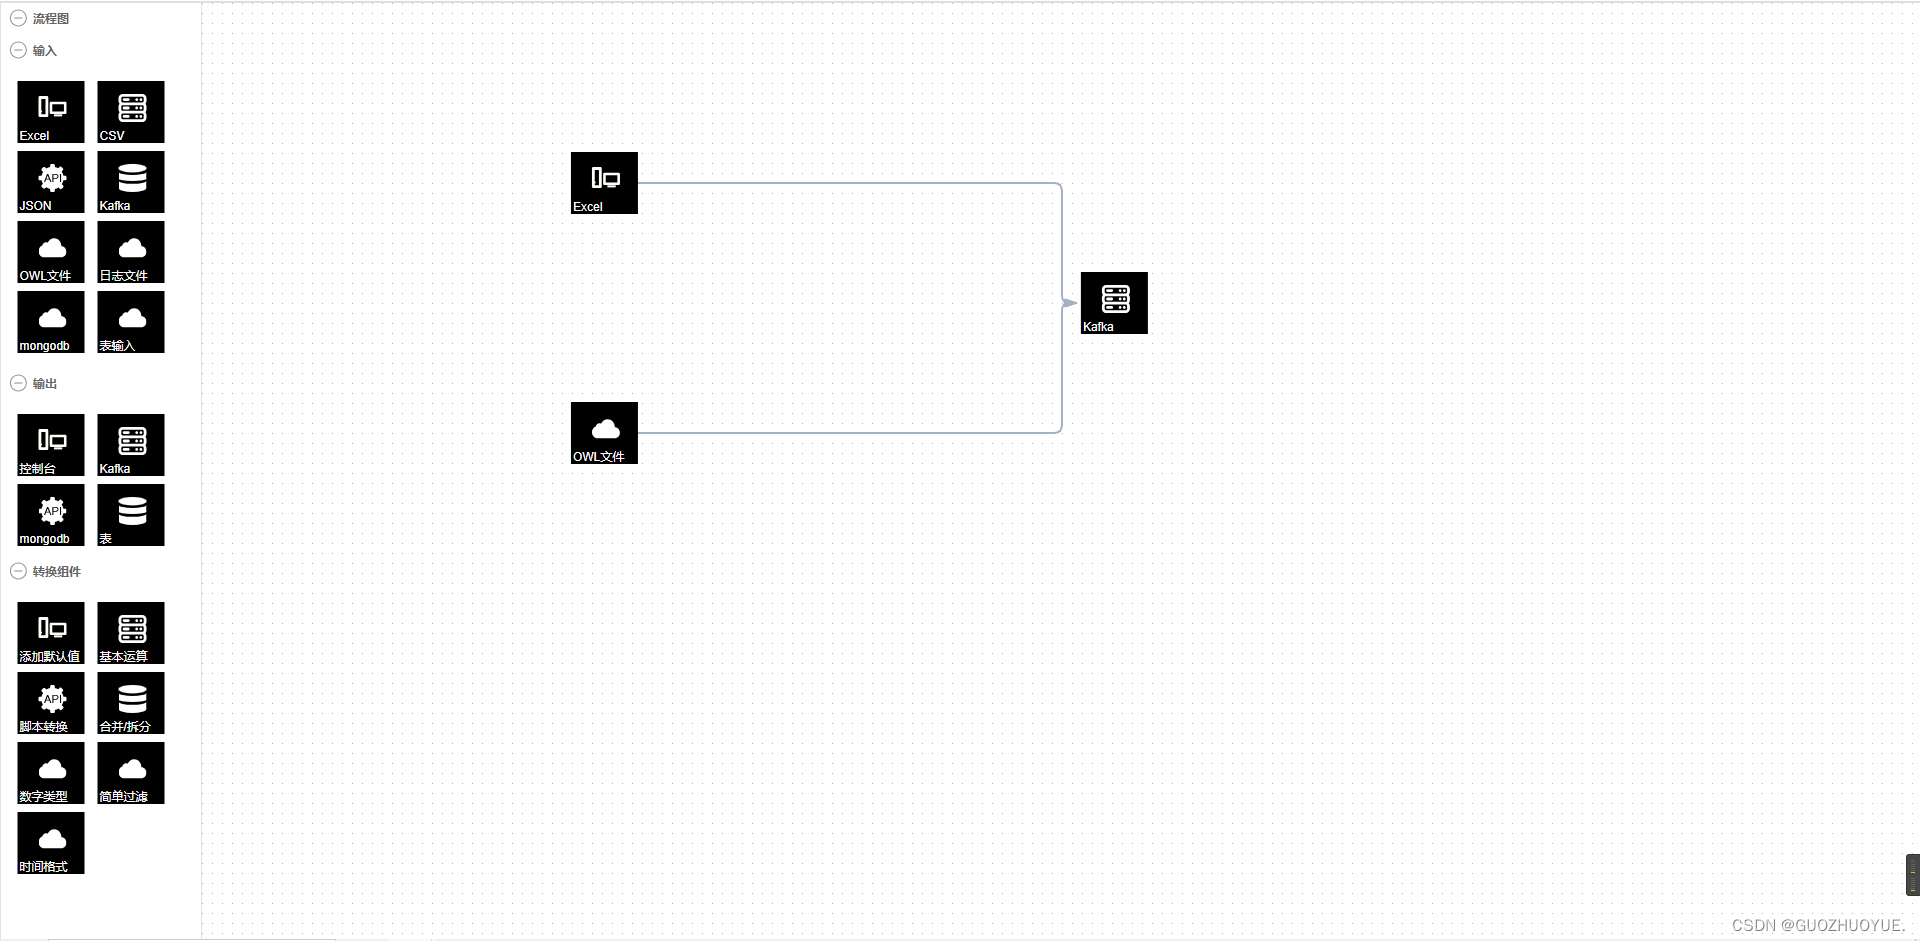
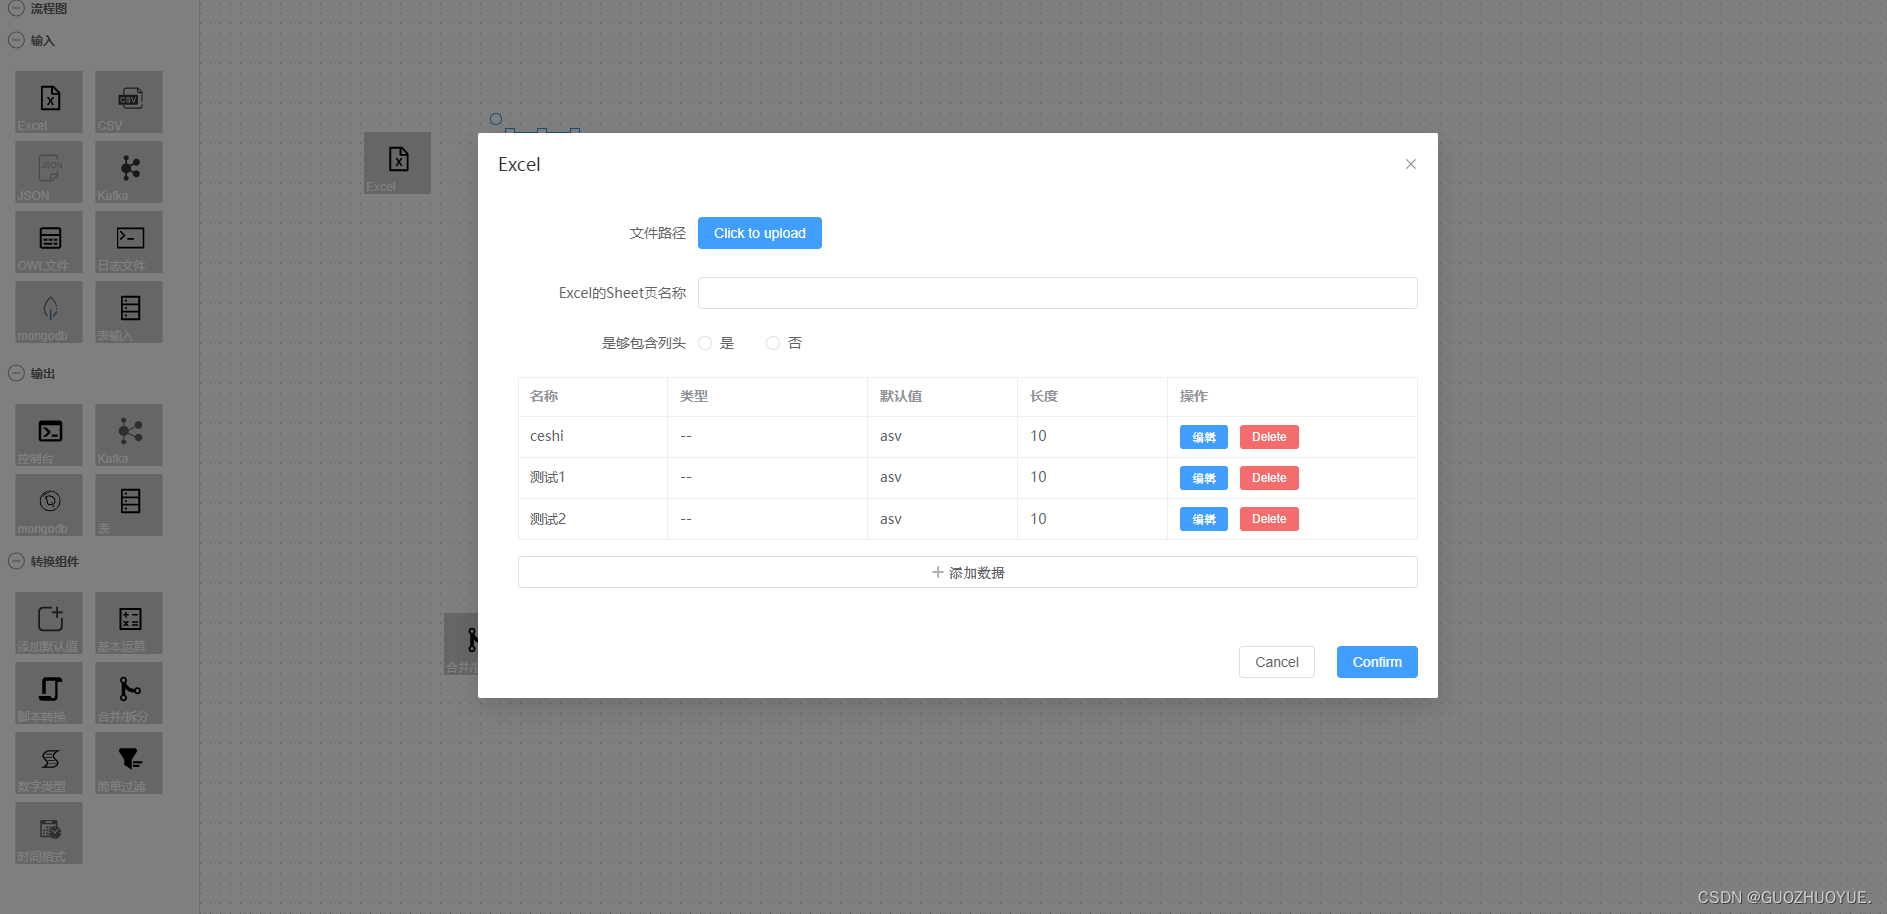
需求效果:


需求:
实现一个流程图,双击可对相应的组件进行一些功能操作;
工具栈:
这里使用@antv/x6, 基于vue3+vite+ts进行开发
官网地址:
https://x6.antv.antgroup.com/examples/showcase/practices/#flowchart
代码:
<template>
<div id="container">
<router-view />
</div>
</template>
<script lang="ts" setup>
import { Graph, Shape } from '@antv/x6'
import { Stencil } from '@antv/x6-plugin-stencil'
import { Transform } from '@antv/x6-plugin-transform'
import { Selection } from '@antv/x6-plugin-selection'
import { Snapline } from '@antv/x6-plugin-snapline'
import { Keyboard } from '@antv/x6-plugin-keyboard'
import { Clipboard } from '@antv/x6-plugin-clipboard'
import { History } from '@antv/x6-plugin-history'
import insertCss from 'insert-css'
import { useRouter } from "vue-router"
// 引入本地图片
const getImageUrl = (url: any) => {
return new URL(url, import.meta.url).href;
}
const router = useRouter()
onMounted(() => {
// 为了协助代码演示
preWork()
// #region 初始化画布
const graph = new Graph({
container: document.getElementById('graph-container')!,
grid: true,
mousewheel: {
enabled: true,
zoomAtMousePosition: true,
modifiers: 'ctrl',
minScale: 0.5,
maxScale: 3,
},
connecting: {
router: 'manhattan',
connector: {
name: 'rounded',
args: {
radius: 8,
},
},
anchor: 'left',
connectionPoint: 'anchor',
allowBlank: false,
snap: {
radius: 20,
},
createEdge() {
return new Shape.Edge({
attrs: {
line: {
stroke: '#A2B1C3',
strokeWidth: 2,
targetMarker: {
name: 'block',
width: 12,
height: 8,
},
},
},
zIndex: 0,
//....
})
},
validateConnection({ targetMagnet }) {
return !!targetMagnet
},
},
highlighting: {
magnetAdsorbed: {
name: 'stroke',
args: {
attrs: {
fill: '#5F95FF',
stroke: '#5F95FF',
},
},
},
},
})
// #endregion
// #region 使用插件
graph
.use(
new Transform({
resizing: true,
rotating: true,
}),
)
.use(
new Selection({
rubberband: true,
showNodeSelectionBox: true,
}),
)
.use(new Snapline())
.use(new Keyboard())
.use(new Clipboard())
.use(new History())
// #endregion
// #region 初始化 stencil
const stencil = new Stencil({
title: '流程图',
target: graph,
stencilGraphWidth: 300,
stencilGraphHeight: 180,
collapsable: true,
groups: [
{
title: '输入',
name: 'group2',
graphHeight: 300,
layoutOptions: {
rowHeight: 70,
},
},
{
title: '输出',
name: 'group3',
graphHeight: 0,
layoutOptions: {
rowHeight: 70,
},
},
{
title: '转换组件',
name: 'group1',
graphHeight: 300,
layoutOptions: {
rowHeight: 70,
},
},
],
layoutOptions: {
columns: 2,
columnWidth: 80,
rowHeight: 55,
},
})
document.getElementById('stencil')!.appendChild(stencil.container)
// #endregion
// #region 快捷键与事件
graph.bindKey(['meta+c', 'ctrl+c'], () => {
const cells = graph.getSelectedCells()
if (cells.length) {
graph.copy(cells)
}
return false
})
graph.bindKey(['meta+x', 'ctrl+x'], () => {
const cells = graph.getSelectedCells()
if (cells.length) {
graph.cut(cells)
}
return false
})
graph.bindKey(['meta+v', 'ctrl+v'], () => {
if (!graph.isClipboardEmpty()) {
const cells = graph.paste({ offset: 32 })
graph.cleanSelection()
graph.select(cells)
}
return false
})
// undo redo
graph.bindKey(['meta+z', 'ctrl+z'], () => {
if (graph.canUndo()) {
graph.undo()
}
return false
})
graph.bindKey(['meta+shift+z', 'ctrl+shift+z'], () => {
if (graph.canRedo()) {
graph.redo()
}
return false
})
// select all
graph.bindKey(['meta+a', 'ctrl+a'], () => {
const nodes = graph.getNodes()
if (nodes) {
graph.select(nodes)
}
})
// delete
graph.bindKey('backspace', () => {
const cells = graph.getSelectedCells()
if (cells.length) {
graph.removeCells(cells)
}
})
// zoom
graph.bindKey(['ctrl+1', 'meta+1'], () => {
const zoom = graph.zoom()
if (zoom < 1.5) {
graph.zoom(0.1)
}
})
graph.bindKey(['ctrl+2', 'meta+2'], () => {
const zoom = graph.zoom()
if (zoom > 0.5) {
graph.zoom(-0.1)
}
})
// 控制连接桩显示/隐藏
const showPorts = (ports: NodeListOf<SVGElement>, show: boolean) => {
for (let i = 0, len = ports.length; i < len; i += 1) {
ports[i].style.visibility = show ? 'visible' : 'hidden'
}
}
graph.on('node:mouseenter', () => {
const container = document.getElementById('graph-container')!
const ports = container.querySelectorAll(
'.x6-port-body',
) as NodeListOf<SVGElement>
showPorts(ports, true)
})
graph.on('node:mouseleave', () => {
const container = document.getElementById('graph-container')!
const ports = container.querySelectorAll(
'.x6-port-body',
) as NodeListOf<SVGElement>
showPorts(ports, false)
})
// #endregion
// #region 初始化图形
const ports = {
groups: {
top: {
position: 'top',
attrs: {
circle: {
r: 4,
magnet: true,
stroke: '#5F95FF',
strokeWidth: 1,
fill: '#fff',
style: {
visibility: 'hidden',
},
},
},
},
right: {
position: 'right',
attrs: {
circle: {
r: 4,
magnet: true,
stroke: '#5F95FF',
strokeWidth: 1,
fill: '#fff',
style: {
visibility: 'hidden',
},
},
},
},
bottom: {
position: 'bottom',
attrs: {
circle: {
r: 4,
magnet: true,
stroke: '#5F95FF',
strokeWidth: 1,
fill: '#fff',
style: {
visibility: 'hidden',
},
},
},
},
left: {
position: 'left',
attrs: {
circle: {
r: 4,
magnet: true,
stroke: '#5F95FF',
strokeWidth: 1,
fill: '#fff',
style: {
visibility: 'hidden',
},
},
},
},
},
items: [
{
group: 'top',
},
{
group: 'right',
},
{
group: 'bottom',
},
{
group: 'left',
},
],
}
Graph.registerNode(
'custom-rect',
{
inherit: 'rect',
width: 66,
height: 36,
attrs: {
body: {
strokeWidth: 1,
stroke: '#5F95FF',
fill: '#EFF4FF',
},
text: {
fontSize: 12,
fill: '#262626',
},
},
ports: { ...ports },
},
true,
)
Graph.registerNode(
'custom-polygon',
{
inherit: 'polygon',
width: 66,
height: 36,
attrs: {
body: {
strokeWidth: 1,
stroke: '#5F95FF',
fill: '#EFF4FF',
},
text: {
fontSize: 12,
fill: '#262626',
},
},
ports: {
...ports,
items: [
{
group: 'top',
},
{
group: 'bottom',
},
],
},
},
true,
)
Graph.registerNode(
'custom-circle',
{
inherit: 'circle',
width: 45,
height: 45,
attrs: {
body: {
strokeWidth: 1,
stroke: '#5F95FF',
fill: '#EFF4FF',
},
text: {
fontSize: 12,
fill: '#262626',
},
},
ports: { ...ports },
},
true,
)
Graph.registerNode(
'custom-image',
{
inherit: 'rect',
width: 65,
height: 60,
markup: [
{
tagName: 'rect',
selector: 'body',
},
{
tagName: 'image',
},
{
tagName: 'text',
selector: 'label',
},
],
attrs: {
body: {
stroke: '#ccc',
fill: '#ccc', //..
},
image: {
width: 28,
height: 28,
refX: 20,
refY: 12,
},
label: {
refX: 1,
refY: 48,
textAnchor: 'bottom',
textVerticalAnchor: 'top',
fontSize: 12,
fill: '#fff',
},
},
ports: {
groups: {
top: {
position: 'top',
attrs: {
circle: {
r: 4,
magnet: true,
stroke: '#5F95FF',
strokeWidth: 1,
fill: '#fff',
style: {
visibility: 'hidden',
},
},
},
},
right: {
position: 'right',
attrs: {
circle: {
r: 4,
magnet: true,
stroke: '#5F95FF',
strokeWidth: 1,
fill: '#fff',
style: {
visibility: 'hidden',
},
},
},
},
bottom: {
position: 'bottom',
attrs: {
circle: {
r: 4,
magnet: true,
stroke: '#5F95FF',
strokeWidth: 1,
fill: '#fff',
style: {
visibility: 'hidden',
},
},
},
},
left: {
position: 'left',
attrs: {
circle: {
r: 4,
magnet: true,
stroke: '#5F95FF',
strokeWidth: 1,
fill: '#fff',
style: {
visibility: 'hidden',
},
},
},
},
},
},
},
true,
)
//转换组件
const convertDataList = [
{
label: '添加默认值',
path: "addDefault",
image: getImageUrl("../../assets/tool_image/information_add.svg"),
},
{
label: '基本运算',
path: "basicoPerations",
image:
getImageUrl("../../assets/tool_image/calculator.svg"),
},
{
label: '脚本转换',
path: "conversionScript",
image:
getImageUrl("../../assets/tool_image/script.svg"),
},
{
label: '合并/拆分',
path: "mergeSplit",
image:
getImageUrl("../../assets/tool_image/merge.svg"),
},
{
label: '数字类型',
path: "numberType",
image:
getImageUrl("../../assets/tool_image/script_1.svg"),
},
{
label: '简单过滤',
path: "simpleFiltering",
image:
getImageUrl("../../assets/tool_image/filter-records-fill.svg"),
},
{
label: '时间格式',
path: "timeConversion",
image:
getImageUrl("../../assets/tool_image/Date_time.svg"),
},
]
const convertNodes = convertDataList.map((item) =>
graph.createNode({
shape: 'custom-image',
label: item.label,
data: item.path,
attrs: {
image: {
'xlink:href': item.image,
}
},
ports: {
items: [
{
group: 'right',
},
{
group: 'left',
},
],
}
}),
)
stencil.load(convertNodes, 'group1')
//end
//根据需求 可去除
graph.on('node:dblclick', ({ cell }) => { // cell 基类对象 view 视图对象
// 目标数据logic
router.push({
name: cell.data,
query: {}
})
})
const imageShapes = [
{
label: 'Excel',
path: "Excel",
image:
getImageUrl("../../assets/tool_image/file-excel.svg"),
},
{
label: 'CSV',
path: "CSV",
image:
getImageUrl("../../assets/tool_image/CSV.svg"),
},
{
label: 'JSON',
path: "JSON",
image:
getImageUrl("../../assets/tool_image/json_1.svg"),
},
{
label: 'Kafka',
path: "Kafka",
image:
getImageUrl("../../assets/tool_image/Kafka_1.svg"),
},
{
label: 'OWL文件',
path: "OWL",
image:
getImageUrl("../../assets/tool_image/calculator_1.svg"),
},
{
label: '日志文件',
path: "Log",
image:
getImageUrl("../../assets/tool_image/console2.svg"),
},
{
label: 'mongodb',
path: "mongodb",
image:
getImageUrl("../../assets/tool_image/yunshujukuMongoDB.svg"),
},
{
label: '表输入',
path: "outside",
image:
getImageUrl("../../assets/tool_image/database.svg"),
},
]
const imageNodes = imageShapes.map((item) =>
graph.createNode({
shape: 'custom-image',
label: item.label,
data: item.path,
attrs: {
image: {
'xlink:href': item.image,
},
},
ports: {
items: [
{
group: 'right',
},
],
}
}),
)
stencil.load(imageNodes, 'group2')
//output
const outputDataList = [
{
label: '控制台',
path: "consoleoutput",
image:
getImageUrl("../../assets/tool_image/console.svg"),
},
{
label: 'Kafka',
path: "kafkaoutput",
image:
getImageUrl("../../assets/tool_image/Kafka.svg"),
},
{
label: 'mongodb',
path: "mongodboutput",
image:
getImageUrl("../../assets/tool_image/mongo.svg"),
},
{
label: '表',
path: "tableOut",
image:
getImageUrl("../../assets/tool_image/database.svg"),
}
]
const outputNodes = outputDataList.map((item) =>
graph.createNode({
shape: 'custom-image',
label: item.label,
data: item.path,
attrs: {
image: {
'xlink:href': item.image,
},
},
ports: {
items: [
{
group: 'left',
},
],
}
}),
)
stencil.load(outputNodes, 'group3')
// #endregion
function preWork() {
// 这里协助演示的代码,在实际项目中根据实际情况进行调整
const container = document.getElementById('container')!
const stencilContainer = document.createElement('div')
stencilContainer.id = 'stencil'
const graphContainer = document.createElement('div')
graphContainer.id = 'graph-container'
container.appendChild(stencilContainer)
container.appendChild(graphContainer)
insertCss(`
#container {
display: flex;
border: 1px solid #dfe3e8;
}
#stencil {
width: 200px;
height: 100%;
position: relative;
border-right: 1px solid #dfe3e8;
}
#graph-container {
width: calc(100% - 180px);
height: 100%;
}
.x6-widget-stencil {
background-color: #fff;
}
.x6-widget-stencil-title {
background-color: #fff;
}
.x6-widget-stencil-group-title {
background-color: #fff !important;
}
.x6-widget-transform {
margin: -1px 0 0 -1px;
padding: 0px;
border: 1px solid #239edd;
}
.x6-widget-transform > div {
border: 1px solid #239edd;
}
.x6-widget-transform > div:hover {
background-color: #3dafe4;
}
.x6-widget-transform-active-handle {
background-color: #3dafe4;
}
.x6-widget-transform-resize {
border-radius: 0;
}
.x6-widget-selection-inner {
border: 1px solid #239edd;
}
.x6-widget-selection-box {
opacity: 0;
}
`)
}
})
</script>
<style scoped lang="less">
#container {
width: 100%;
height: 100vh;
overflow: hidden !important;
display: flex;
justify-content: center;
}
</style>


 1614
1614


 被折叠的 条评论
为什么被折叠?


