


关闭提取的直线轮廓中的间隙
dev_close_window ()
dev_update_window ('off')


*步骤:创建合成图像
gen_rectangle1 (Rectangle, 30, 20, 100, 100)

*将区域转换为二进制字节图像。
region_to_bin (Rectangle, BinImage, 130, 100, 120, 130)

*将图像的区域缩小为矩形。
rectangle1_domain (BinImage, ImageReduced, 20, 48, 40, 52)

*均值滤波
mean_image (ImageReduced, SmoothedImage, 15, 15)

*将图像的灰度值绘制到另一个图像中。
paint_gray (SmoothedImage, BinImage, Image)
get_image_size (Image, Width, Height)
dev_open_window_fit_image (Image, 0, 0 , Width, Height, WindowID)
dev_set_draw ('margin')
dev_set_line_width (3)
dev_display (Image)
stop ()

*将图像的区域缩小为矩形。
rectangle1_domain (Image, ImageReduced, 5, 5, 125, 115)

*输出xld亚像素轮廓
edges_sub_pix (ImageReduced, Edges, 'lanser2', 1.1, 22, 30)
dev_display (Image)
dev_display (Edges)
stop ()

*将xld等高线分为线段和圆弧或椭圆弧。
segment_contours_xld (Edges, LineSegments, 'lines', 5, 4, 2)

*计算回归线到xld等高线的参数
regress_contours_xld (LineSegments, RegressContours, 'no', 1)


*联合近似共线轮廓。
union_collinear_contours_xld (RegressContours, UnionContours, 10, 1, 2, 0.1, 'attr_keep')
sort_contours_xld (UnionContours, SortedContours, 'upper_left', 'true', 'column')
dev_display (Image)

*以可定义的交替颜色显示标志性对象
colored_display (SortedContours, ['yellow','white','white','yellow'])
dev_update_window ('on')
dev_close_window ()
dev_update_window ('off')
*步骤:创建合成图像
gen_rectangle1 (Rectangle, 30, 20, 100, 100)
*将区域转换为二进制字节图像。
region_to_bin (Rectangle, BinImage, 130, 100, 120, 130)
*将图像的区域抠出一个矩形
rectangle1_domain (BinImage, ImageReduced, 20, 48, 40, 52)

*均值滤波
mean_image (ImageReduced, SmoothedImage, 15, 15)
就是把SmoothedImage叠加到BinImage上
目的是为了断开这个矩形
---------------------

*将图像的灰度值绘制到另一个图像中。
paint_gray (SmoothedImage, BinImage, Image)
get_image_size (Image, Width, Height)
dev_open_window_fit_image (Image, 0, 0 , Width, Height, WindowID)
dev_set_draw ('margin')
dev_set_line_width (3)
dev_display (Image)
stop ()
*将图像的区域缩小为矩形。
rectangle1_domain (Image, ImageReduced, 5, 5, 125, 115)

*输出xld亚像素轮廓
edges_sub_pix (ImageReduced, Edges, 'lanser2', 1.1, 22, 30)
dev_display (Image)
dev_display (Edges)
stop ()
*将xld等高线分为线段和圆弧或椭圆弧。
segment_contours_xld (Edges, LineSegments, 'lines', 5, 4, 2)

*计算回归线到xld等高线的参数
regress_contours_xld (LineSegments, RegressContours, 'no', 1)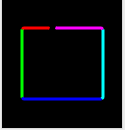
*联合近似共线轮廓。
union_collinear_contours_xld (RegressContours, UnionContours, 10, 1, 2, 0.1, 'attr_keep')
sort_contours_xld (UnionContours, SortedContours, 'upper_left', 'true', 'column')
dev_display (Image)

*以可定义的交替颜色显示标志性对象
colored_display (SortedContours, ['yellow','white','white','yellow'])
dev_update_window ('on')
region_to_bin(Region : BinImage : ForegroundGray, BackgroundGray, Width, Height : )
功能:将区域转换为二进制字节图像。
Region:输入要转换的区域;BinImage:输出二值图像; ForegroundGray:前景灰度值,;BackgroundGray:背景灰度值;Width, Height输出宽高
rectangle1_domain(Image : ImageReduced : Row1, Column1, Row2, Column2 : )
功能:将图像的域缩小为矩形。
paint_gray(ImageSource, ImageDestination : MixedImage : : )
功能: 绘制图像的灰度值到另一个图像。
regress_contours_xld(Contours : RegressContours : Mode, Iterations : )
功能:计算输入xld等高线的以下参数,并将其与生成的等高线一起存储为全局属性:
Mode:异常处理的类型;Iterations :迭代的次数
union_collinear_contours_xld(Contours : UnionContours : MaxDistAbs, MaxDistRel, MaxShift, MaxAngle, Mode : )
功能:联合近似共线轮廓。
MaxDistAbs:沿参考轮廓回归线测量的两个轮廓之间间隙的最大长度;MaxDistRel:两条等高线之间间隙的最大长度,相对于参考等高线的长度,均沿参考等高线的回归线测量;MaxShift:第二条等高线与参考等高线回归线的最大距离;MaxAngle:两条等高线回归线之间的最大角度;Mode:定义轮廓属性处理的模式,即如果轮廓属性被保留或丢弃


 1418
1418


 被折叠的 条评论
为什么被折叠?
被折叠的 条评论
为什么被折叠?
 到【灌水乐园】发言


