


学习目标:
- 机器学习相关库的导入
- 如何读取csv、excel文件
- 处理数据的一些操作
- 一点绘图
- 加载数据和常用的查找
- 字典特征的提取
- 数据的处理(归一化、标准化)
- 数据的降维
- KNN算法
- 模型优化:交叉验证和超参数搜索
学习内容:
- 机器学习相关库的导入
import numpy as np #科学计算基础软件包 import matplotlib as mpl import matplotlib.pyplot as plt #绘图库 import sklearn #机器学习 import pandas as pd #结构化数据分析工具 #读文件的 import csv import xlrd import openpyxl import scipy - 读取csv文件
def csv_txt():   #读取txt文件
    path = r'zlq.txt'
    frame = open(path, encoding='utf-8')
    print(frame.readlines())
    frame.close()
读取的文件需要和程序在同一目录下:

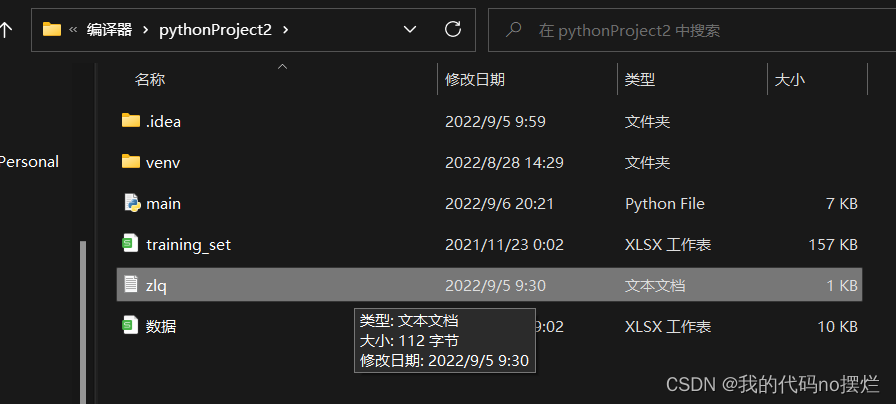
读取成功

python中,对于中文出现乱码,加上 encoding='utf-8'即可
- 读取excel文件和相关的行列操作:
def read_excel():
    path = r'D:\编译器\pythonProject2\数据.xlsx'  # 读取excel数据
    frame = pd.read_excel(path)
    print("读取数据")
    print(type(frame))
    print(frame)

    all_cols = frame.columns  # 获取表头
    print("获取表头")
    print(all_cols)

    col_data = frame[[u'年龄', u'姓名']]  # 获取列数据
    print("获取列数据")
    print(col_data)

    row_data = frame.iloc[1]
    print("获取行数据")
    print(row_data)

    all_data = frame.values  # 获取所有行数据
    print("获取所有行数据")
    print(all_data)

    mul_row_data = frame.iloc[0:2]
    print("切片获取多行数据")
    print(mul_row_data)

    cell_data = frame.iloc[0][1]
    print("获取单元格数据")
    print((cell_data))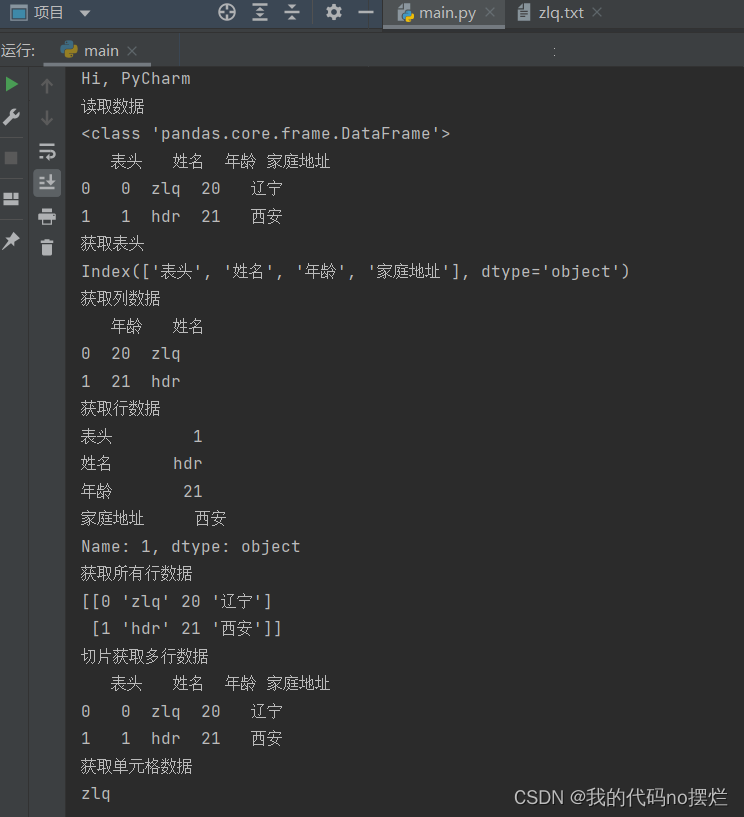
-
绘图
def num():# np用法、画图
    np.array([1, 2, 3])
    a = np.random.random(3)
    b = np.arange(18).reshape((3, 2, 3))
    tall = np.random.normal(170, 4, 1000)  # 高斯分布
    bins = np.arange(156, 190, 2)
    plt.hist(tall, bins)
    plt.show()
def mat():
    x = [1, 2, 3, 4]
    y = [1, 4, 3, 2]
    fig, ax = plt.subplots()
    ax.plot(x, y)
    plt.show()#折线图

    data = [10, 15, 30, 20]
    plt.pie(data)#饼状图
    plt.show()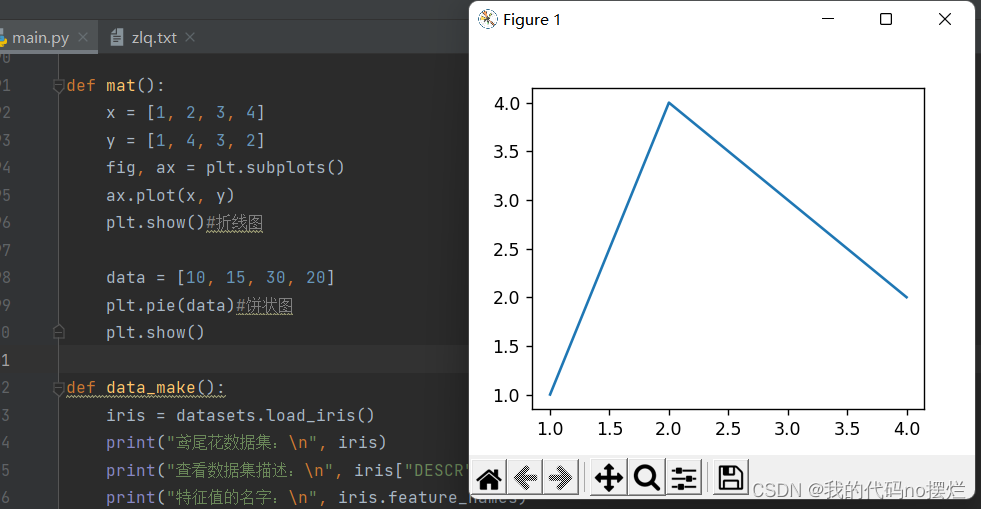

-
加载数据和常用的查找
def data_make():
    iris = datasets.load_iris()
    print("鸢尾花数据集:\n", iris)
    print("查看数据集描述:\n", iris["DESCR"])
    print("特征值的名字:\n", iris.feature_names)
    print("查看特征值:\n", iris.data, iris.data.shape)

    x = iris.data
    y = iris.target
    #    print(('class labels:',np.unique(y)))

    x_train, x_text, y_train, y_yest = train_test_split(x, y, test_size=0.2, random_state=22)
    print("训练集的特征值:\n", x_train, x_train.shape)
数据较长,就不截图展示了,可以在自己的电脑上直接运行
-
字典特征的提取
from sklearn.feature_extraction import DictVectorizer

def dic():#字典特征提取
    data = [{'city': '北京', 'temperature': 100}, {'city': '上海', 'temperature': 60}, {'city': '深圳', 'temperature': 30}]
    transfer = DictVectorizer(sparse=False)
    data_new = transfer.fit_transform(data)
    print("data_new:\n", data_new)
    print("特征名字:\n", transfer.get_feature_names())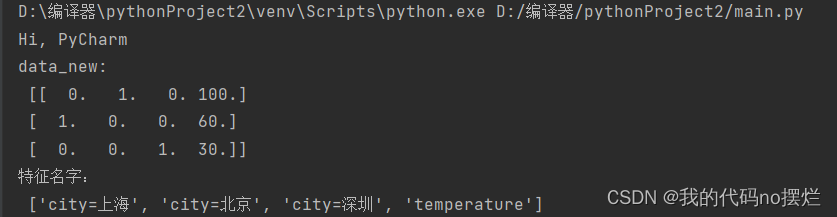
-
数据的处理:归一化和标准化
from sklearn.preprocessing import MinMaxScaler #归一化 from sklearn.preprocessing import StandardScaler #标准化 def guiyi(): #数据归一化处理 data = pd.read_csv("zlq.txt") data = data.iloc[:, :3] print(data) #transfer = MinMaxScaler() 归一化,若数据中有缺失值且为最大值或最小值,对整体影响较大,所以在有缺失值时常用标准化 transfer = StandardScaler()#标准化 data_new = transfer.fit_transform(data) print(data_new) -
数据的降维
from sklearn.feature_selection import VarianceThreshold from scipy.stats import pearsonr from sklearn.decomposition import PCA def jiangwei(): #对数据进行降维,将相关的特征去除 path = r'training_set.xlsx' data = pd.read_excel(path) data = data.iloc[:, 1:-1] print(data, data.shape) # transfer = VarianceThreshold()#此方法通过控制方差为阈值,来判断特征是否要被剔除 # data_new = transfer.fit_transform(data) # print(data_new, data_new.shape) r=pearsonr(data["长度"],data["高度"])#皮尔逊系数 print("相关系数:\n",r) #相关性很高:1.选取其中一个 #2.加权求和 3.主成分分析:高维数据转化为低维数据的过程,在其过程中可能会舍弃原有数据、创造新变量 #应用:回归分析或聚类分析当中 data = np.random.randint(1, 10, size=(3, 4)) print(data) transfer = PCA(n_components=0.5) # 整数表示降到几维,小数表示保留多少信息 data_new = transfer.fit_transform(data) print(data_new) -
KNN算法
def knn(): iris = datasets.load_iris() x = iris.data y = iris.target x_train, x_text, y_train, y_test = train_test_split(x, y, test_size=0.2, random_state=22) #标准化 transfer = StandardScaler() x_train = transfer.fit_transform(x_train) x_text = transfer.transform(x_text) estimator = KNeighborsClassifier(n_neighbors=3) estimator.fit(x_train, y_train) #模型评估 y_predict = estimator.predict(x_text) print("y_predict:\n", y_predict) print("直接比对真实值和预测值:\n", y_test == y_predict) score = estimator.score(x_text, y_test) print("准确率为:\n", score) -
模型优化:交叉验证和超参数搜索
def knn_gscv():
    iris = datasets.load_iris()
    x = iris.data
    y = iris.target
    x_train, x_text, y_train, y_test = train_test_split(x, y, random_state=10)
    # 标准化
    transfer = StandardScaler()
    x_train = transfer.fit_transform(x_train)
    x_text = transfer.transform(x_text)
    estimator = KNeighborsClassifier()

    #加入网格搜索与交叉验证
    param_dict={"n_neighbors": [1, 3, 5, 7, 9, 11]}
    estimator=GridSearchCV(estimator,param_grid=param_dict,cv=10)

    estimator.fit(x_train,y_train)
    # 模型评估
    y_predict = estimator.predict(x_text)
    print("y_predict:\n", y_predict)
    print("直接比对真实值和预测值:\n", y_test == y_predict)

    score = estimator.score(x_text, y_test)
    print("准确率为:\n", score)

    print("最佳参数k:\n", estimator.best_params_)
    print("最佳结果:\n", estimator.best_score_)
    print("最佳估计器:\n", estimator.best_estimator_)
    print("交叉验证结果:\n", estimator.cv_results_)


 5787
5787


 被折叠的 条评论
为什么被折叠?
被折叠的 条评论
为什么被折叠?
 到【灌水乐园】发言


