


用K-Means和DBSCAN算法对西瓜数据集4.0进行聚类分析
数据集
	density	sugercontent
1	0.697	0.46
2	0.774	0.376
3	0.634	0.264
4	0.608	0.318
5	0.556	0.215
6	0.403	0.237
7	0.481	0.149
8	0.666	0.091
9	0.437	0.211
10	0.666	0.091
11	0.243	0.267
12	0.245	0.057
13	0.343	0.099
14	0.639	0.161
15	0.657	0.198
16	0.36	0.37
17	0.593	0.042
18	0.719	0.103
19	0.359	0.188
20	0.339	0.241
21	0.282	0.257
22	0.748	0.232
23	0.714	0.346
24	0.483	0.312
25	0.478	0.437
26	0.525	0.369
27	0.751	0.489
28	0.532	0.472
29	0.473	0.376
30	0.725	0.445
31	0.446	0.459
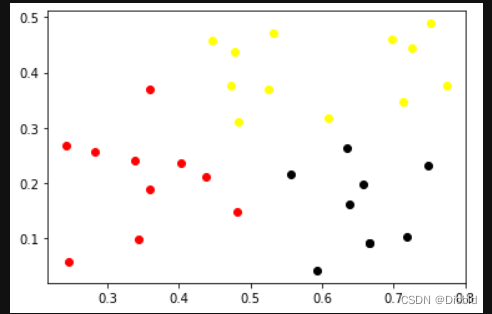
K-Means
import numpy as np
import matplotlib.pyplot as plt
# Though the following import is not directly being used, it is required
# for 3D projection to work
from sklearn.cluster import KMeans
import pandas as pd
xigua = pd.read_csv('xigua.csv')


estimator = KMeans(n_clusters=3,max_iter=500,)
#计算每个样本的聚类中心并预测聚类索引。
a1=xigua.values

res = estimator.fit_predict(a1)
#每个点的标签
lable_pred = estimator.labels_
#每个点的聚类中心
centroids = estimator.cluster_centers_
#样本距其最近的聚类中心的平方距离之和。
inertia = estimator.inertia_

for i in range(len(a1)):
    if int(lable_pred[i]) == 0:
        plt.scatter(a1[i][0], a1[i][1], color='red')
    if int(lable_pred[i]) == 1:
         plt.scatter(a1[i][0], a1[i][1], color='black')
    if int(lable_pred[i]) == 2:
        plt.scatter(a1[i][0], a1[i][1], color='yellow')
plt.show()
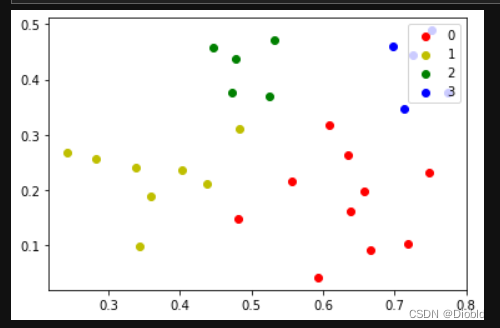
DBSCAN
import math
import numpy as np

import pandas as pd
import pylab as pl
xigua = pd.read_csv('xigua.csv')
dataset=[(i[0],i[1]) for i in xigua.values]
#计算欧几里得距离,a,b分别为两个元组
def dist(a, b):
    return math.sqrt(math.pow(a[0]-b[0], 2)+math.pow(a[1]-b[1], 2))
#算法模型
def DBSCAN(D, e, Minpts):

    #初始化核心对象集合T,聚类个数k,聚类集合C, 未访问集合P,
    T = set()
    k = 0
    C = []
    P = set(D)
    for d in D:
        if len([ i for i in D if dist(d, i) <= e]) >= Minpts:
            T.add(d)
    #开始聚类
    #所有的核心的 有多个类
    while len(T):
        P_old = P
        #选取一个核心点
        o = list(T)[np.random.randint(0, len(T))]
        #把核心点从未选取中取出
        P = P - set(o)
        Q = []
        Q.append(o)
        while len(Q):
            q = Q[0]
            #核心点周围的点
            Nq = [i for i in D if dist(q, i) <= e]
            #核心点和周围的点都记录下来
            if len(Nq) >= Minpts:
                S = P & set(Nq)
                Q += (list(S))
                P = P - S
            Q.remove(q)
        k += 1
        Ck = list(P_old - P)
        T = T - set(Ck)
        C.append(Ck)
    return C
#画图
def draw(C):

    colValue = ['r', 'y', 'g', 'b', 'c', 'k', 'm']
    for i in range(len(C)):
        coo_X = []  #x坐标列表
        coo_Y = []  #y坐标列表
        for j in range(len(C[i])):
            coo_X.append(C[i][j][0])
            coo_Y.append(C[i][j][1])
        pl.scatter(coo_X, coo_Y, marker='o', color=colValue[i%len(colValue)], label=i)
    pl.legend(loc='upper right')
    pl.show()
C = DBSCAN(dataset, 0.11, 5)
draw(C)


 5万+
5万+


 被折叠的 条评论
为什么被折叠?
被折叠的 条评论
为什么被折叠?
 到【灌水乐园】发言


