


气象数据白化方法
第一章 常见术语
1.1 shp文件
1.1.1 简介
ESRI Shapefile(简称 Shapefile 或 .shp 文件)是一种常见的空间矢量数据储格式,用于存储地理空间数据。Shapefile 文件通常由多个文件组成,包括 .shp、.shx、.dbf 等格式,它们一起描述了矢量空间数据的几何形状、属性信息和空间索引。以下是 Shapefile 文件的主要组成部分:
| 文件名称 | 文件描述 |
|---|---|
| shp | 文件存储矢量几何形状信息,如点、线、多边形的坐标和形状数据。 |
| shx | 文件包含 Shapefile 的空间索引,用于加快在 .shp 文件中的记录检索和访问。 |
| dbf | 文件是一个 dBASE 格式的表格文件,存储了与空间几何形状相关联的属性数据。每个几何对象都可以有与之相关联的属性信息。 |
注意:shp文件和上述文件放在一起才能读取数据。
1.1.2 下载shp文件
步骤 1:进入阿里云数据可视化平台,网址如下:
https://datav.aliyun.com/portal/school/atlas/area_selector
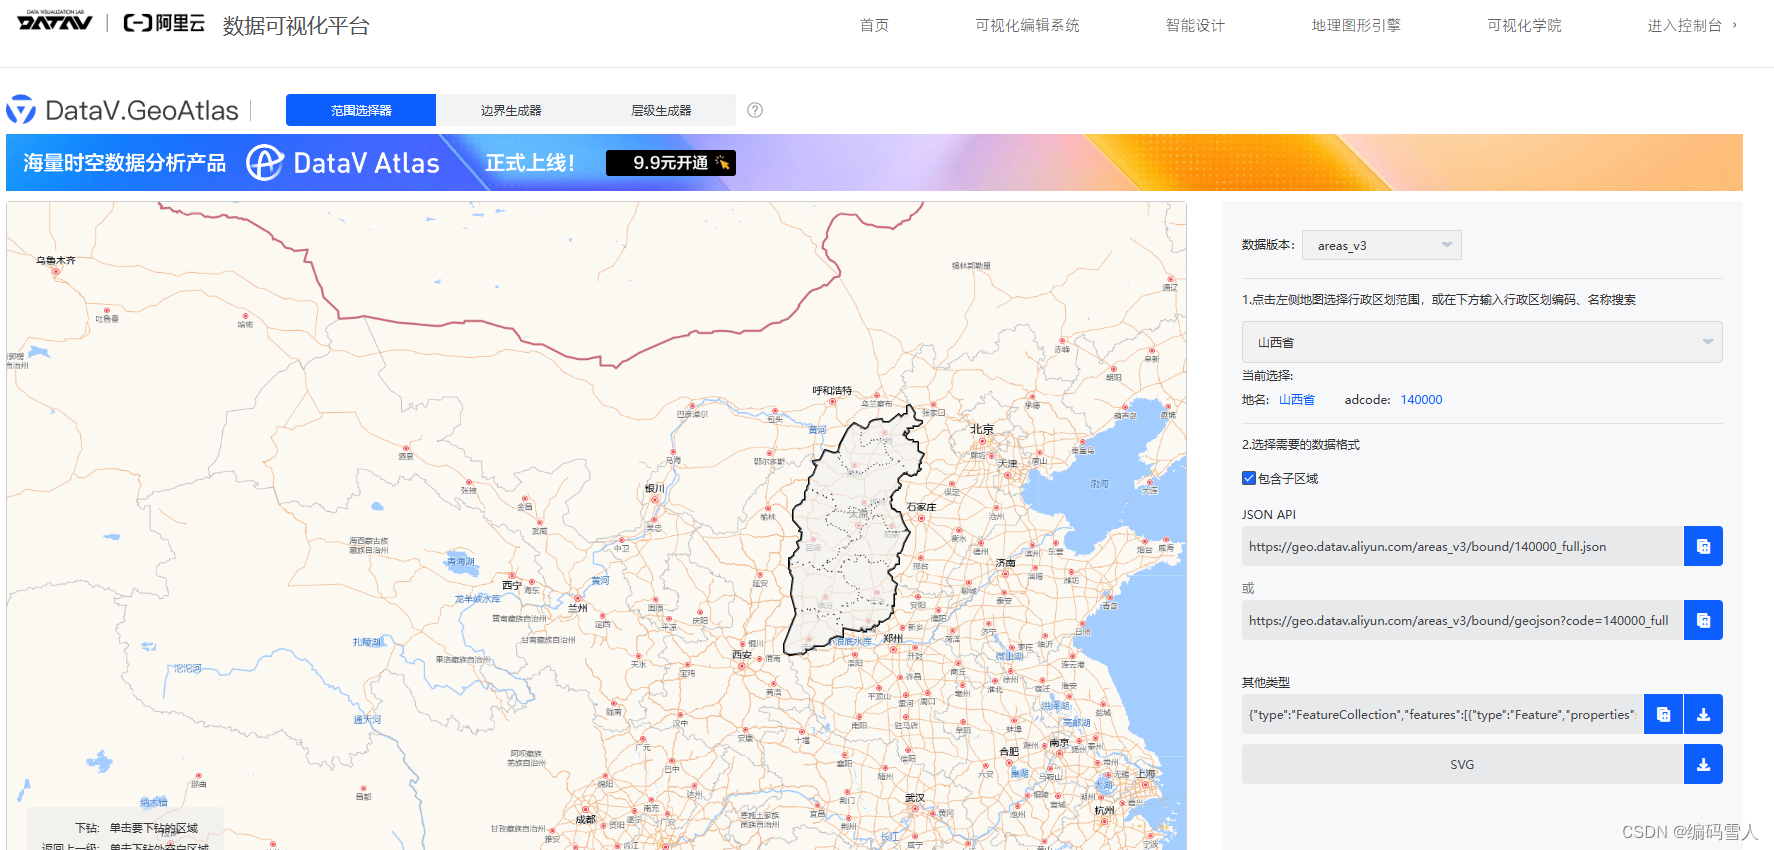
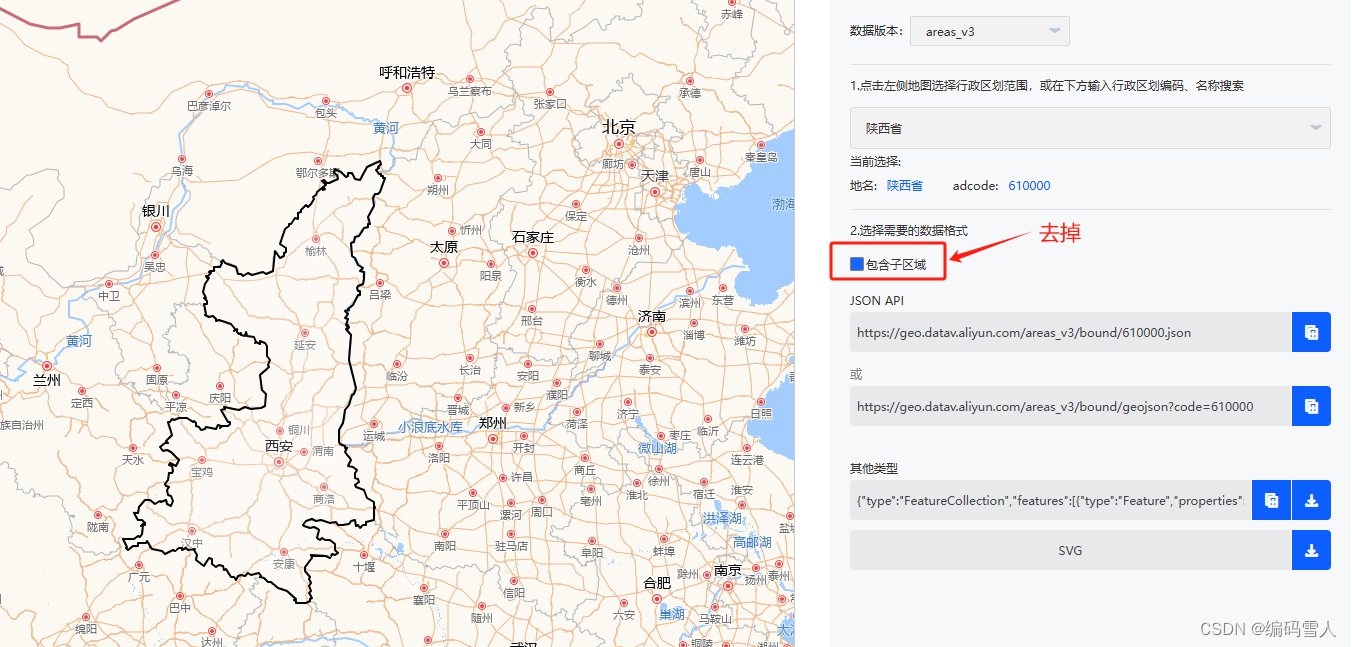
步骤 2:选择目标区域,并去掉包含子区域选项,如下图所示:
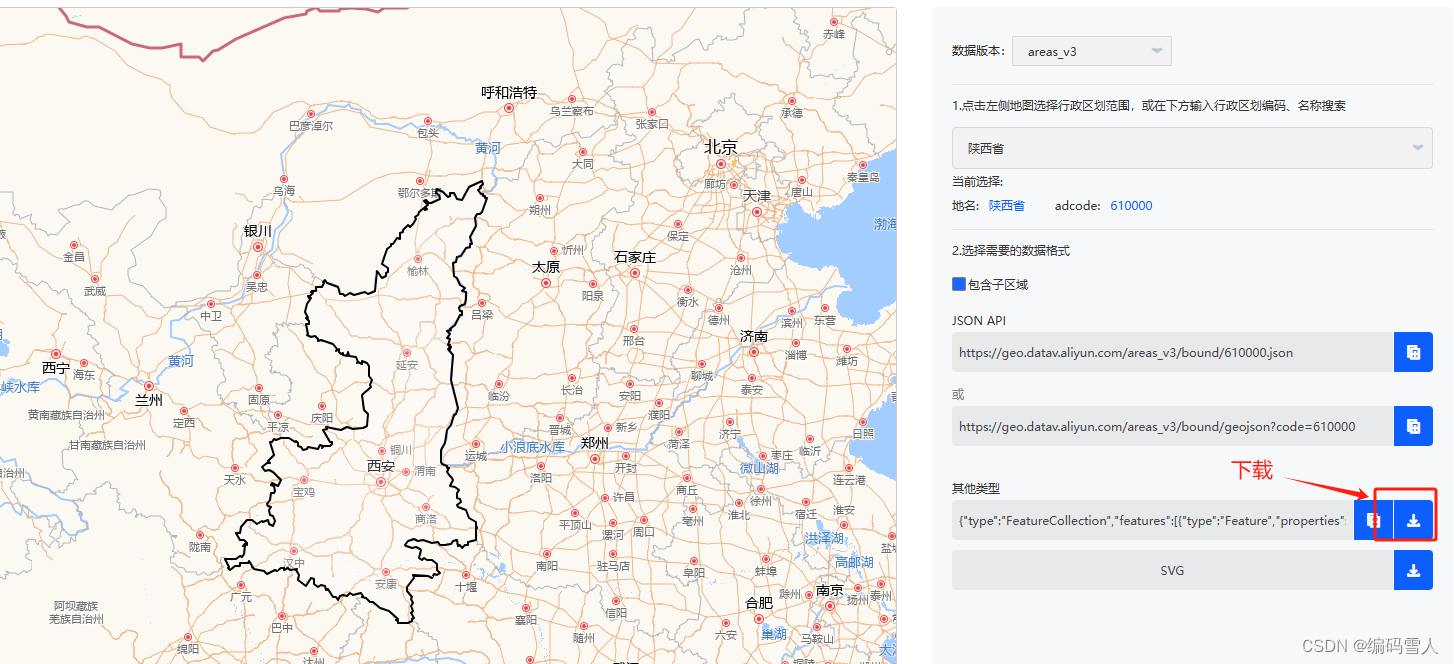
步骤 3:下载json文件,如下图所示:
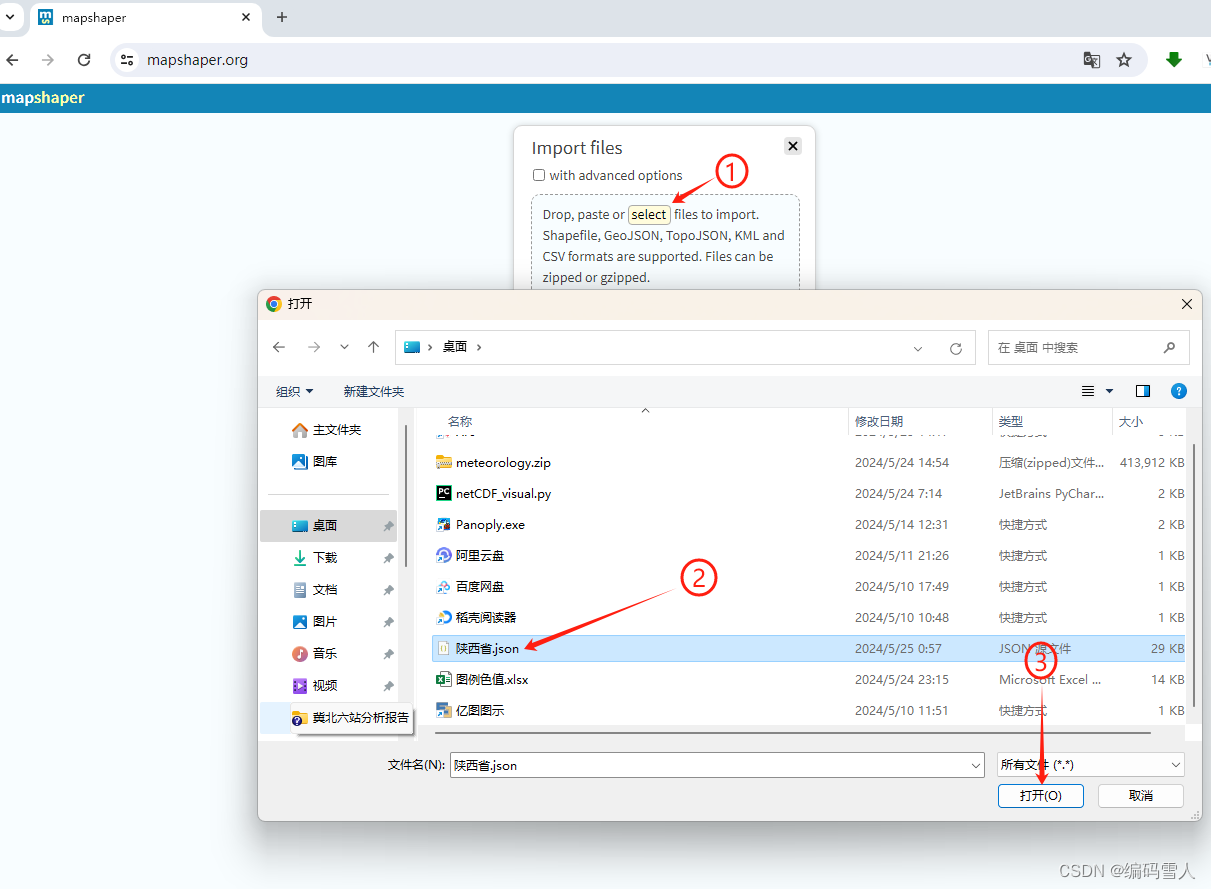
步骤 4:打开开源在线转换工具,网址如下:
https://mapshaper.org/
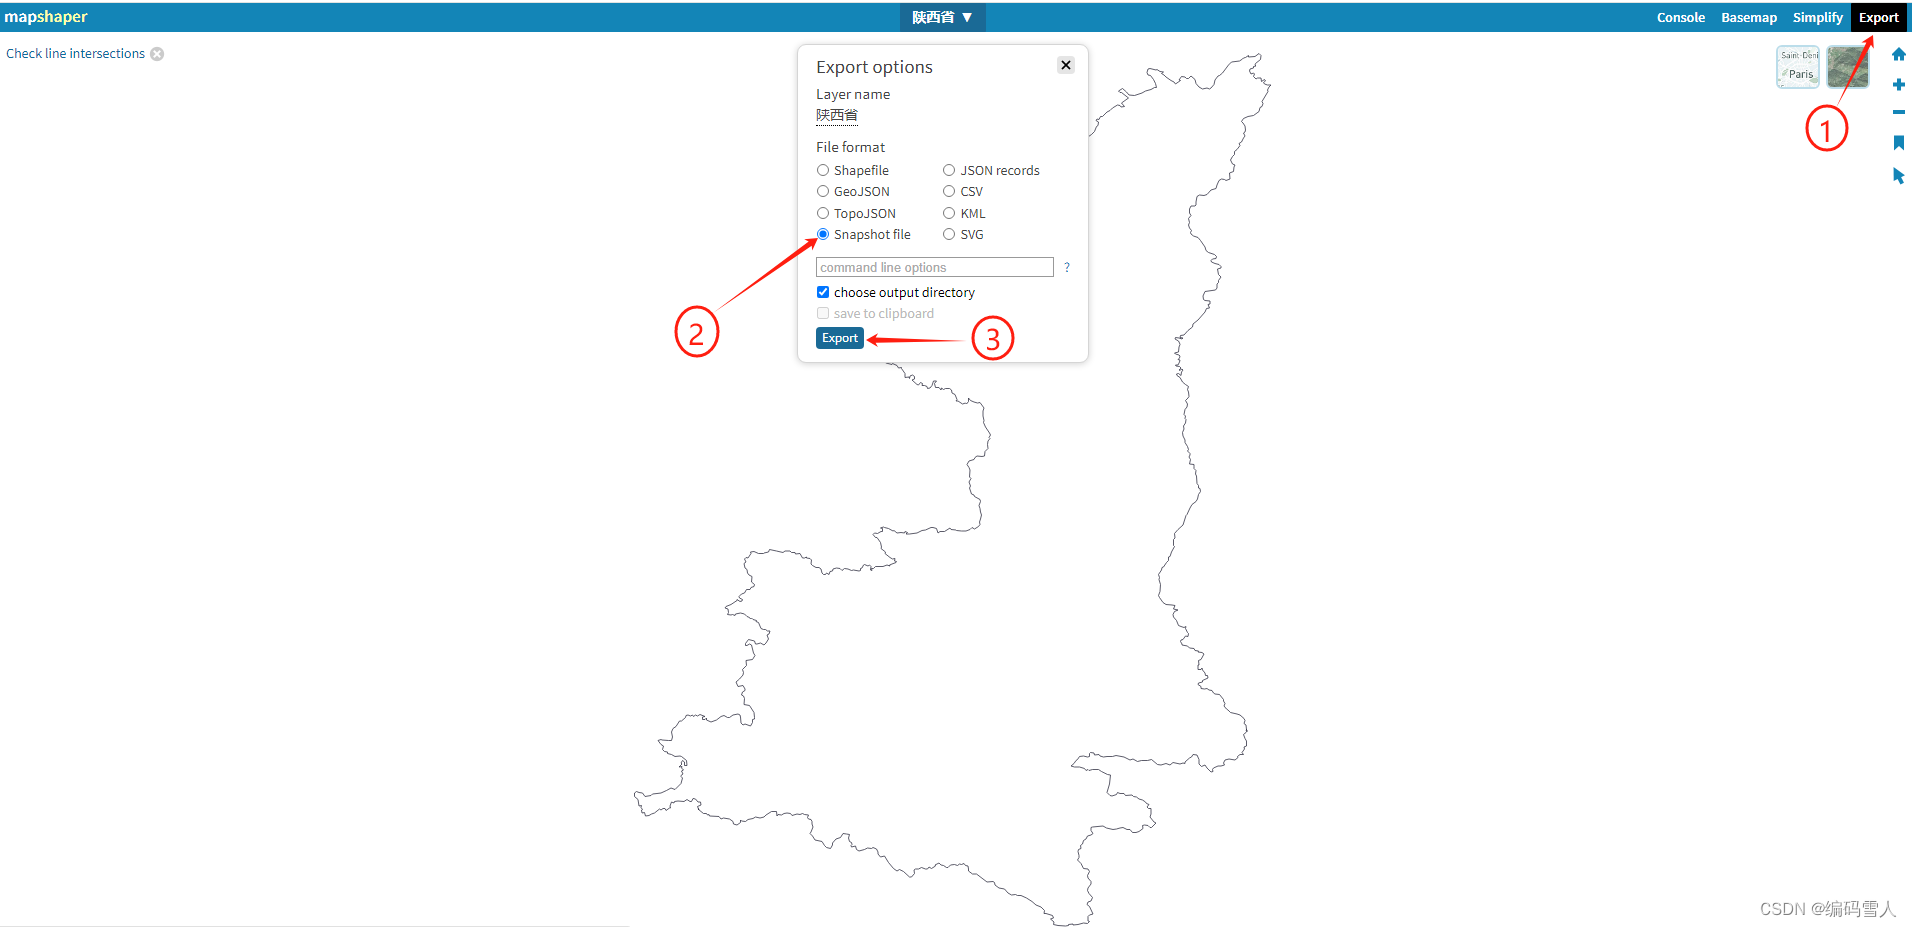
步骤 5:上传文件,具体如下图所示:
步骤 6:选择shp格式,保存文件
1.2 nc文件
1.2.1 简介
网络通用数据格式(Network Common Data Format,NetCDF)是一种存储科学数据的文件格式。它支持多维数组和记录,广泛应用于气象、气候、海洋和其他科学领域的数据存储。一个NetCDF文件可以包含多个变量,每个变量可以有多个维度。
注意:在python中,一般使用xarray读取nc文件,用netCDF4写入nc文件。
第二章 Python实践
2.1 气象云图白化方法
import os
import numpy as np
import pandas as pd
import xarray as xr

from matplotlib import pyplot as plt
from matplotlib.path import Path
import matplotlib.transforms as mt

import geopandas as gpd
import cartopy.crs as ccrs
from cartopy.mpl.patch import geos_to_path


class PyAtmosphere:
    def __init__(self):
        self.tar_region = None  # 目标区域
        self.longitude = None  # 经度
        self.latitude = None  # 纬度

        self.feature_data = None  # 特征数据
        self.date_time = None  # 时间
        self.variable_name = ['TEM', 'RHU', 'PRE', "WS"]  # 变量名称

        self.pair_path_dir = os.path.dirname(os.path.dirname(__file__))  # 父目录

    @staticmethod
    def create_dir(_path, exist=True):
        """创建路径"""
        if not os.path.exists(_path):
            os.makedirs(name=_path, exist_ok=exist)
        pass

    def read_nc_file(self, nc_file_path):
        """ 读取nc文件数据

        Parameters
        ----------
        nc_file_path: str
            nc文件路径
        """
        if 'nc' in nc_file_path:
            data = xr.open_dataset(nc_file_path)  # xarray读取nc文件
            self.longitude, self.latitude = np.array(data.lon), np.array(data.lat)  # 经度、纬度
            self.feature_data = data[self.variable_name]  # 特征数据
            self.date_time = data['Time'].to_dataframe().astype(str).squeeze().tolist()
            del data
        else:
            raise print("Read File Format Error!")
        pass

    def read_shp_file(self, region_name="jiBei"):
        """ 读取shp文件

        Parameters
        ----------
        region_name: str
            目标区域名称
        """
        region_path_dir = os.path.join(self.pair_path_dir, "config", region_name)  # 配置文件目录

        # 获取多个shp文件列表
        file_list = os.listdir(region_path_dir)
        shp_file_list = [file_name for file_name in file_list if "shp" in file_name]

        try:
            if len(shp_file_list) > 1:
                shp_dataset = [
                    gpd.read_file(os.path.join(region_path_dir, shp_file)) for shp_file in shp_file_list
                ]  # 读取shp文件

                # 所有几何体合并成一个的几何对象
                self.tar_region = gpd.GeoDataFrame(pd.concat(shp_dataset, ignore_index=True)).geometry.unary_union
            else:
                file_path = os.path.join(region_path_dir, shp_file_list[0])  # 配置文件路径
                self.tar_region = gpd.read_file(file_path).geometry  # 读取地图轮廓文件

            del region_path_dir, file_list, shp_file_list, shp_dataset  # 清理变量

        except Exception as RegionFileError:
            print("Not Open The File:", RegionFileError)

    def draw_region_contour(self, nc_file_path):
        """ matplotlib白化方法目标区域

        Parameters
        ----------
        nc_file_path: str
            nc文件路径
        """
        # 加载气象数据和地理数据
        self.read_nc_file(nc_file_path)
        self.read_shp_file()

        # 创建结果路径
        res_name = os.path.basename(nc_file_path).split('.')[0]  # 获取文件名
        res_path = os.path.join(self.pair_path_dir, 'results', res_name)  # 拼接路径
        self.create_dir(res_path)  # 检查路径是否存在, 递归创建目录

        # 设置绘图区域
        min_lon, max_lon = np.min(self.longitude), np.max(self.longitude)  # 最小经度和最大经度
        min_lat, max_lat = np.min(self.latitude), np.max(self.latitude)  # 最小纬度和最大纬度

        # 创建绘图对象
        pcj = ccrs.PlateCarree(globe=ccrs.Globe(ellipse='WGS84'))  # 选取映射方式
        fig = plt.figure(figsize=(12, 12), dpi=200)  # 创建图层
        ax = fig.add_subplot(projection=pcj)  # 创建坐标系
        ax.set_extent((min_lon, max_lon, min_lat, max_lat))  # 缩小经度纬度范围

        # 清除当前坐标轴的所有图形元素
        ax.axis('off')  # 去掉坐标轴
        ax.spines[["top", "right", "bottom", "left"]].set_visible(False)
        ax.set_position([0, 0, 1, 1])

        # 绘制等高线云图
        for fn in self.variable_name:
            # 创建特征目录
            temp = os.path.join(res_path, fn)
            self.create_dir(temp, exist=False)

            for idx, time in enumerate(self.date_time):
                feature = self.feature_data[fn][idx]
                path_region = Path.make_compound_path(*geos_to_path([self.tar_region]))
                transform_path = mt.TransformedPath(path_region, ax.transData)  # 将path转化为带transform的path
                ax.contourf(self.longitude, self.latitude, feature, cmap="Spectral_r",
                            levels=np.linspace(-5, 30, 100),
                            transform=pcj, clip_path=transform_path)  # 画云图并按路径裁剪

                # 保存位置
                image_name = f"{time.replace(' ', '_').replace(':', '-')}.png"
                image_path = os.path.join(os.path.abspath(temp), image_name)

                plt.savefig(image_path, transparent=True, bbox_inches='tight')

                # 清除当前坐标轴的所有图形元素
                ax.cla()
        return res_path


if __name__ == "__main__":
    pa = PyAtmosphere()
    path = r"../test_data/yb_124_utc8_202404101900.nc"
    pa.draw_region_contour(path)
2.2 气象风箭图白化方法
import os
import xarray as xr
import numpy as np

import geopandas as gpd

from metpy.units import units
from metpy.calc import wind_components

import cartopy.crs as ccrs
import cartopy.mpl.patch as cmp

from matplotlib import pyplot as plt
from matplotlib.path import Path
from matplotlib.patches import PathPatch


class WindField:
    def __init__(self):
        self.longitude = None  # 经度
        self.latitude = None  # 纬度

        self.pair_path = None

    def read_shp_file(self, region_name="anhui"):
        """ 读取shp文件

        Parameters
        ----------
        region_name: str
            目标区域名称
        """
        self.pair_path_dir = os.path.dirname(os.path.dirname(__file__))
        region_path_dir = os.path.join(self.pair_path_dir, "config", region_name)  # 配置文件目录

        # 获取shp文件列表
        file_list = os.listdir(region_path_dir)
        shp_file_list = [file_name for file_name in file_list if "shp" in file_name]
        file_path = os.path.join(region_path_dir, shp_file_list[0])  # 配置文件路径
        tar_region = gpd.read_file(file_path)  # 读取地图轮廓文件
        return tar_region

    def read_nc_file(self, nc_path):
        data = xr.open_dataset(nc_path)  # xarray读取nc文件

        self.longitude = np.array(data.lon)
        self.latitude = np.array(data.lat)

        if self.longitude.ndim < 2:
            self.longitude, self.latitude = np.meshgrid(self.longitude, self.latitude)

        wind_direction = data["WD"].values  # 风向
        wind_speed = data["WS"].values  # 风速,假设风速变量名是 WS,请根据实际情况修改
        return wind_speed, wind_direction

    @staticmethod
    def generate_vortex_wind_field(wind_speed, wind_direction, ws_unit: str = 'm/s', wd_unit: str = 'degree'):
        u, v = wind_components(wind_speed * units(ws_unit), wind_direction * units(wd_unit))  # 计算U和V分量
        return u, v

    def draw_wind_field(self, nc_path, step=3, scale=200, cmap='Blues_r', pivot='tip', width=0.002, dpi=200):
        tar_region = self.read_shp_file()  # 目标区域
        paths = cmp.geos_to_path(list(tar_region["geometry"]))
        clip_path = Path.make_compound_path(*paths)

        wind_speed, wind_direction = self.read_nc_file(nc_path)  # 风速和风向
        u_speed, v_speed = self.generate_vortex_wind_field(wind_speed, wind_direction)  # 分解
        magnitude = np.sqrt(u_speed ** 2 + v_speed ** 2)  # 计算风速大小

        # shp最大经度和纬度
        tar_extent = tar_region.bounds.values
        min_lon, max_lon = tar_extent[0, 0], tar_extent[0, 2]
        min_lat, max_lat = tar_extent[0, 1], tar_extent[0, 3]

        # 创建绘图对象
        pcj = ccrs.PlateCarree()  # 选取映射方式
        fig = plt.figure(figsize=(max_lon - min_lon, max_lat - min_lat), dpi=dpi)  # 创建图层
        ax = fig.add_axes((0, 0, 1, 1), projection=pcj)

        ax.set_extent((min_lon, max_lon, min_lat, max_lat), crs=pcj)  # 缩小经度纬度范围
        aq = ax.quiver(
            self.longitude[::step, ::step],
            self.latitude[::step, ::step],
            u_speed[::step, ::step],
            v_speed[::step, ::step],
            magnitude[::step, ::step],
            scale=scale,
            cmap=cmap,
            pivot=pivot,
            width=width,
            transform=pcj
        )
        aq.set_clip_path(clip_path, transform=ax.transData)

        # 添加裁剪路径和边界线
        patch = PathPatch(clip_path, transform=ax.transData, linewidth=1, edgecolor='k', facecolor='none')
        ax.add_patch(patch)
        aq.set_clip_path(patch)
        ax.axis('off')  # 去掉坐标轴
        file_name = os.path.basename(nc_path).split(".")[0]
        picture_path = os.path.join(self.pair_path_dir, "results", file_name + ".png")
        plt.savefig(picture_path, transparent=True, bbox_inches=None)

        extend = {
            "min_lon": tar_extent[0, 0],
            "max_lon": tar_extent[0, 2],
            "min_lat": tar_extent[0, 1],
            "max_lat": tar_extent[0, 3]
        }
        return picture_path, extend

def test():
    nc_path = r"../test_data/multisource_20240704130000.nc"

    wf = WindField()
    wf.draw_wind_field(nc_path)


if __name__ == "__main__":
    test()


 1235
1235

 被折叠的 条评论
为什么被折叠?
被折叠的 条评论
为什么被折叠?
 到【灌水乐园】发言


