import numpy as np
import cartopy.crs as ccrs
import cartopy.feature as cf
import matplotlib.pyplot as plt
import cartopy.io.shapereader as shpreader
from cartopy.mpl.ticker import LatitudeFormatter,LongitudeFormatter
from matplotlib.path import Path
from cartopy.mpl.patch import geos_to_path
plt.rcParams['font.sans-serif']=['KaiTi']
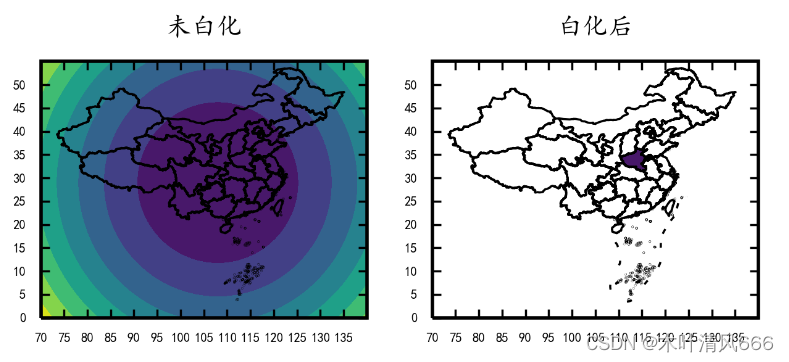
shp_path=r'.\省.shp'
shp_data=shpreader.Reader(shp_path)
fig=plt.figure(figsize=(3,2),dpi=500)
ax1=plt.subplot(121,projection=ccrs.PlateCarree())
ax2=plt.subplot(122,projection=ccrs.PlateCarree())for i,ax inenumerate([ax1,ax2]):
ax.add_geometries(shp_data.geometries(),crs=ccrs.PlateCarree(),edgecolor='k',facecolor='none',lw=0.5)
ax.set_extent([70,140,0,55],crs=ccrs.PlateCarree())
ax.set_xticks(np.arange(70,140,5))
ax.set_yticks(np.arange(0,55,5))# ax.xaxis.set_major_formatter(LongitudeFormatter())# ax.yaxis.set_major_formatter(LatitudeFormatter())
ax.tick_params(direction='in',labelsize=3,top=True,right=True,length=2,width=0.5)if i==0:
ax.set_title('未白化',fontsize=6)else:
ax.set_title('白化后',fontsize=6)########定义绘图数据######################
x=np.arange(70,140,0.02)
y=np.arange(0,55,0.02)
X,Y=np.meshgrid(x,y)
Z=(X-108)**2+(Y-29)**2#######循环画图#########################for i,ax inenumerate([ax1,ax2]):if i==0:
ax.contourf(X,Y,Z)else:
ac=ax.contourf(X,Y,Z)#######获取path#######################
records=shp_data.records()for record in records:if record.attributes["省"]in["河南省"]:
path=Path.make_compound_path(*geos_to_path([record.geometry]))#######白化###########################for collection in ac.collections:
collection.set_clip_path(path, transform=ax2.transData)
file_nineline =".\九段线.shp"
reader_nineline = shpreader.Reader(file_nineline)
ax.add_geometries(reader_nineline.geometries(), crs=ccrs.PlateCarree(), lw=0.5, fc='none')
plt.show()
2、regionmask白化 regionmask-0.9.0
import regionmask
import numpy as np
import geopandas as gpd
file="./china2.shp"
countries = gpd.read_file(file)
lon =np.linspace(70,140,7000)
lat =np.linspace(15,60,4500)
mask= regionmask.mask_geopandas(countries, lon, lat).to_numpy()
mask[~np.isnan(mask)]=1
import regionmask
import geopandas as gpd
import numpy as np
import matplotlib.pyplot as plt
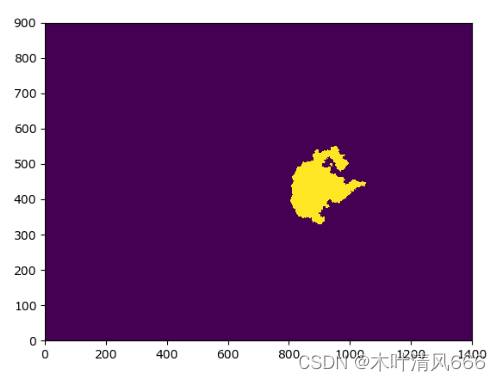
PATH_TO_SHAPEFILE =".\省.shp"
provinces = gpd.read_file(PATH_TO_SHAPEFILE,encoding='gbk')
provinces = provinces.loc[provinces["省"].str.contains("^(山西|河南|山东|河北)")]print(provinces)
x1=np.linspace(70,140,1400)
y1=np.linspace(15,60,900)
mask = regionmask.mask_geopandas(provinces, x1, y1).to_numpy()
mask[~np.isnan(mask)]=1
mask[np.isnan(mask)]=0
plt.pcolormesh(mask)
plt.show()
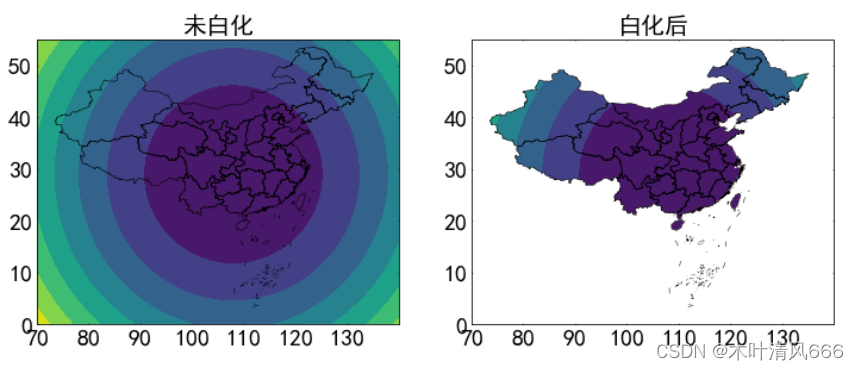
3、maskout实现白化
maskout
#coding=utf-8'''
##############################################################################
# This module enable you to maskout the unneccessary data outside #
# the interest region on a matplotlib-plotted output. #
# You can use this script for free #
##############################################################################
# INPUT: #
# 'fig' : the map #
# 'ax' : the Axes instance #
# 'shpfile' : the border file #
# outside the region the data is to be maskout #
# 'clabel': clabel instance (optional) #
# 'vcplot': vector map (optional) #
# OUTPUT: #
# 'clip' :the masked-out map. #
##############################################################################
'''import shapefile
import cartopy.crs as ccrs
from matplotlib.path import Path
from matplotlib.patches import PathPatch
from shapely.geometry import Point as ShapelyPoint
from shapely.geometry import Polygon as ShapelyPolygon
from collections import Iterable
defshp2clip(fig,ax,region_shpfile, proj=None,clabel=None,vcplot=None):
sf = shapefile.Reader(region_shpfile)for shape_rec in sf.shapeRecords():
vertices =[]
codes =[]
pts = shape_rec.shape.points
prt =list(shape_rec.shape.parts)+[len(pts)]for i inrange(len(prt)-1):for j inrange(prt[i], prt[i+1]):if proj:
vertices.append(proj.transform_point(pts[j][0], pts[j][1], ccrs.Geodetic()))else:
vertices.append((pts[j][0], pts[j][1]))
codes +=[Path.MOVETO]
codes +=[Path.LINETO]*(prt[i+1]- prt[i]-2)
codes +=[Path.CLOSEPOLY]
clip = Path(vertices, codes)
clip = PathPatch(clip, transform=ax.transData)if vcplot:ifisinstance(fig,Iterable):for ivec in fig:
ivec.set_clip_path(clip)else:
fig.set_clip_path(clip)else:for contour in fig.collections:
contour.set_clip_path(clip)if clabel:
clip_map_shapely = ShapelyPolygon(vertices)for text_object in clabel:ifnot clip_map_shapely.contains(ShapelyPoint(text_object.get_position())):
text_object.set_visible(False)return clip
使用示例
import numpy as np
import cartopy.crs as ccrs
import cartopy.feature as cf
import matplotlib.pyplot as plt
import cartopy.io.shapereader as shpreader
from cartopy.mpl.ticker import LatitudeFormatter,LongitudeFormatter
from matplotlib.path import Path
from cartopy.mpl.patch import geos_to_path
# plt.rcParams['font.sans-serif']=['KaiTi']
shp_path=r'D:\My_Document\Code\Practice\data\China\省.shp'
shp_path1 =r'D:\My_Document\Code\Practice\data\China\九段线.shp'
shp_data=shpreader.Reader(shp_path)
shp_data1=shpreader.Reader(shp_path1)
fig=plt.figure(figsize=(12,6))
ax1=plt.subplot(121,projection=ccrs.PlateCarree())
ax2=plt.subplot(122,projection=ccrs.PlateCarree())for i,ax inenumerate([ax1,ax2]):
ax.add_geometries(shp_data.geometries(),crs=ccrs.PlateCarree(),edgecolor='k',facecolor='none',lw=0.5)
ax.add_geometries(shp_data1.geometries(),crs=ccrs.PlateCarree(),edgecolor='k',facecolor='none',lw=0.5)
ax.set_extent([70,140,0,55],crs=ccrs.PlateCarree())
ax.set_xticks(np.arange(70,140,10))
ax.set_yticks(np.arange(0,55,10))
ax.tick_params(direction='in',labelsize=20,top=True,right=True,length=1,width=0.5)if i==0:
ax.set_title('未白化',fontsize=20)else:
ax.set_title('白化后',fontsize=20)########定义绘图数据######################
x=np.arange(70,140,0.02)
y=np.arange(0,55,0.02)
X,Y=np.meshgrid(x,y)
Z=(X-108)**2+(Y-29)**2#######循环画图#########################for i,ax inenumerate([ax1,ax2]):if i==0:map= ax.contourf(X,Y,Z)else:map=ax.contourf(X,Y,Z)
clip=shp2clip(map,ax,r'E:\data_display\hls-cartopy-china(nanhai)\china0.shp', ccrs.PlateCarree())
plt.show()


 1768
1768

 被折叠的 条评论
为什么被折叠?
被折叠的 条评论
为什么被折叠?
 到【灌水乐园】发言


