


安装完WinDbug之后,在WinDbug路径下会有一个UMDH.exe的文件,通过这个文件可以通过“栈回溯数据库”的方式定位应用程序内存泄露的地方。
The User-Mode Dump Heap (UMDH) tool, Umdh.exe, analyzes the Microsoft Windows heap memory allocations for a given process. UMDH has the following modes.
- Analyze a running process ("Mode 1"). UMDH captures and analyzes the heap memory allocations for a process. For each allocation, UMDH displays the size of the allocation, the size of the overhead, the pointer to the allocation and the allocation stack. If a process has more than one active memory heap, UMDH captures all heaps.
- Analyze UMDH log files ("Mode 2"). UMDH analyzes the logs to help detect memory leaks. When comparing two UMDH output logs from subsequent runs of a UMDF driver, UMDH displays the calls in which the allocation size increased the most between the runs.
umdh只能针对分配了内存,但是没有进行释放的程序起到检测作用。除了umdh.exe 通过!heap 也可找到增长的那个堆,并找到对应的栈信息,从而定位到函数源码。
A:UMDH方式
创建应用程序WinDbugTest.exe
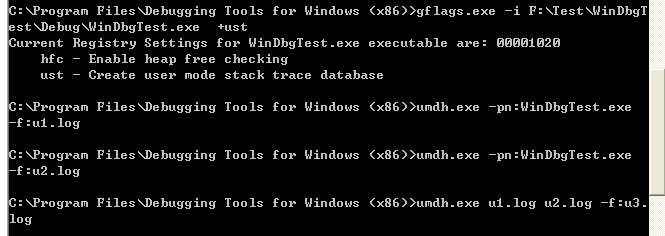
1.cmd窗口转到gflags.exe目录(WinDbug路径),运行:gflags.exe -i F:\Test|WinDbugTest\\Debug\WinDbugTest.exe +ust 来启用目标程序的ust功能
2.打开应用程序WinDbugTest.exe不执行任何操作;
3.cmd窗口转到umdh.exe目录(WinDbug路径),运行:umdh.exe -pn:WinDbugTest.exe -f:u1.log 记录当前栈引用数据库相关信息
4.对程序进行相关操作,执行一些创建内存以及释放内存的操作。
5.cmd窗口转到umdh.exe目录(WinDbug路径),运行:umdh.exe -pn:WinDbugTest.exe -f:u2.log 记录当前栈引用数据库相关信息
6.cmd窗口转到umdh.exe目录(WinDbug路径),运行:umdh.exe u1.log u2.log -f:u3.log 将之前获取的栈引用数据库信息进行对比来找到出现异常的地址
B:!Heap方式
1.!heap -s
2.!heap -stat -h XXXXX
3.!heap -flt s XX
4.!heap -p -a VVV


 4192
4192


 被折叠的 条评论
为什么被折叠?
被折叠的 条评论
为什么被折叠?
 到【灌水乐园】发言


