


OpenCV-Python小应用(五):基于模板匹配的图像拼接
前言
- 本文是个人使用OpenCV-Python的应用案例,由于水平有限,难免出现错漏,敬请批评改正。
- 更多精彩内容,可点击进入
OpenCV-Python小应用专栏或我的个人主页查看
前提条件
- 熟悉Python
实验环境
- Python 3.6.13 (面向对象的高级语言)
- OpenCV 3.4.10(python第三方库)
pip3 install opencv-python==3.4.10.37
基于模板匹配的图像拼接
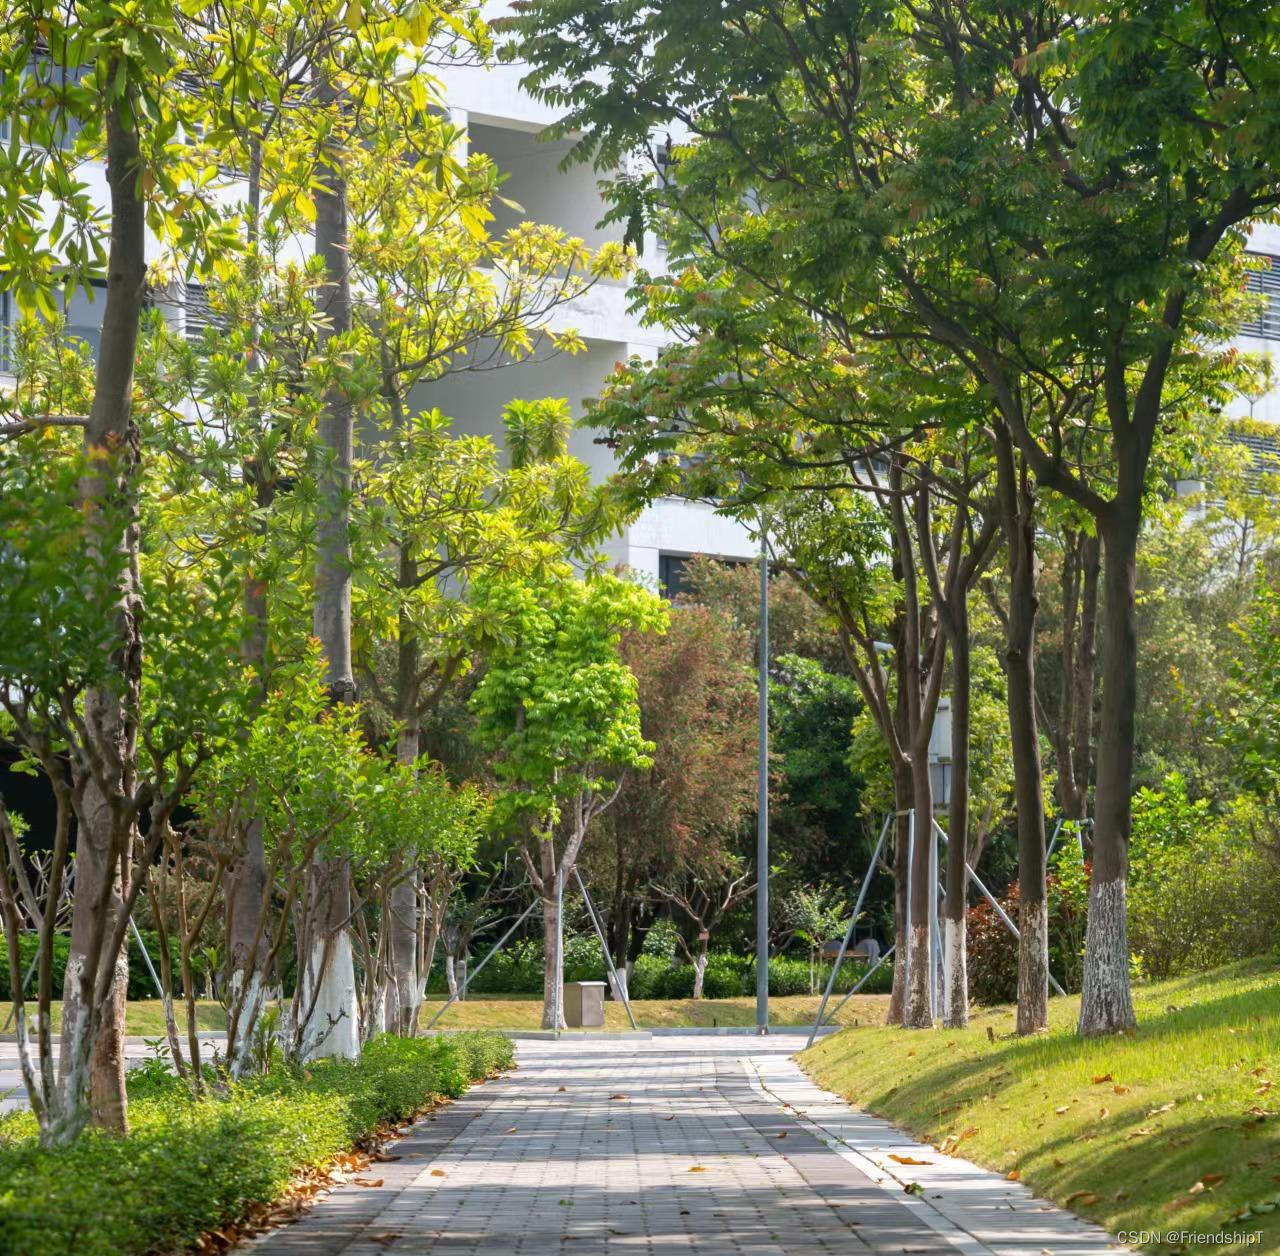
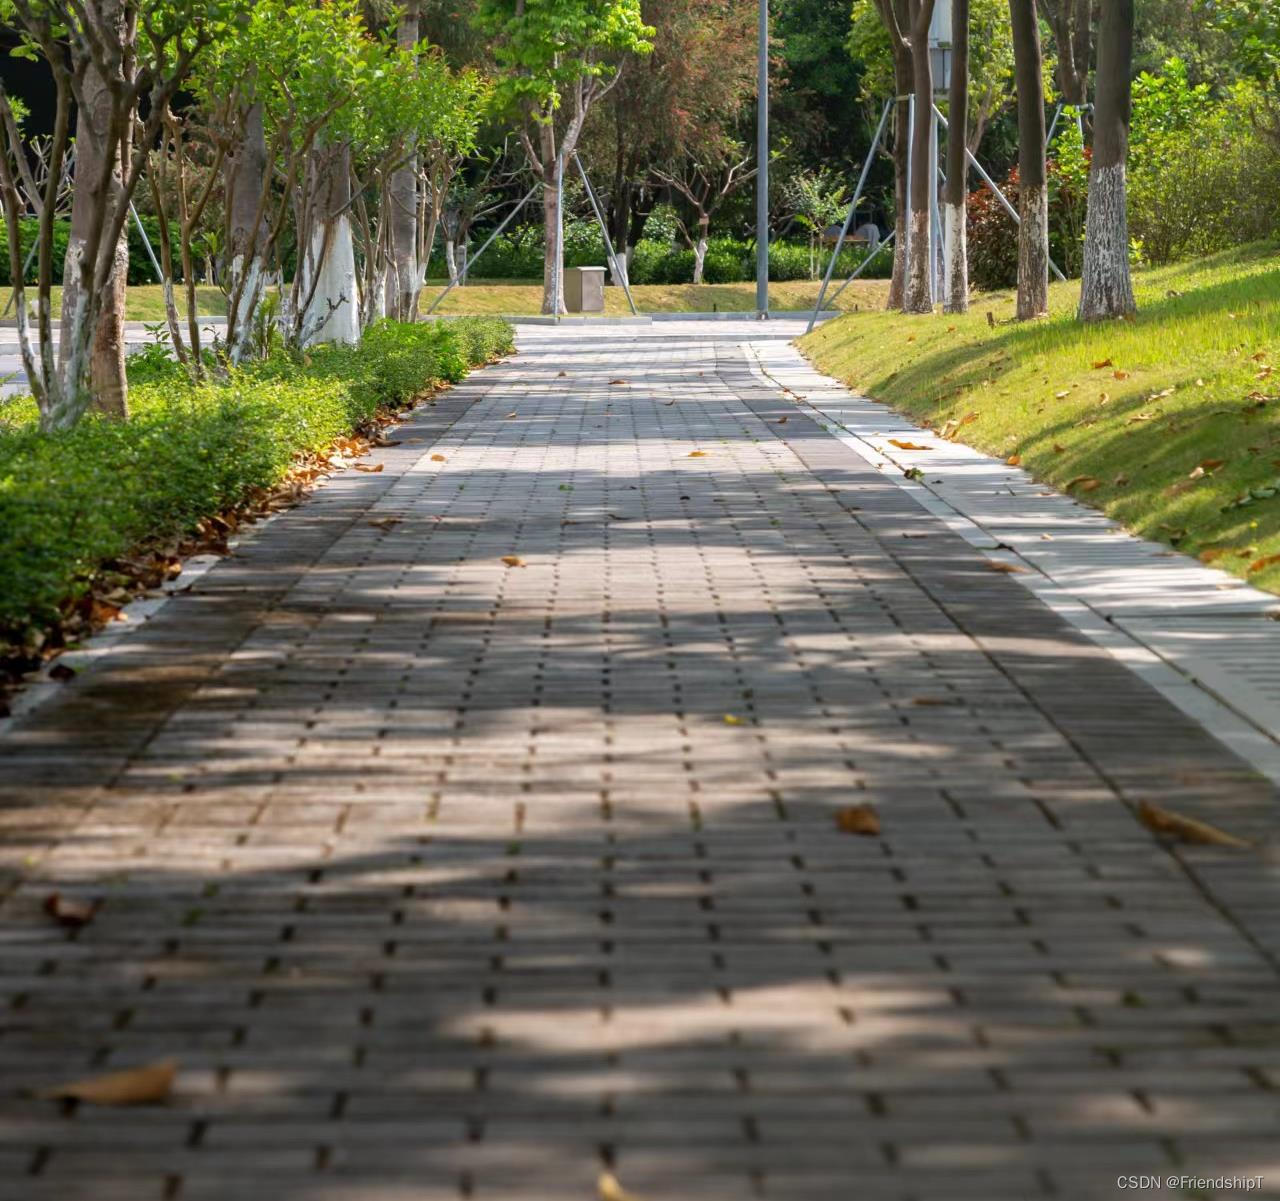
- 主要思路:利用模板匹配把两张图片的相似重叠部分找出,拼接成一个新图片。这属于传统算法的范畴,有一定的局限性。
- 模板匹配相关知识点,可查阅OpenCV-Python快速入门(十四):模板匹配
import cv2
import numpy as np
from matplotlib import pyplot as plt
# 读取图片
img1 = cv2.imread('/kaggle/input/test-image4/track_1.jpg')
# BGR -> Gray
img1_gray = cv2.cvtColor(img1,cv2.COLOR_BGR2GRAY)
# BGR -> RGB
img1_RGB = cv2.cvtColor(img1,cv2.COLOR_BGR2RGB)
# 模板图片
template = img1_gray[-1:] # h,w
# 模板图片的高和宽
th, tw = template.shape[::]
# 读取图片
img2 = cv2.imread('/kaggle/input/test-image4/track_2.jpg')
# BGR -> Gray
img2_gray = cv2.cvtColor(img2,cv2.COLOR_BGR2GRAY)
# BGR -> RGB
img2_RGB = cv2.cvtColor(img2,cv2.COLOR_BGR2RGB)
# 拷贝img2,用于下面绘制矩形
img2_RGB2 = img2_RGB.copy()
# 模板匹配,查找相似重叠部分
rv = cv2.matchTemplate(img2_gray,template,cv2.TM_SQDIFF)
# # 查找最值(极值)与最值所在的位置
minVal, maxVal, minLoc, maxLoc = cv2.minMaxLoc(rv)
topLeft = minLoc # 左上角点
bottomRight = (topLeft[0] + tw, topLeft[1] + th) # 右下角点
# print(topLeft,bottomRight)
cv2.rectangle(img2_RGB2,topLeft, bottomRight, (255,0,0), 2)
# 图片拼接
# 新图片的高和宽
new_height, new_width = img1.shape[0]+img2.shape[0]-topLeft[1], img1.shape[1]
# 创建一个纯黑的大图
new_image = np.zeros((new_height, new_width, 3), np.uint8) # (h,w,channel)
# 两张图片的相似重叠部分找出,剔除相似重叠部分,拼接成一个新图片
new_image[0:img1.shape[0],0:img1.shape[1]] = img1
new_image[img1.shape[0]:new_height,0:img1.shape[1]] = img2[topLeft[1]:img2.shape[1],0:img1.shape[1]]
# BGR -> RGB
new_image_RGB = cv2.cvtColor(new_image,cv2.COLOR_BGR2RGB)
# 显示图片
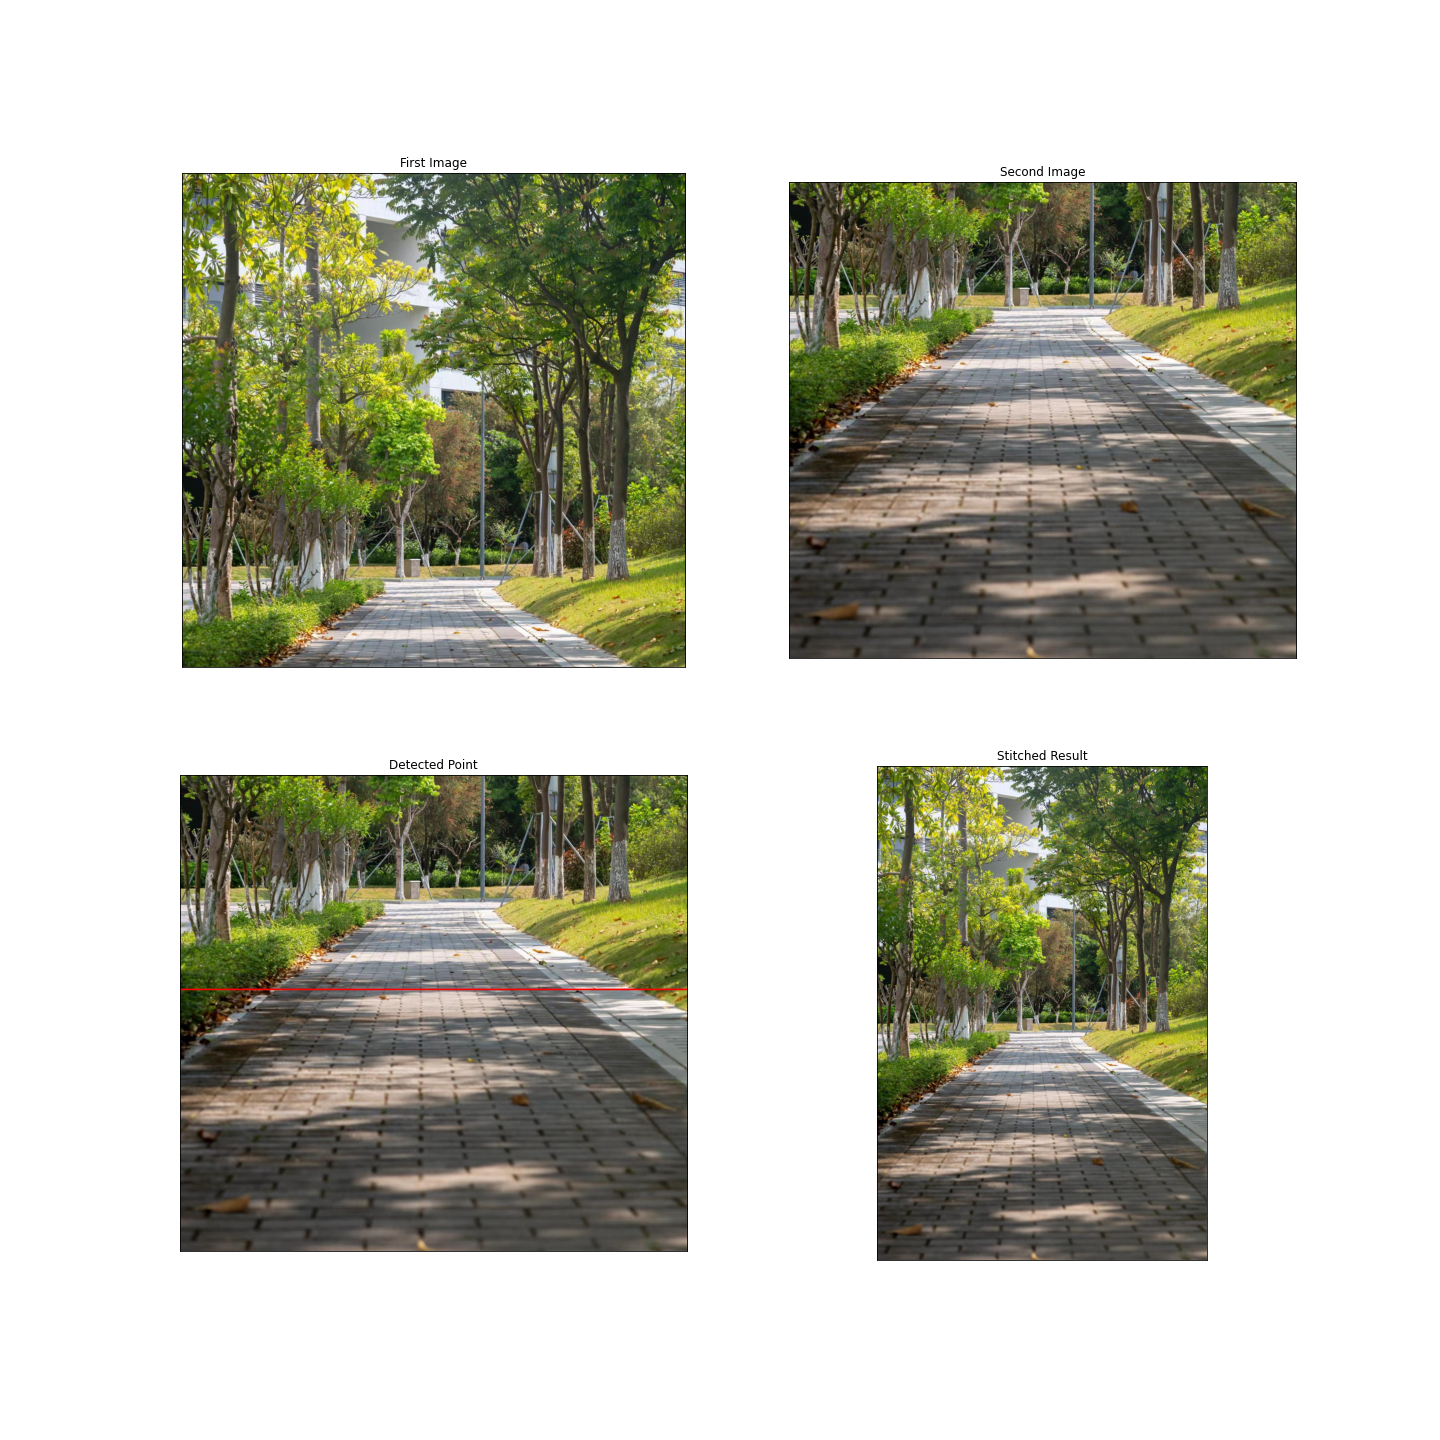
plt.figure(figsize=(20, 20))
plt.subplot(221),plt.imshow(img1_RGB)
plt.title('First Image'), plt.xticks([]), plt.yticks([])
plt.subplot(222),plt.imshow(img2_RGB)
plt.title('Second Image'), plt.xticks([]), plt.yticks([])
plt.subplot(223),plt.imshow(img2_RGB2)
plt.title('Detected Point'), plt.xticks([]), plt.yticks([])
plt.subplot(224),plt.imshow(new_image_RGB)
plt.title('Stitched Result'), plt.xticks([]), plt.yticks([])
plt.show()
参考文献
[1] https://opencv.org/
[2] 李立宗. OpenCV轻松入门:面向Python. 北京: 电子工业出版社,2019
- 更多精彩内容,可点击进入
OpenCV-Python小应用专栏或我的个人主页查看


 8706
8706


 被折叠的 条评论
为什么被折叠?
被折叠的 条评论
为什么被折叠?
 到【灌水乐园】发言


