


The Space of Representations
Every time we train a neural net, we get new representations. This is true even if we train the same network multiple times. The result is that it is very easy to end up with lots of representations of a dataset.
We rarely look at any of these representations, but if we want to, it’s pretty easy to make visualizations of all of them. Here’s a bunch to look at.
Now, while we can visualize a lot of representations like this, it isn’t terribly helpful. What do we learn from it? Not much. We have lots of particular representations, but it’s hard to compare them or get a big picture view.
Let’s focus on comparing representations for a moment. The tricky thing about this is that fundamentally similar neural networks can be very different in ways we don’t care about. Two neurons might be switched. The representation could be rotated or flipped.


We want to, somehow, forget about these unimportant differences and focus only on the important differences. We want a canonical form for representations, that encodes only meaningful differences.
Distance seems fundamental, here. All of these unimportant differences are isometries – that is, transformations like rotation or switching two dimensions do not change the distances between points. On the other hand, distance between points is really important: things being close together is a representations way of saying that they are similar, and things being far apart is a representation saying they are different.
Thankfully, there’s an easy way to forget about isometries. For a representation X X, there’s an associated metric function, dX dX, which gives us the distance between pairs of points within that representation. For another representation Y Y, dX=dY dX=dY if and only if X X is isometric to Y Y. The metric functions encode precisely the information we want!
We can’t really work with dX dX because it is actually a function on a very high-dimensional continuous space.4 We need to discretize it for it to be useful.
One thing we can do with DX DX is flatten it to get a vector encoding the properties of the representation X X. We can do this for a lot of representations, and we get a collection of high-dimensional vectors.
The natural thing to do, of course, is to apply dimensionality reduction, such as t-SNE, to our representations. Geoff Hinton dubbed this use of t-SNE “meta-SNE”. But one can also use other kinds of dimensionality reduction.5 6
In the following visualization, there are three boxes. The largest one, on the left, visualizes the space of representations, with every point corresponding to a representation. The points are positioned by dimensionality reduction of the flattened distance matrices, as above. One way to think about this that distance between representations in the visualization represents how much they disagree on which points are similar and which points are different.
Next, the middle box is a regular visualization of a representation of MNIST, like the many we’ve seen previously. It displays which ever representation you hover over in left box. Finally, the right most box displays particular MNIST digits, depending on which point you hover over in the middle box.
Left: Visualization of representations with meta-SNE, points are representations. Middle:Visualization of a particular representation, points are MNIST data points. Right: Image of a particular data point.
This visualization shifts us from looking at trees to seeing the forest. It moves us from looking at representations, to looking at the space of representations. It’s a step up the ladder of abstraction.
Imagine training a neural network and watching its representations wander through this space. You can see how your representations compare to other “landmark” representations from past experiments. If your model’s first layer representation is in the same place a really successful model’s was during training, that’s a good sign! If it’s veering off towards a cluster you know had too high learning rates, you know you should lower it. This can give us qualitative feedback during neural network training.
It also allows us to ask whether two models which achieve comparable results are doing similar things internally or not.
Deep Learning for Visualization
All of the examples above visualize not only the neural network, but the data it operates on. This is because the network is inextricably tied to the data it operates on.7
The visualizations are a bit like looking through a telescope. Just like a telescope transforms the sky into something we can see, the neural network transforms the data into a more accessible form. One learns about the telescope by observing how it magnifies the night sky, but the really remarkable thing is what one learns about the stars. Similarly, visualizing representations teaches us about neural networks, but it teaches us just as much, perhaps more, about the data itself.
(If the telescope is doing a good job, it fades from the consciousness of the person looking through it. But if there’s a scratch on one of the telescope’s lenses, the scratch is highly visible. If one has an example of a better telescope, the flaws in the worse one will suddenly stand out. Similarly, most of what we learn about neural networks from representations is in unexpected behavior, or by comparing representations.)
Understanding data and understanding models that work on that data are intimately linked. In fact, I think that understanding your model has to imply understanding the data it works on. 8
While the idea that we should try to visualize neural networks has existed in our community for a while, this converse idea – that we can use neural networks for visualization – seems equally important is almost entirely unexplored.
Let’s explore it.
Unthinkable Thoughts, Incomprehensible Data
In his talk ‘Media for Thinking the Unthinkable’, Bret Victor raises a really beautiful quote from Richard Hamming:
Just as there are odors that dogs can smell and we cannot, as well as sounds that dogs can hear and we cannot, so too there are wavelengths of light we cannot see and flavors we cannot taste.
Why then, given our brains wired the way they are, does the remark “Perhaps there are thoughts we cannot think,” surprise you?
Evolution, so far, may possibly have blocked us from being able to think in some directions; there could be unthinkable thoughts.
- Richard Hamming, The Unreasonable Effectiveness of Mathematics
Victor continues with his own thoughts:
These sounds that we can’t hear, this light that we can’t see, how do we even know about these things in the first place? Well, we built tools. We built tools that adapt these things that are outside of our senses, to our human bodies, our human senses.
We can’t hear ultrasonic sound, but you hook a microphone up to an oscilloscope and there it is. You’re seeing that sound with your plain old monkey eyes. We can’t see cells and we can’t see galaxies, but we build microscopes and telescopes and these tools adapt the world to our human bodies, to our human senses.
When Hamming says there could be unthinkable thoughts, we have to take that as “Yes, but we build tools that adapt these unthinkable thoughts to the way that our minds work and allow us to think these thoughts that were previously unthinkable.”
- Bret Victor, Media for Thinking the Unthinkable
This quote really resonates with me. As a machine learning researcher, my job is basically to struggle with data that is incomprehensible – literally impossible for the human mind to comprehend – and try to build tools to think about it and work with it.9
However, from the representation perspective, there’s a further natural step to go with this idea…
Representations in Human Vision
Lets consider human vision for a moment. Our ability to see is amazing. The amazing part isn’t our eyes detecting photons, though. That’s the easy, simple part. The amazing thing is the ability of our brain to transform the mess of swirling high-dimensional data into something we can understand. To present it to us so well that it seems simple! We can do this because our brains have highly specialized pathways for processing visual data.
Just as neural networks transform data from the original raw representations into nice representations, the brain transforms our senses from complicated high-dimensional data into nice representations, from the incomprehensible to the comprehensible. My eye detects photons, but before I even become consciously aware of what my eye sees, the data goes through incredibly sophisticated transformations, turning it into something I can reason about.10 The brain does such a good job that vision seems easy! It’s only when you try to understand visual data without using your visual system that you realize how incredibly complicated and difficult to understand it is.
Senses We Don’t Have
Unfortunately, for every sense we have, there are countless others we don’t. Countless modes of experience lost to us. This is a tragedy. Imagine the senses we could have! There are vast collections of text out there: libraries, wikipedia, the Internet as a whole – imagine having a sense that allowed you to see a whole corpus at once, which parts are similar and which are different! Every collision at the Large Hadron Collider is monitored by a battery of different sensors – imagine having a sense that allowed us to ‘see’ collisions as clearly as we can see images! The barrier between us and these potential senses isn’t getting the data, it’s getting the data to our brain in a nice representation.
The easiest way get new kinds of data into the brain is to simply project it into existing senses. In some very particular cases, this works really well. For example, microscopes and telescopes are extremely good at making a new kind of data accessible by projecting it into our normal visual sense. They work because macroscopic visual data and microscopic visual data are just visual data on different scales, with very similar structure to normal visual data, and are well handled by the same visual processing systems. Much more often, projecting data into an existing sense (for example, with PCA) throws away all but the crudest facets of the data. It’s like taking an image and throwing away everything except the average color. It’s something… but not much.
We can also try to get this data to us symbolically. Of course, rattling off 10,000-dimensional vectors to people is hopeless. But traditional statistics gives us some simple models we can fit, and then discuss using language of means, variance, covariance and so on. Unfortunately, fitting gaussians is like describing clouds as ovals. Talking about the covariance of two variables is like talking about the slope, in a particular direction, of a high-dimensional surface. Even very sophisticated models from statistics seem unable to cope with the complicated, swirling, high-dimensional data we see in problems like vision.
Deep learning gives us models that can work with this data. More that that, it gives us new representations of the data. The representations it produces aren’t optimized to be nice representations for the human brain – I have no idea how one would optimize for that, or even what it would mean – but they are much nicer than the original data. I think that learning representations, with deep learning or other powerful models, is essential to helping humans understand new forms of data.
A Map of Wikipedia
The best example I can give is the visualization of Wikipedia from earlier. Wikipedia is a repository of human knowledge. By combining deep learning and dimensionality reduction, we can make a map of it, as we saw earlier:
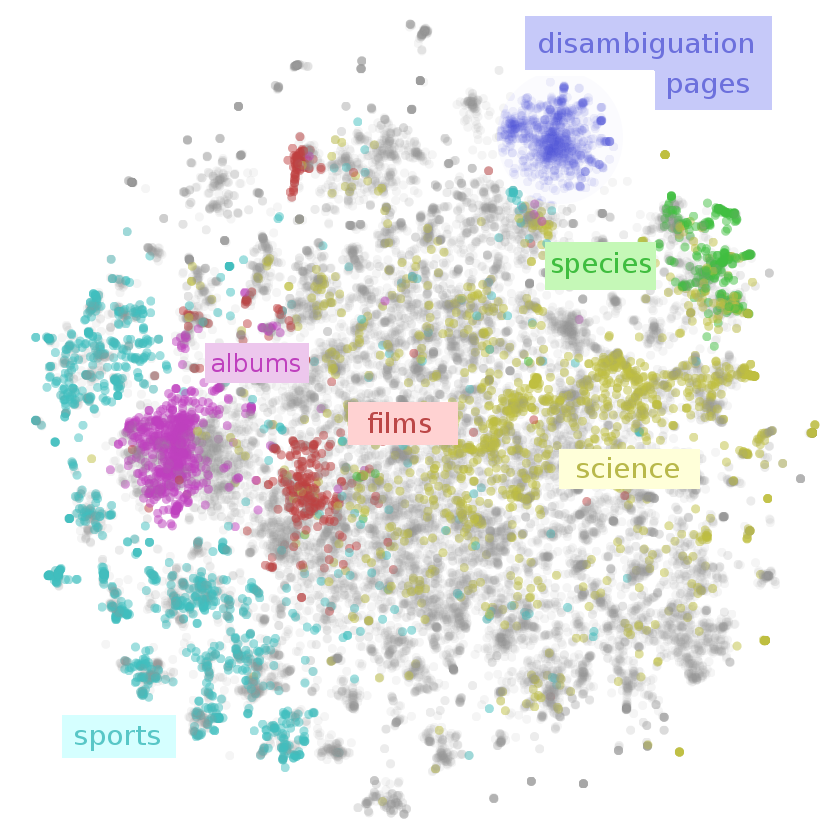
This style of visualization feels important to me. Using deep learning, we’ve made a visualization, an interface, for humans to interact with Wikipedia as a whole. I’m not claiming that it’s a great interface. I’m not even sure I think it is terribly useful. But it’s a starting point and a proof of concept.
Why not just use dimensionality reduction by itself? If we had just used dimensionality reduction, we would be visualizing geometric or topological features of the Wikipedia data. Using deep learning to transform the data allows us to visualize the underlying structure, the important variations – in some cases, the very meaning of the data11 – instead.
I think that high-quality representations have a lot of potential for users interacting with complicated data, going far beyond what is explored here. The most natural direction is machine learning: once you are in a high-quality representation, many normally difficult tasks can be accomplished with very simple techniques and comparatively little data.12 With a curated collection of representations, one could make some really exciting machine learning accessible,13although it would carry with it challenges for end users14 and the producers of representations.15
Quantifying the Subjective
Reasoning about data through representations can be useful even for kinds of data the human mind understands really well, because it can make explicit and quantifiable things that are normally tacit and subjective.
You probably understand English very well, but much of this knowledge is subjective. The meaning of words is socially constructed, arising from what people mean by them and how they use them. It’s canonicalized in dictionaries, but only to a limited extent. But the subtleties in usage and meaning are very interesting because of how they reflect culture and society. Unfortunately, these things are kind of fuzzy, and one typically needs to rely on anecdotes and personal impressions.
One remarkable property of high-quality word embeddings is that they seem to reify these fuzzy properties into concrete mathematical structures! As mentioned earlier, directions in word embeddings correspond to particular kinds of differences in meaning. For example, there is some direction corresponding to gender. (For more details, see my post Deep Learning, NLP, and Representations.)
By taking the difference of two word vectors, we can get directions for gender. For example, we can get a masculine direction (eg. “man” - “woman”) or a feminine direction (eg. “woman” - “man”). We can also get age directions. For example, we can get an adult direction (eg. “woman” - “girl”) or a child direction (eg. “boy” - “man”).

Once we have these directions, there’s a very natural question to ask: which words are furthest in these directions? What are the most masculine or feminine words? The most adult, the most childish? Well, let’s look at the Wikipedia GloVe vectors, from Pennington, et al. at Stanford:
- Masculine words tend to be related to military/extremism (eg. aresenal, tactical, al qaeda), leadership (eg. boss, manager), and sports (eg. game, midfielder).
- Female words tend to be related to reproduction (eg. pregnancy, birth), romance (eg. couples, marriages), healthcare (eg. nurse, patients), and entertainment (eg. actress).
- Adult words tend to be related to power (eg. victory, win), importance (eg. decisive, formidable), politics (eg. political, senate) and tradition (eg. roots, churches).
- Childish words tend to be related to young families (eg. adoption, infant), activities (eg. choir, scouts), items (eg. songs, guitar, comics) and sometimes inheritance (eg. heir, throne).
Of course, these results depend on a lot of details. 16
I’d like to emphasize that which words are feminine or masculine, young or adult, isn’t intrinsic. It’s a reflection of our culture, through our use of language in a cultural artifact. What this might say about our culture is beyond the scope of this essay. My hope is that this trick, and machine learning more broadly, might be a useful tool in sociology, and especially subjects like gender, race, and disability studies.
The Future
Right now machine learning research is mostly about getting computers to be able to understand data that humans do: images, sounds, text, and so on. But the focus is going to shift to getting computers to understand things that humans don’t. We can either figure out how to use this as a bridge to allow humans to understand these things, or we can surrender entire modalities – as rich, perhaps more rich, than vision or sound – to be the sole domain of computers. I think user interface could be the difference between powerful machine learning tools – artificial intelligence – being a black box or a cognitive tool that extends the human mind.
There’s actually two kinds of black boxes we need to avoid. Two slightly different, but closely connected problems. The first problem is that deep learning itself is presently a kind of black box. The second is that tools using deep learning to solve particular problems might be black boxes.
We need to figure out how to open the deep learning black box. One powerful approach is visualizing representations. In this essay, we used interactive media to visualize and explore some powerful models from Google’s deep learning research group. We then observed that particular neural network architectures leave geometric signatures in their representations. Finally, we created the meta-SNE algorithm, in order to step up the ladder of abstraction, and think about the space of neural networks, instead of particular ones.
The problem of particular tools being black boxes is, in some ways, harder, because there’s so much diversity. But a common problem is that humans can’t think about the sort of high-dimensional structures machine learning problems typically involve. We observed that visualizing representations can also be a tool to help humans understand and reason about these structures. We saw that representations can be helpful even for data we understand really well.
These are problems we’re only beginning to attack. I think there’s a lot more for us to uncover here. It’s an odd kind of work, at the intersection of machine learning, mathematics, and user interface. But I think it’s important.
If you enjoyed this post, consider subscribing to my rss feed.
(I would be delighted to hear your comments and thoughts: you can comment inline or at the end. For typos, technical errors, or clarifications you would like to see added, you are encouraged to make a pull request on github.)
Acknowledgements
I’m grateful for the hospitality of Google’s deep learning research group, which had me as an intern while I did most of the work this post is based on. I’m especially grateful to my internship host, Jeff Dean.
I was greatly helped by the comments, advice, and encouragement of many Googlers, both in the deep learning group and outside of it. These include: Greg Corrado, Jon Shlens, Matthieu Devin, Andrew Dai, Quoc Le, Anelia Angelova, Oriol Vinyals, Ilya Sutskever, Ian Goodfellow, Jutta Degener, and Anna Goldie.
I was strongly influenced by the thoughts, comments and notes of Michael Nielsen, especially his notes on Bret Victor’s work. Michael’s thoughts persuaded me that I should think seriously about interactive visualizations for understanding deep learning. The section “Unthinkable Thoughts, Incomprehensible Data” was particularily influenced by him.
I was also helped by the support and comments of a number of other non-Googler friends, including Yoshua Bengio, Laura Ball, Rob Gilson, Henry de Valence, Yomna Nasser, and James Koppel.
This blog post was made possible by a number of wonderful Javascript libraries, including D3.js,MathJax, and jQuery. A big thank you to everyone who contributed to these libraries.
-
The representation perspective is an abstraction over inputs. Instead of trying to understand what the neural network does to a single input, we try to understand what it does to the space of inputs, to the data manifold. It’s a step up the ladder of abstraction. Later, we will take a second step, allowing us to look at the space of neural networks, instead of a single one.↩
-
We categorize words using WordNet synsets. Each synset is labeled something like “region.n.03” (region, noun, meaning 3) or “travel.v.01” (travel, verb, meaning 1).↩
-
It should be noted that, later, Sutskever et al. switched to reversing the order of the input sentence, finding this improved their results.
 ↩
↩ -
The natural way to think about distance between functions is to consider them as infinite dimensional vectors (f(0), f(1), f(2)...) (f(0), f(1), f(2)...). In the case of a function on the real numbers or on Rn Rn, it’s a 2ℵ0 2ℵ0 dimensional vector! While we can actually represent the function finitely (because we know it’s based on a neural network, which has a finite number of paramaters) it’s really hard to actually calculate distances.↩
-
I’ve heard that some similar techniques may be used in neuroscience, where one often needs to compare different representations of the same data. Further, in a previous post, John MacCuish commented that one could use the Mantel Test on the distance matrices to compare representations – this gets at a very similar idea!↩
-
There are some variations you can do on the basic meta-SNE algorithm. For example, meta-SNE analyzes how much representations agree on which data points are similar, by comparing distance between the points in different representations. But we can also compare how much representations agree on analogies, on the manner in which things are different, by comparing the distance between differences of vectors in different representations. In principle, this information is encoded in the distances between data points, but one can make it much more explicit. It may also be the case that we care more about which networks are very similar, in which case we could apply some non-linearity pointwise to the distance matrix, to exaggerate the difference between close and not-close data points.↩
-
The neural network is a function with the domain of the data manifold it was trained on.↩
-
People sometimes complain: “Neural networks are so hard to understand! Why can’t we use understandable models, like SVMs?” Well, you understand SVMs, and you don’t understand visual pattern recognition. If SVMs could solve visual pattern recognition, you would understand it. Therefore, SVMs are not capable of this, nor is any other model you can really understand. (I don’t mean this to be a ‘proof’ obviously, but I am pretty serious about this view.)↩
-
You could imagine defining a field this way, as attempting to build tools for thinking about and working with the complicated high-dimensional probability distributions we see in the real world. The field you get isn’t quite machine learning, but it has a lot of overlap. It actually feels more compelling to me. Perhaps this is “data science”?↩
-
As someone without a neuroscience background, I feel a bit nervous making remarks like this. That said, I think what I’m mostly saying is an interpretation, an abstraction, over some fairly basic facts about how human vision works. I also know that at least some neuroscientists subscribe to this interpretation and seriously look at things through this sort of lens. For example, see DiCarlo and Cox’s paper ‘Untangling invariant object recognition’.↩
-
This is a very bold claim. My defense is this: word embedding models seem to encode semantic meaning in directions, creating a “semantic vector space.” Paragraph vectors (at least the kind that we’re using) do the same. Somehow, these models seem to discover human meaning while learning the structure of the space. The results of the DeViSE paper suggest that this may be somewhat general in good high-level representations.↩
-
This is some combination of transfer learning, pretraining, and multi-task learning. How well it works varies, but there’s certainly a lot of successes. Obviously, the ideal is to have a lot of data to train a representation specifically for your task. But failing that, we can also try to make very transferable representations, possibly by training them for a bunch of different tasks.↩
-
Curating large collections of structured data has lead to some really interesting tools (for example, Wolfram Alpha). My intuition is that curating a collection of high-quality representations for different kinds of data could also be really interesting. I think MetaMindis the closest thing I know of to this, right now.↩
-
It seems like a lot of the problems that exist with proprietary file formats could end up happening here. An end user could very easily end up tied to a particular representation. Do we need open or standardized representations?↩
-
The problem with just releasing representations, from the perspective of the model producer, is what Geoff Hinton calls “Dark Knowledge”. Representations subtly encode a lot of the knowledge of your model. By releasing representations, organizations are implicitly releasing a significant amount of information about their model.↩
-
The answer depends a lot on the corpus you train on. If you train your word embedding on a news corpus, that will be different than if you train it on Wikipedia. And I assume if you trained on a corpus of 19th century literature, that would be very different again. It also depends on your model, and how well you trained it. The precise interpretation is obviously sensitive to the model. But, generally, it will be something like this: There is a certain difference in how language is used around the word “man” and the word “woman”; which words cause language around them to change most in that manner? (Replace “man” and “woman” for whatever you want.)↩


 4万+
4万+

 被折叠的 条评论
为什么被折叠?
被折叠的 条评论
为什么被折叠?
 到【灌水乐园】发言


