


import sys
from matplotlib.backends.backend_qtagg import FigureCanvasQTAgg as FigureCanvas
from matplotlib.figure import Figure
from PySide6.QtCore import QTimer, Signal
import matplotlib.pyplot as plt
import numpy as np
from PySide6.QtWidgets import (QApplication, QHBoxLayout, QLabel, QPushButton,
                               QVBoxLayout, QWidget)
import pyqtgraph as pg

# 创建一个窗口
win = pg.GraphicsLayoutWidget(show=True, title="Error Fill Between Example")
win.resize(800, 600)
win.setWindowTitle('PyQtGraph Error Fill Between Example')

# 创建一个绘图区域
plot = win.addPlot(title="Error Fill Between Example")

# 生成示例数据
x = np.linspace(0, 10, 100)
###### 绘制蓝色带方差的曲线 ######
y1 = np.sin(x)
y2 = np.sin(x) + 0.5
y3 = np.sin(x) - 0.5
y1 = np.reshape(y1, (1, np.size(y1)))
y2 = np.reshape(y2, (1, np.size(y2)))
y3 = np.reshape(y3, (1, np.size(y3)))
blue = np.concatenate((y1, y2, y3))   # 将三个数据拼接到一起
blue_mean = np.mean(blue, 0)   # 计算均值
blue_std = np.std(blue, 0)     # 计算标准差

# 创建第一组的三条曲线
# 主曲线
curvey_blue = pg.PlotCurveItem(x, blue_mean, pen='b')
# 上偏差曲线
curvey_blue_std1 = pg.PlotCurveItem(x, blue_mean + blue_std, pen='b')
# 下偏差曲线
curvey_blue_std2 = pg.PlotCurveItem(x, blue_mean - blue_std, pen='b')

# 将主曲线添加到绘图区域
plot.addItem(curvey_blue)

# 创建一个 FillBetweenItem 用于填充主曲线与上下偏差曲线之间的区域
fill = pg.FillBetweenItem(curvey_blue, curvey_blue_std1, brush=(0, 0, 255, 50))
fill2 = pg.FillBetweenItem(curvey_blue, curvey_blue_std2, brush=(0, 0, 255, 50))
plot.addItem(fill)
plot.addItem(fill2)

###### 绘制红色带方差的曲线 ######
yy1 = np.cos(x) + 2
yy2 = np.cos(x) + 2.5
yy3 = np.cos(x) + 1.5
yy1 = np.reshape(yy1, (1, np.size(yy1)))
yy2 = np.reshape(yy2, (1, np.size(yy2)))
yy3 = np.reshape(yy3, (1, np.size(yy3)))
red = np.concatenate((yy1, yy2, yy3))
red_mean = np.mean(red, 0)
red_std = np.std(red, 0)

# 创建第二组的三条曲线
# 主曲线
curvey_red = pg.PlotCurveItem(x, red_mean, pen='r')
# 上偏差曲线
curvey_red_std1 = pg.PlotCurveItem(x, red_mean + red_std, pen='r')
# 下偏差曲线
curvey_red_std2 = pg.PlotCurveItem(x, red_mean - red_std, pen='r')


# 将主曲线添加到绘图区域
plot.addItem(curvey_red)

# 创建一个 FillBetweenItem 用于填充主曲线与上下偏差曲线之间的区域
fill = pg.FillBetweenItem(curvey_red, curvey_red_std1, brush=(255, 0, 0, 50))
fill2 = pg.FillBetweenItem(curvey_red, curvey_red_std2, brush=(255, 0, 0, 50))
plot.addItem(fill)
plot.addItem(fill2)


# 启动 PyQt 应用程序
if __name__ == "__main__":
    # 创建一个 PyQt 应用程序
    if not QApplication.instance():
        app = QApplication(sys.argv)
    else:
        app = QApplication.instance()
    app.exec()
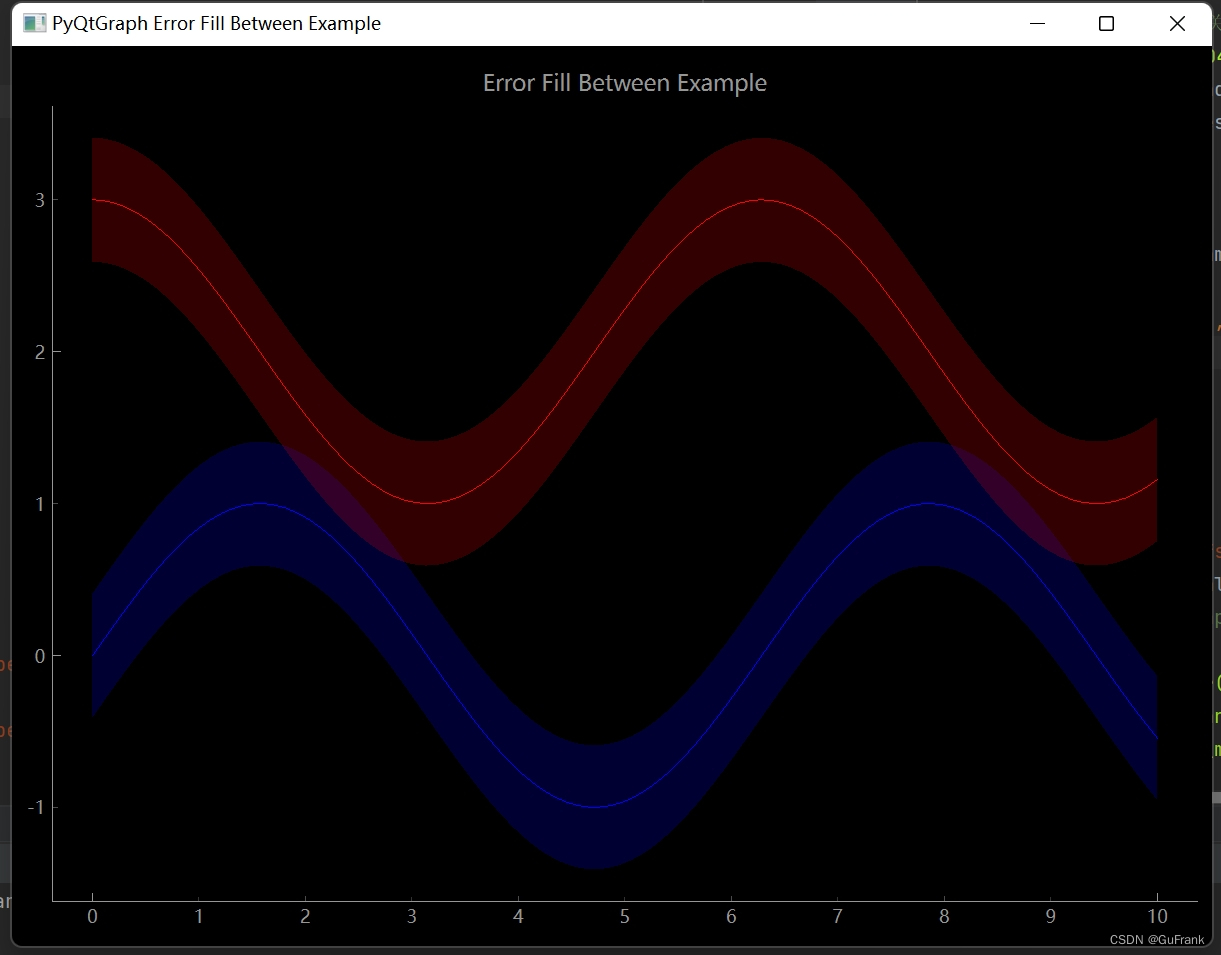
实现的效果如下:


 1043
1043

 被折叠的 条评论
为什么被折叠?
被折叠的 条评论
为什么被折叠?
 到【灌水乐园】发言


