


pyqtgraph是基于pyqt5/pyside2/pyqt6/pyside6开发的高效科学数据可视化工具,其界面的布局方式和pyside6是一样的,本博文主要记录一下使用pyqtgraph的GraphicsLayoutWidget和ImageView的用法,方便后续直接使用,代码参考了官方文档。
# -*- coding: utf-8 -*-
"""
Created on Sun Jul 10 17:27:02 2022

@author: 18819
"""
from PySide6.QtCore import *
from PySide6.QtWidgets import *
from PySide6.QtGui import *
from PySide6 import QtGui  # (the example applies equally well to PySide2)
import pyqtgraph as pg
import numpy as np
from skimage.io import imread

pg.setConfigOption('background', 'w')
# 设置显示前景色为黑色,默认为灰色
pg.setConfigOption('foreground', 'k')
# 设置图像显示以行为主,默认以列为主
pg.setConfigOption('imageAxisOrder', 'row-major')


x = np.arange(1000)
y = np.random.normal(size=(3, 1000))
# plotWidget = pg.plot(title="Three plot curves")
global filePatr
@Slot()
def press_me():
    global filePath
    print('button clicked!')
    filePath,_ = QFileDialog.getOpenFileName()
    print(filePath)

    #

## Always start by initializing Qt (only once per application)
app = QApplication([])

## Define a top-level widget to hold everything
w = QWidget()

## Create some widgets to be placed inside
btn = QPushButton('press me')
btn.clicked.connect(press_me)

text = QLineEdit('enter text')
listw = QListWidget()

# 显示图像
graphicsView = pg.ImageView()
# 隐藏直方图,菜单按钮,ROI
graphicsView.ui.histogram.hide()
graphicsView.ui.menuBtn.hide()
graphicsView.ui.roiBtn.hide()

img = imread(r"C:\Users\18819\Pictures\BxeE-hsmkfyn1625133.jpg")
graphicsView.setImage(img)

# plot = pg.PlotWidget(title="Three plot curves")
graph = pg.GraphicsLayoutWidget(title="Three plot curves")
for i in range(3):
    p = graph.addPlot(row=i, col=0)
    p.plot(x, y[i], pen=(i,3))

# viewbox = graph.addItem(img_item,row=3,col=0)
# viewbox.addView(graphicsView)

## Create a grid layout to manage the widgets size and position
layout = QGridLayout()
w.setLayout(layout)

## Add widgets to the layout in their proper positions
layout.addWidget(btn, 0, 0)   # button goes in upper-left
layout.addWidget(text, 1, 0)   # text edit goes in middle-left
layout.addWidget(listw, 2, 0)  # list widget goes in bottom-left
layout.addWidget(graphicsView,3,0)

layout.addWidget(graph, 0, 1, 4, 1)  # plot goes on right side, spanning 3 rows

## Display the widget as a new window
w.show()

## Start the Qt event loop
app.exec()
效果如下:
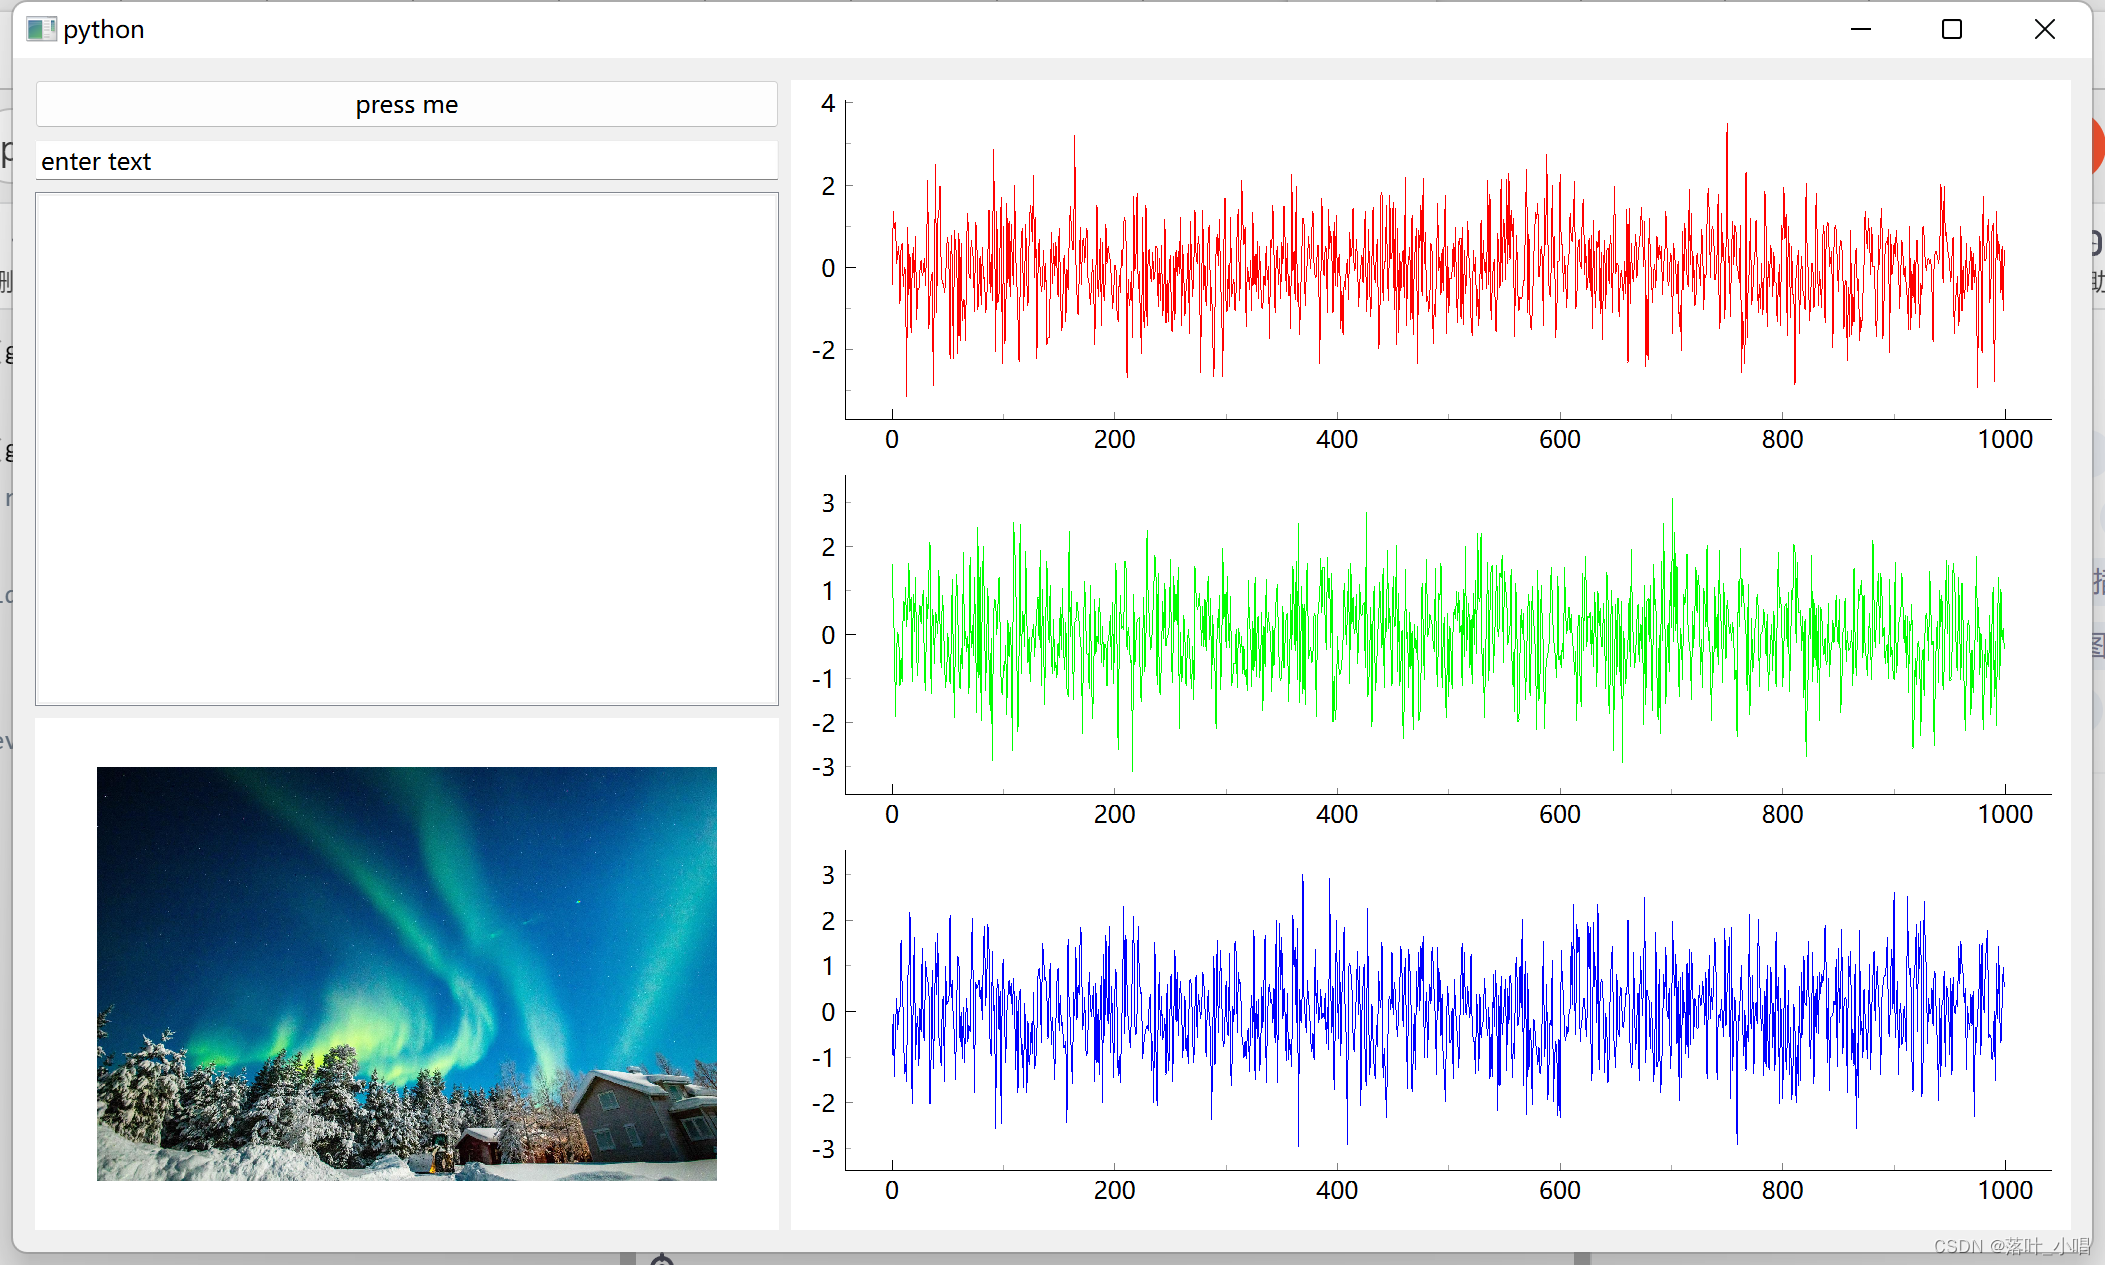
代码并未使用class封装,不过根据布局逻辑可以方便地嵌入到界面中。


 247
247


 被折叠的 条评论
为什么被折叠?
被折叠的 条评论
为什么被折叠?
 到【灌水乐园】发言


