


 本文档提供了Honeywell EPKS系统故障排查的详细步骤,包括检查服务日志、CPU负荷、SCADA扫描负荷等,以及解决报警、事件报告常见问题的方法,旨在帮助用户识别和修复系统问题。
Doc. No.: GSB-CPA-60006
Version: 0_01
Status: Approved
Date: May 5, 2022
DISCLAIMER
This document contains Honeywell proprietary information. Information contained herein is to be used solely for the purpose submitted, and no part of this document or its contents shall be
reproduced, published, or disclosed to a third party without the express permission of Honeywell International.
While this information is presented in good faith and believed to be accurate, Honeywell disclaims the implied warranties of merchantability and fitness for a purpose and makes no express warranties except as may be stated in its written agreement with and for its customer.
In no event is Honeywell liable to anyone for any direct, special, or consequential damages. The information and specifications in this document are subject to change without notice.
免责声明
该文件包含霍尼韦尔专有信息。本文件所包含的信息仅用于所提交的目的,未经霍尼韦尔国际的明确许可,不得复制、出版或向第三方披露本文件或其内容的任何部分。
虽然这些信息是善意提供的,并被认为是准确的,霍尼韦尔否认对适销性和适合某一目的的隐含保证,并且不做任何明示保证,除非可能在其与客户的书面协议中陈述。
在任何情况下,霍尼韦尔对任何人的任何直接、特殊或相应的损害负责。本文件所载资料及规格如有更改,恕不另行通知。
故障排查
下面一些步骤能帮助你排查和辨识特定的问题现象。

开始检查
这里列出一系列查询问题和一系列检查来帮助你关注于排查问题的根本原因。
如果这些查询问题和检查不能帮助你排查出问题,查看开始诊断。
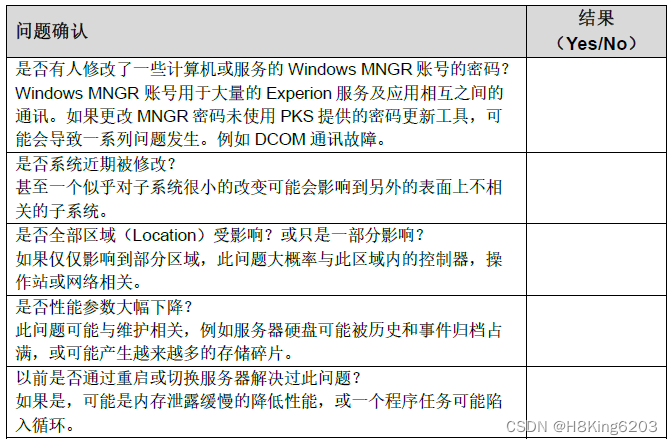
提出问题
你会通过下面的一些询问得到对故障的较好理解。

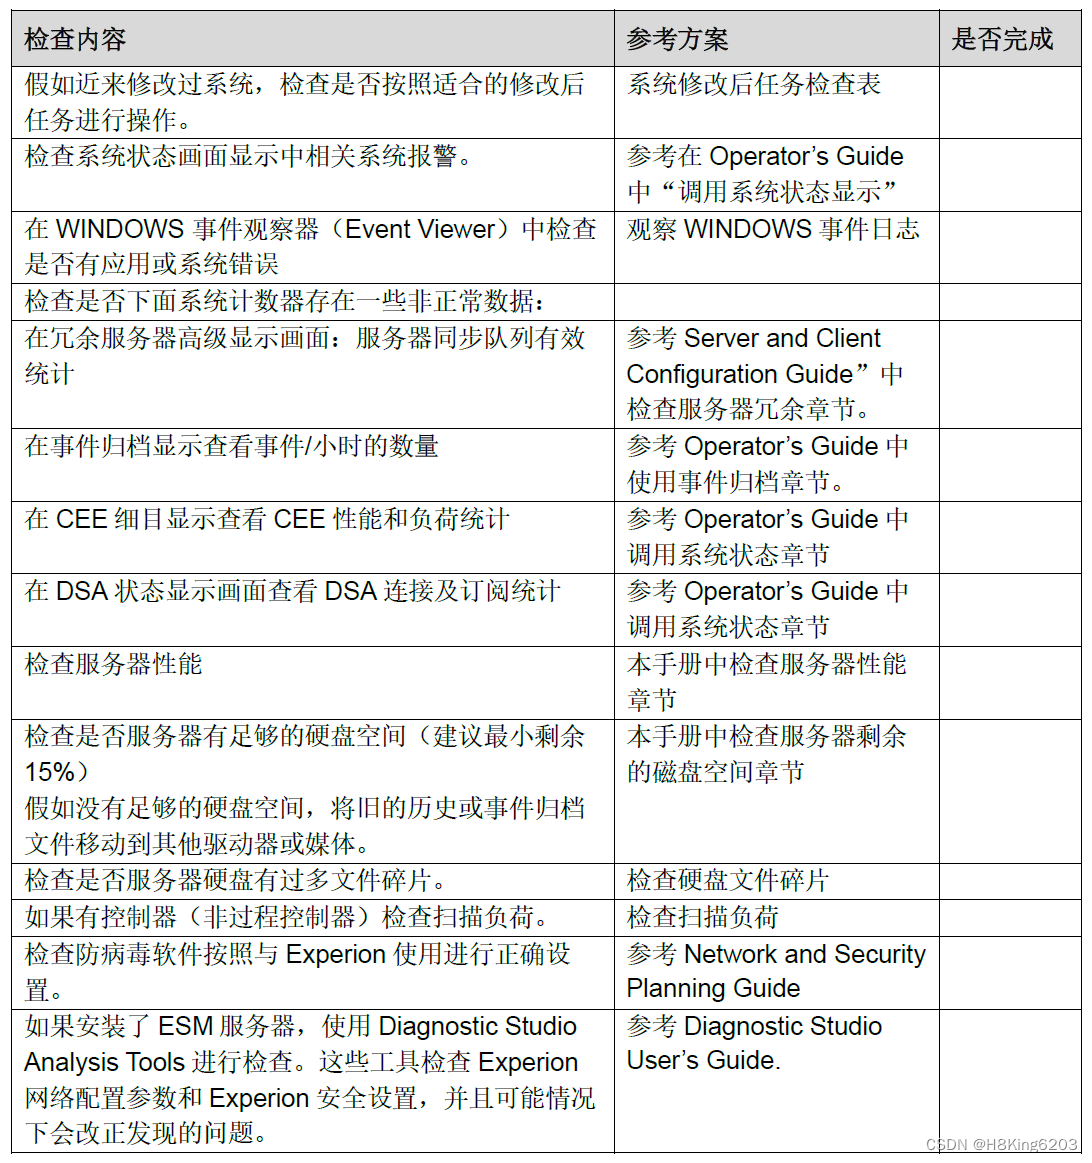
检查内容
通常完成如下基本检查会对故障有个很好的理解。
开始诊断
查看服务日志(Server Log)
Server Log是Experion服务器的主要日志。
在EPKS服务器上检查服务日志:
选择Start > Honeywell Experion PKS Tools > Experion PKS Server Log.
在Console Station上检查服务日志:
选择Start > Honeywell Experion PKS Tools > Experion PKS Console Station Log.
查看Windows事件日志
通过Windows事件查看器(Windows Event Viewer)检查事件记录。事件记录包含计算机的程序、安全和系统日志的信息。
通过如下步骤查看Windows事件记录:
1. 打开Windows control panel,找到 Administrative Tools;
2. 双击 Event Viewer。事件窗口打开;
3. 在左侧窗口找到Event Viewer 并展开;
4. 选择想要查看的Event Viewer的子项(例如Application 项)。
查看服务器/ 操作站的CPU负荷
使用Windows性能监控(Performance Monitor)来检查服务器和Console Station的CPU负荷。
Windows性能监控也包括其它方面的系统性能信息比如剩余内存。
检查CPU负荷:
- 打开Windows control panel,点击 Administrative Tools.找到Performance Monitor.
- 点击在左侧窗口Performance Monitor;
- 点击Add Counters图标打开Add Counter对话框;
- 点击选项Select counters from Computer;
- 输入要查看的计算机名;
- 点击Select counters 从列表,确认需要监测的处理器选为性能监测目标,点击%Processor Time;
- 点击Add;
- 点击OK关闭对话框。
查看SCADA扫描负荷
Quick Builder通道扫描统计画面显示扫描状态的统计信息,并指示是否有通道过负荷。
当排查通道扫描问题时,还应进行下述检查:
▪ 特定点的扫描周期设置,包括Auxiliary Parameters(这些在点细目的Scanning表单)。
▪ 是否组态了自由格式报表或自定义应用,这些有可能使用了专用扫描点(专用扫描点配置强制扫描功能,使得扫描负荷提高)。
查看扫描负荷:
1. 在Station中依次选择 Configure > System Hardware > SCADA Controllers 打开SCADA控制器画
 最低0.47元/天 解锁文章


 5701
5701

 被折叠的 条评论
为什么被折叠?
被折叠的 条评论
为什么被折叠?
 到【灌水乐园】发言


