


import numpy as np
import matplotlib.pyplot as plt
from mpl_toolkits.mplot3d import Axes3D
# 定义曲面的方程
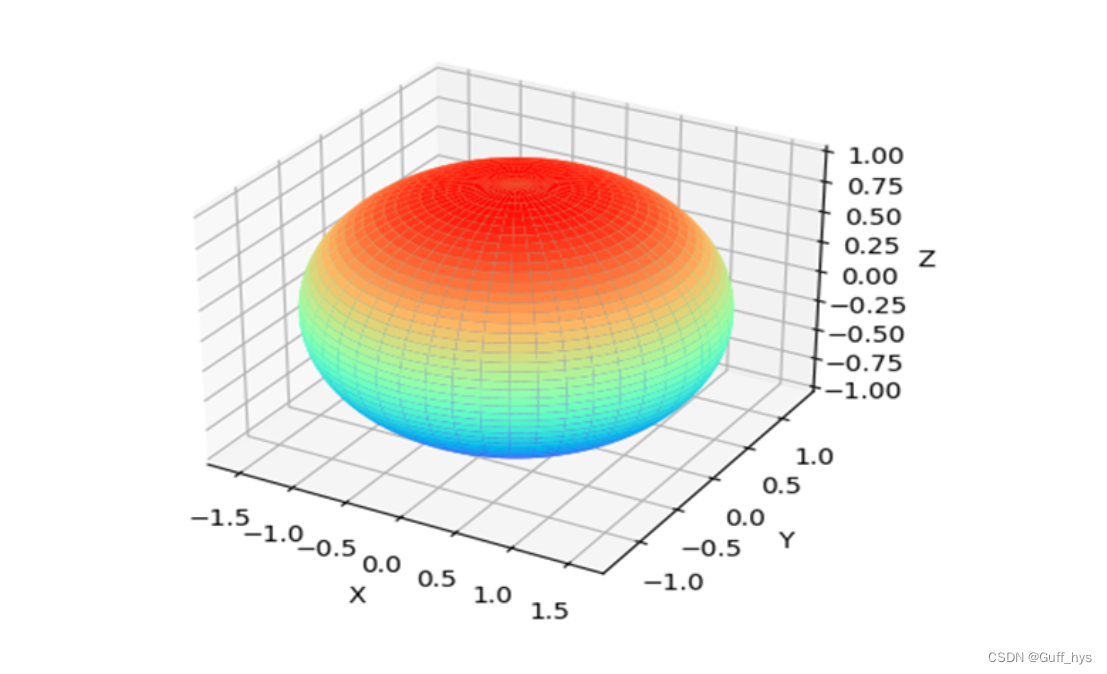
def f(x, y):
return np.sqrt(1-x**2/3-y**2/2)
fig = plt.figure()
ax = fig.add_subplot(111, projection='3d')
x = 60
y = 40
z = f(x, y)
ax.scatter(x, y, z, color='r', s=100) # 绘制特定点
# 绘制曲面
x = np.linspace(-5, 5, 100)
y = np.linspace(-5, 5, 100)
x, y = np.meshgrid(x, y)
z = f(x, y)
ax.plot_surface(x, y, z, cmap='viridis', alpha=0.5)
ax.set_xlabel('X')
ax.set_ylabel('Y')
ax.set_zlabel('Z')
plt.show()
import numpy as np
import matplotlib.pyplot as plt
from mpl_toolkits.mplot3d import Axes3D
# 定义曲面的方程
def f(x, y):
    return np.sqrt(1-x**2/3-y**2/2)
fig = plt.figure()
ax = fig.add_subplot(111, projection='3d')
x = 60
y = 40
z = f(x, y)
ax.scatter(x, y, z, color='r', s=100)  # 绘制特定点
# 绘制曲面
x = np.linspace(-5, 5, 100)
y = np.linspace(-5, 5, 100)
x, y = np.meshgrid(x, y)
z = f(x, y)
ax.plot_surface(x, y, z, cmap='viridis', alpha=0.5)
ax.set_xlabel('X')
ax.set_ylabel('Y')
ax.set_zlabel('Z')
plt.show()


 5572
5572


 被折叠的 条评论
为什么被折叠?
被折叠的 条评论
为什么被折叠?
 到【灌水乐园】发言


