


ROC曲线:受试者工作特征曲线。通常用于评价模型的准确性和确定临界值点的方法。
绘制的图像是TPR(真阳率) 和FPR(假阳率)之间的关系。
AUC:
统计学的意义,在样本中任取一个(正,负)样本对,分类器对前者的输出概率大于后者的比例。 也就是正样本大于等于负样本的比例。
混淆矩阵:
| 预测值 | |||
| 实际值 | 正 | 负 | |
| 正 | TP (真正) | FN (假负) | |
| 负 | FP (假正) | TN (真负) | |
真阳率:TPR=TP / (TP + FN);是指实际为正样本中有多少预测对了
假阳率:FPR=FP / (FP + TN) ;是指负样本中有多少预测错了
精度: TP / (TP +FP)
召回率:TP / (TP +FN)
简单实现例子:
from sklearn.metrics import roc_curve,auc,confusion_matrix
from matplotlib import pyplot as plt
import warnings
warnings.filterwarnings("ignore")

#解决中文乱码的问题:
import matplotlib
matplotlib.rc("font",family="Microsoft YaHei")

label=[1,0,1,1,0] #y_label
score=[0.9,0.5,0.8,0.6,0.4] #y_predict

FPR,TPR,P=roc_curve(label,score) #使用roc_auc曲线返回真阳率、假阳率、阈值;
AUC=auc(FPR,TPR)

#做出 TPR - FPR之间差值;
threshold=[TPR[i]-FPR[i] for i in range(len(P))]
#寻找最佳的域值:
best_threshold=P[threshold.index(max(threshold))] #求出在TPR -FPR最大差下的;P中最优阈值;

#绘制roc_auc的曲线:

plt.plot(FPR,TPR,'b*-',label="ROC曲线,"
                             "最优的阙值是="+str('%.3f'%best_threshold)+","
                             +'AUC='+str('%.3f'%AUC))


#画出参考线:
plt.plot([0,1],[0,1],'r--',label="45度参考线")
plt.legend()

plt.xlabel("FPR")
plt.ylabel("TPR")
plt.show()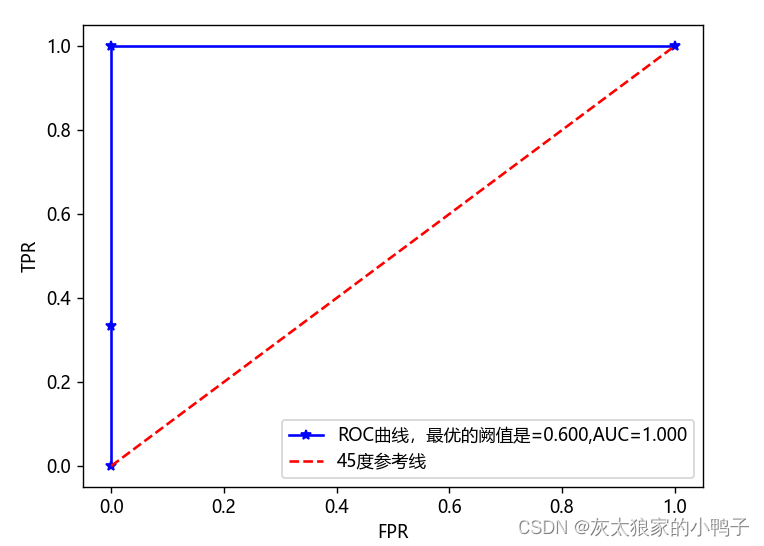
第二个例子:
"""
auc和roc曲线只适用于,进行分类问题的模型评估方法;
"""
from sklearn.datasets import load_breast_cancer
from sklearn.linear_model import LogisticRegression #逻辑回归 ;进行癌症的预测;
from sklearn.model_selection import train_test_split
from sklearn.metrics import roc_auc_score,roc_curve,auc
import warnings
warnings.filterwarnings("ignore")
X,y=load_breast_cancer(return_X_y=True)
x_train,x_test,y_train,y_test=train_test_split(X,y,test_size=0.3)
clf=LogisticRegression(solver="liblinear",random_state=0).fit(x_train,y_train)
"""
roc_auc_score:返回值是auc
"""
auc_value1=roc_auc_score(y_test,clf.predict(x_test)) #y_true, y_predict;
print("auc_value2:",auc_value1)
"""
roc_curve :返回值是FPR,TPR,thresholds
"""
#计算roc曲线:
FPR,TPR,thresholds=roc_curve(y_test,clf.predict(x_test))
#thresholds :阈值;
print(FPR)
print(TPR)
print(thresholds)
auc_value2=auc(FPR,TPR)
print("auc_value2:",auc_value2)
from matplotlib import pyplot as plt
import matplotlib
matplotlib.rc("font",family="Microsoft YaHei")
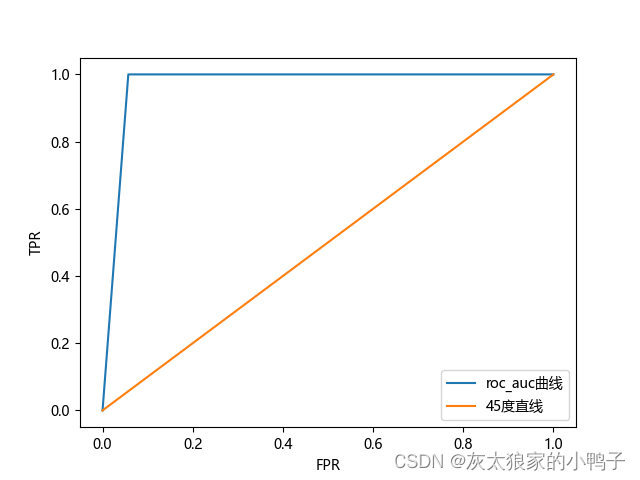
def draw_roc_auc(FPR,TPR,plt):
plt.plot(FPR,TPR,label="roc_auc曲线")
plt.plot([0,1],[0,1],label="45度直线")
plt.xlabel("FPR")
plt.ylabel("TPR")
plt.legend(loc="best")
plt.show()
draw_roc_auc(FPR,TPR,plt)


 3万+
3万+


 被折叠的 条评论
为什么被折叠?
被折叠的 条评论
为什么被折叠?
 到【灌水乐园】发言


