


给定若干个点并采用层次聚类法进行聚类
生成7个点并计算欧氏距离矩阵:
import numpy as np
# 点的坐标
A=[10,20]
B=[13,26]
C=[60,65]
D=[81,73]
E=[89,-20]
F=[73,-22]
G=[102,-28]
#计算欧氏距离矩阵
a=np.array([A,B,C,D,E,F,G])#生成一个点列
result=[np.sqrt((a[i,0]-a[j,0])**2+(a[i,1]-a[j,1])**2)for i in range(a.shape[0]) for j in range(a.shape[0])]#1X49的距离向量
result=np.array(result).reshape(a.shape[0],a.shape[0])
result=result.round(2)
欧氏距离矩阵为:
array([[  0.  ,   6.71,  67.27,  88.6 ,  88.55,  75.72, 102.42],
       [  6.71,   0.  ,  61.07,  82.66,  88.84,  76.84, 102.58],
       [ 67.27,  61.07,   0.  ,  22.47,  89.81,  87.97,  99.32],
       [ 88.6 ,  82.66,  22.47,   0.  ,  93.34,  95.34, 100.22],
       [ 88.55,  88.84,  89.81,  93.34,   0.  ,  16.12,  13.93],
       [ 75.72,  76.84,  87.97,  95.34,  16.12,   0.  ,  29.15],
       [102.42, 102.58,  99.32, 100.22,  13.93,  29.15,   0.  ]])
第一步:把门限值设为10,距离小于10的点认为是一个点
可见0和1号点可以归为一类:(A,B)
第二步:使用 single linkage,计算其他点到(A,B)的距离。更新欧氏距离矩阵
| (A,B) | C | D | E | F | G | |
|---|---|---|---|---|---|---|
| (A,B) | 0 | 61.07 | 82.66 | 88.55 | 75.72 | 102.42 |
| C | 61.07 | 0 | 22.47 | 89.81 | 87.97 | 99.32 |
| D | 82.66 | 22.47 | 0 | 93.34 | 95.34 | 100.22 |
| E | 88.55 | 89.81 | 93.34 | 0 | 16.12 | 13.93 |
| F | 75.72 | 89.97 | 95.34 | 16.12 | 0 | 29.15 |
| G | 102.42 | 99.32 | 100.22 | 13.93 | 29.15 | 0 |
若这次把门限定为30,则(C,D),(E,F,G)可以合并
刚刚用到的 single linkage 是度量点集之间距离的方法之一
两个点集之间距离的方法有三种度量方式:
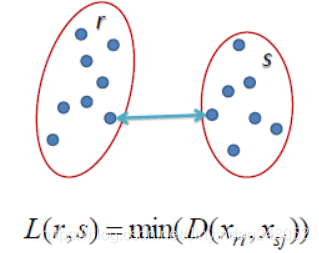
Single Linkage
The distance between two clusters is defined as the shortest distance between two points in each cluster. For example, the distance between clusters “r” and “s” to the left is equal to the length of the arrow between their two closest points.
Complete Linkage
The distance between two clusters is defined as the longest distance between two points in each cluster. For example, the distance between clusters “r” and “s” to the left is equal to the length of the arrow between their two furthest points.

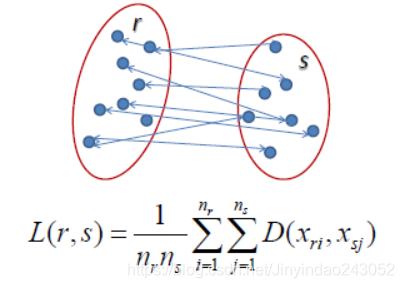
Average Linkage
The distance between two clusters is defined as the average distance between each point in one cluster to every point in the other cluster. For example, the distance between clusters “r” and “s” to the left is equal to the average length each arrow between connecting the points of one cluster to the other.
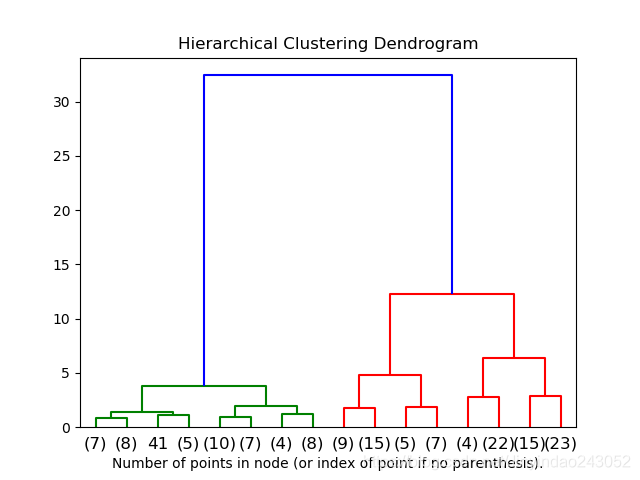
聚类的过程可以用以下的数状结构形象地表示:
It’s possible to visualize the tree representing the hierarchical merging of clusters as a dendrogram. Visual inspection can often be useful for understanding the structure of the data, though more so in the case of small sample sizes.
参考文献:
[1] Hierarchical Clustering
[2] 层次聚类算法的原理及实现Hierarchical Clustering
[3] 官方文档
[4] 机器学习—聚类系列-层次聚类(Hierarchical Clustering)


 1392
1392


 被折叠的 条评论
为什么被折叠?
被折叠的 条评论
为什么被折叠?
 到【灌水乐园】发言


