


 本文详细描述了一个Java项目中,如何通过SpringBoot框架对营业额、用户、订单和销量进行统计,并利用ApacheEcharts进行数据可视化。包括了需求分析、代码实现以及测试过程。
目录
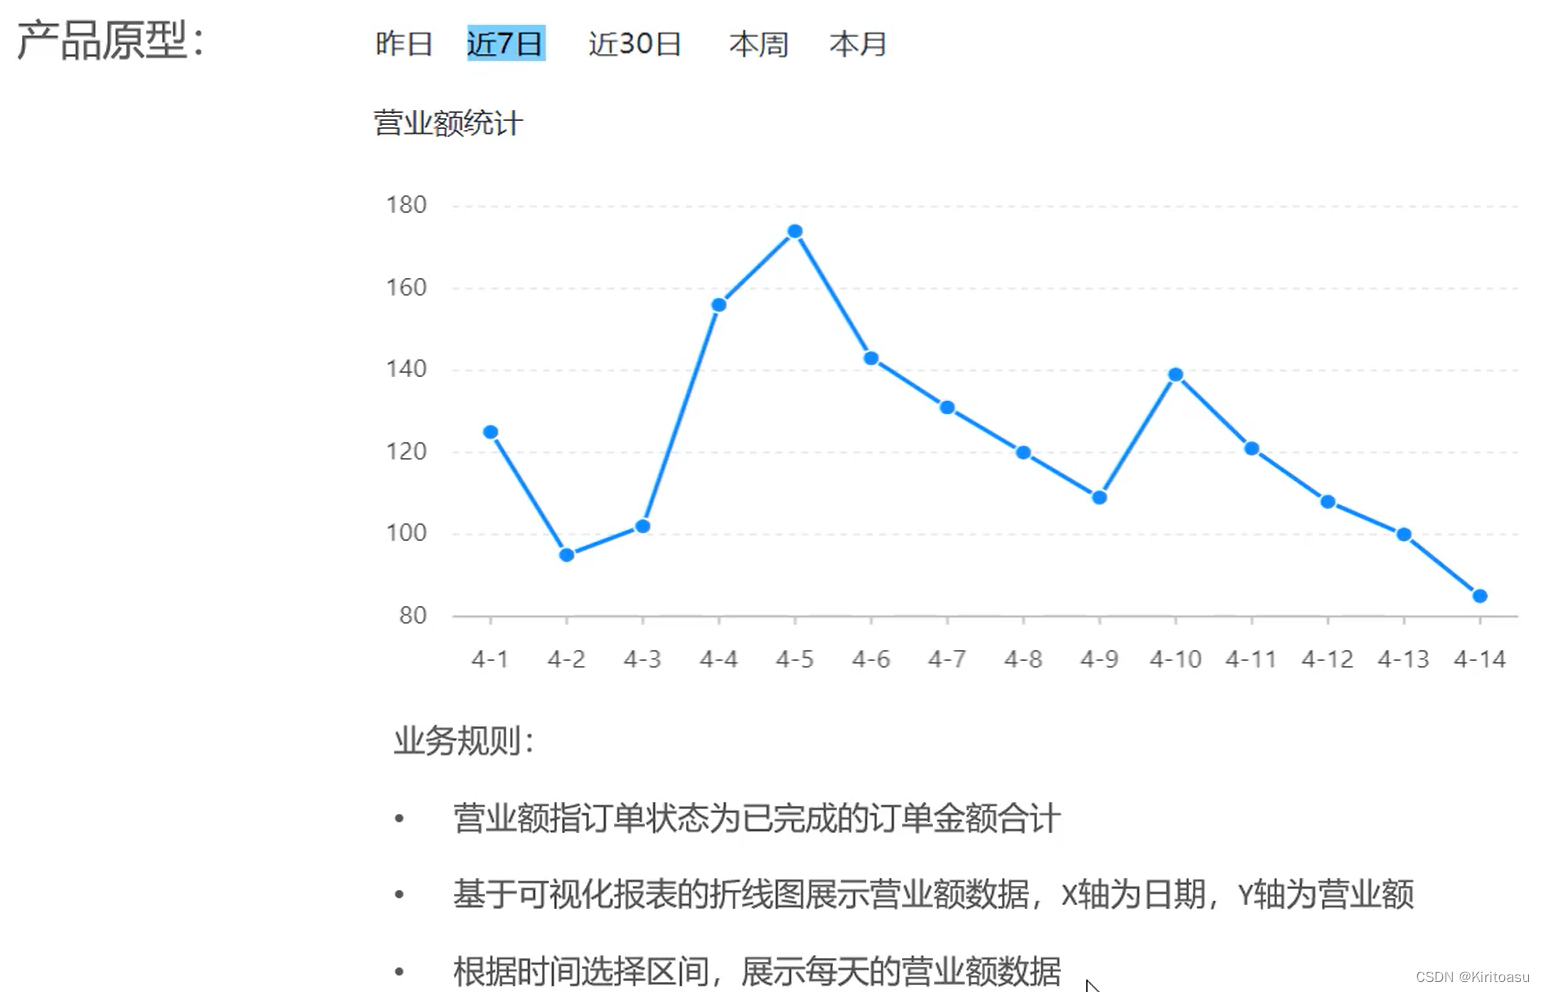
一、营业额统计
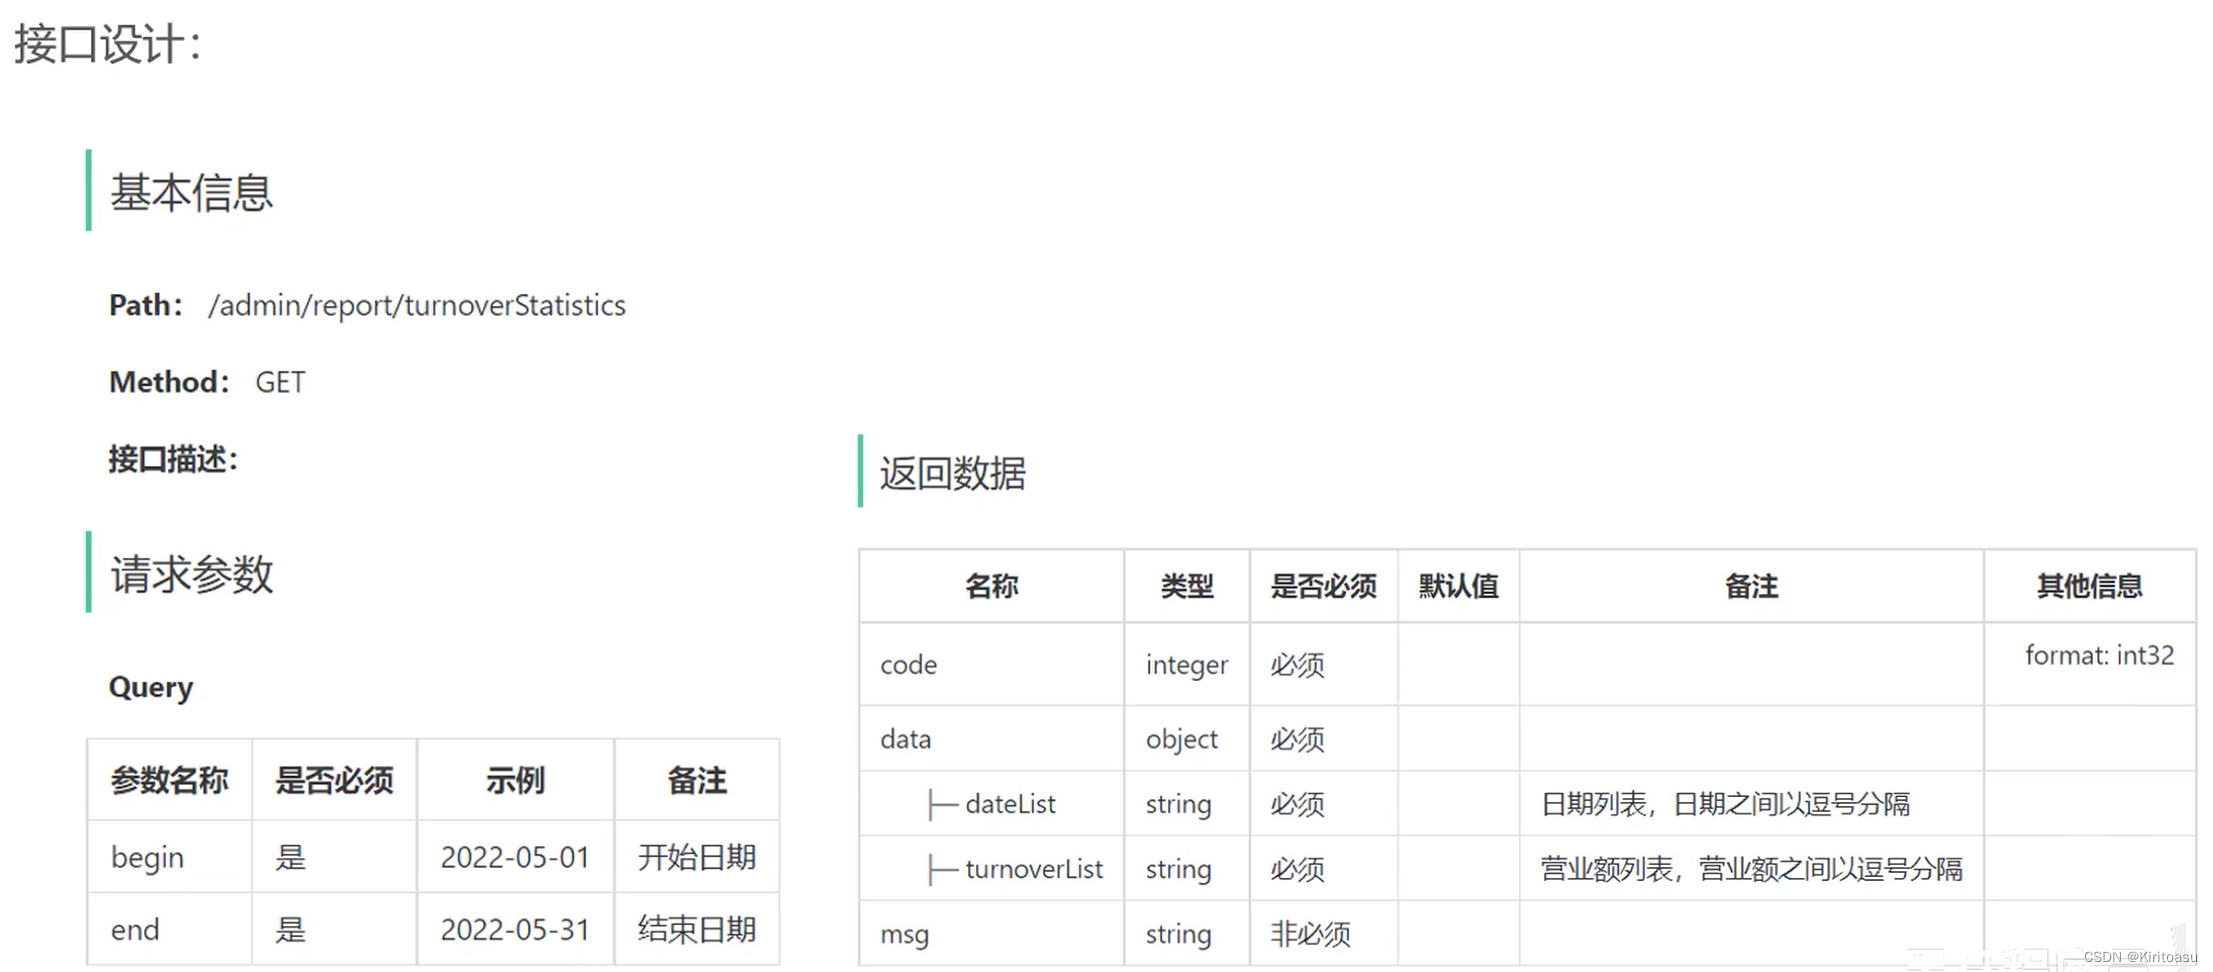
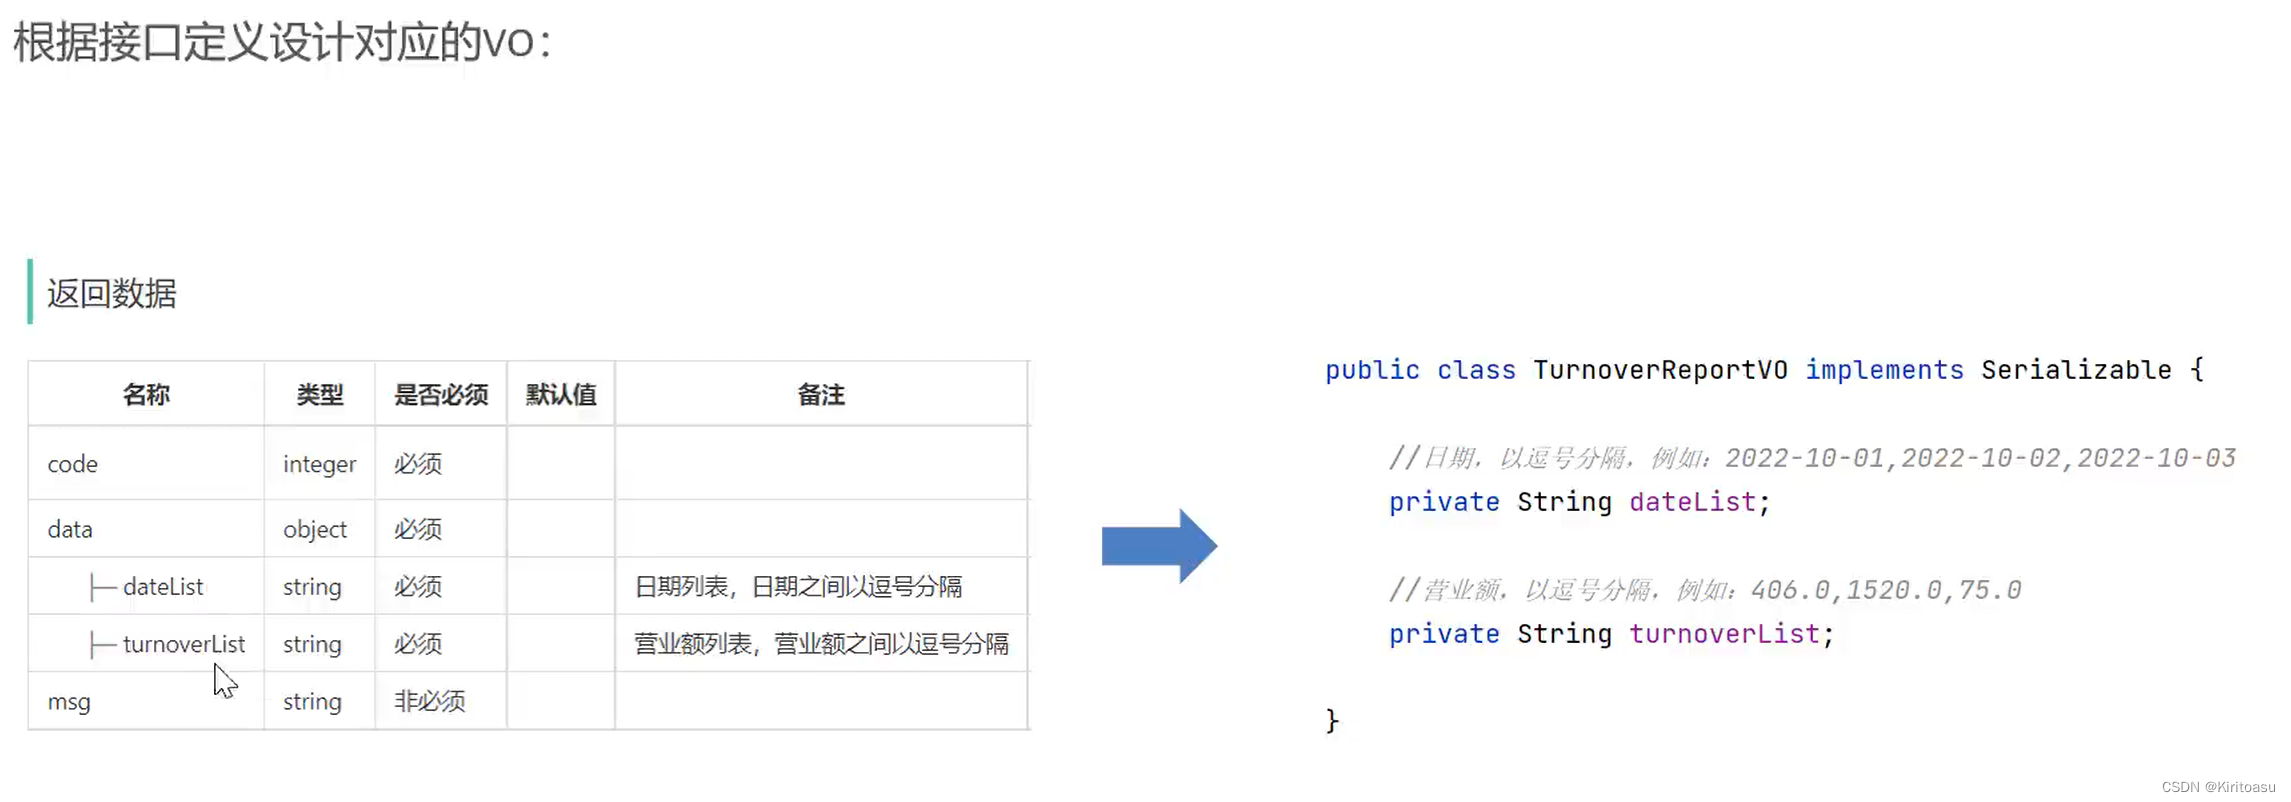
1、需求分析设计
2、代码开发
ReportController:
package com.sky.controller.admin;


import com.sky.result.Result;
import com.sky.service.ReportService;
import com.sky.vo.TurnoverReportVO;
import com.sky.vo.UserReportVO;
import io.swagger.annotations.Api;
import io.swagger.annotations.ApiOperation;
import lombok.extern.slf4j.Slf4j;
import org.springframework.beans.factory.annotation.Autowired;
import org.springframework.format.annotation.DateTimeFormat;
import org.springframework.web.bind.annotation.GetMapping;
import org.springframework.web.bind.annotation.RequestMapping;
import org.springframework.web.bind.annotation.RestController;

import java.time.LocalDate;

/**
 * 数据统计相关接口
 */
@RestController
@RequestMapping("/admin/report")
@Api(tags = "数据统计相关接口")
@Slf4j
public class ReportController {

    @Autowired
    private ReportService reportService;

    /**
     * 营业额统计
     * @param begin
     * @param end
     * @return
     */
    @GetMapping("/turnoverStatistics")
    @ApiOperation("营业额统计")
    public Result<TurnoverReportVO> turnoverStatistics(
            @DateTimeFormat(pattern = "yyyy-MM-dd")LocalDate begin,
            @DateTimeFormat(pattern = "yyyy-MM-dd")LocalDate end){
        return Result.success(reportService.getTurnoverStatistics(begin, end));
    }

}
ReportService:
package com.sky.service;

import com.sky.vo.TurnoverReportVO;
import com.sky.vo.UserReportVO;

import java.time.LocalDate;

public interface ReportService {

    /**
     * 统计指定区间内的营业额数据
     * @param begin
     * @param end
     * @return
     */
    TurnoverReportVO getTurnoverStatistics(LocalDate begin, LocalDate end);
}
ReportServiceImpl:
package com.sky.service.impl;

import com.sky.entity.Orders;
import com.sky.mapper.OrderMapper;
import com.sky.mapper.UserMapper;
import com.sky.service.ReportService;
import com.sky.vo.TurnoverReportVO;
import com.sky.vo.UserReportVO;
import lombok.extern.slf4j.Slf4j;
import org.apache.commons.lang3.StringUtils;
import org.springframework.beans.factory.annotation.Autowired;
import org.springframework.stereotype.Service;

import java.time.LocalDate;
import java.time.LocalDateTime;
import java.time.LocalTime;
import java.util.ArrayList;
import java.util.HashMap;
import java.util.List;
import java.util.Map;


@Service
@Slf4j
public class ReportServiceImpl implements ReportService {

    @Autowired
    private OrderMapper orderMapper;

    @Autowired
    private UserMapper userMapper;

    /**
     * 统计指定时间区间的营业额数据
     * @param begin
     * @param end
     * @return
     */
    @Override
    public TurnoverReportVO getTurnoverStatistics(LocalDate begin, LocalDate end) {
        //当前集合用于存放从begin到end范围内的每天的日期
        List<LocalDate> dateList = new ArrayList<>();
        while (!begin.equals(end.plusDays(1))){
            dateList.add(begin);
            begin = begin.plusDays(1);
        }

        List<Double> turnoverList = new ArrayList<>();
        for(LocalDate date : dateList){
            //查询date日期对应的营业额数据:状态为 已完成 的订单金额合计
            LocalDateTime beginTime = LocalDateTime.of(date, LocalTime.MIN);
            LocalDateTime endTime = LocalDateTime.of(date,LocalTime.MAX);

            Map map = new HashMap();
            map.put("begin",beginTime);
            map.put("end",endTime);
            map.put("status", Orders.COMPLETED);
            Double turnover = orderMapper.sumByMap(map);
            turnover = turnover == null ? 0.0 : turnover;
            turnoverList.add(turnover);
        }

        return TurnoverReportVO
                .builder()
                .dateList(StringUtils.join(dateList, ","))
                .turnoverList(StringUtils.join(turnoverList,","))
                .build();
    }
}
OrderMapper:
    /**
     * 根据动态条件统计营业额数据
     * @param map
     * @return
     */
    Double sumByMap(Map map);
OrderMapper.XML:
<select id="sumByMap" resultType="java.lang.Double">
select sum(amount) from orders
<where>
<if test="begin != null">
and order_time > #{begin}
</if>
<if test="end != null">
and order_time < #{end}
</if>
<if test="status != null">
and status = #{status}
</if>
</where>
</select>
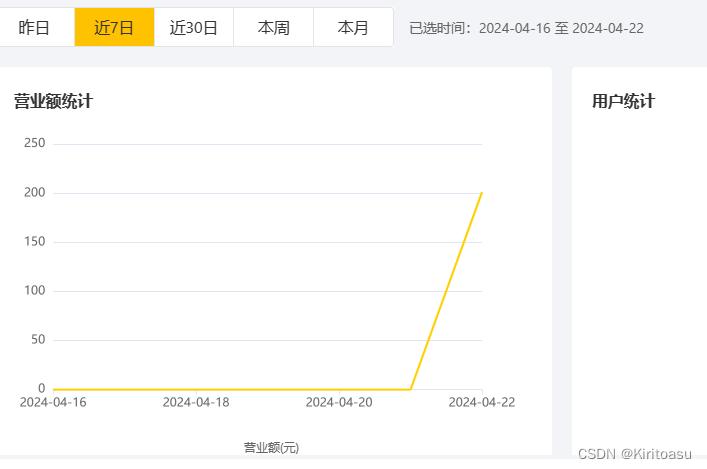
3、测试
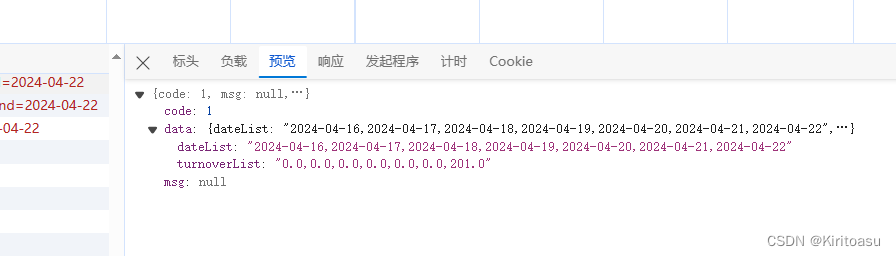
查看7日营业额
查看返回值
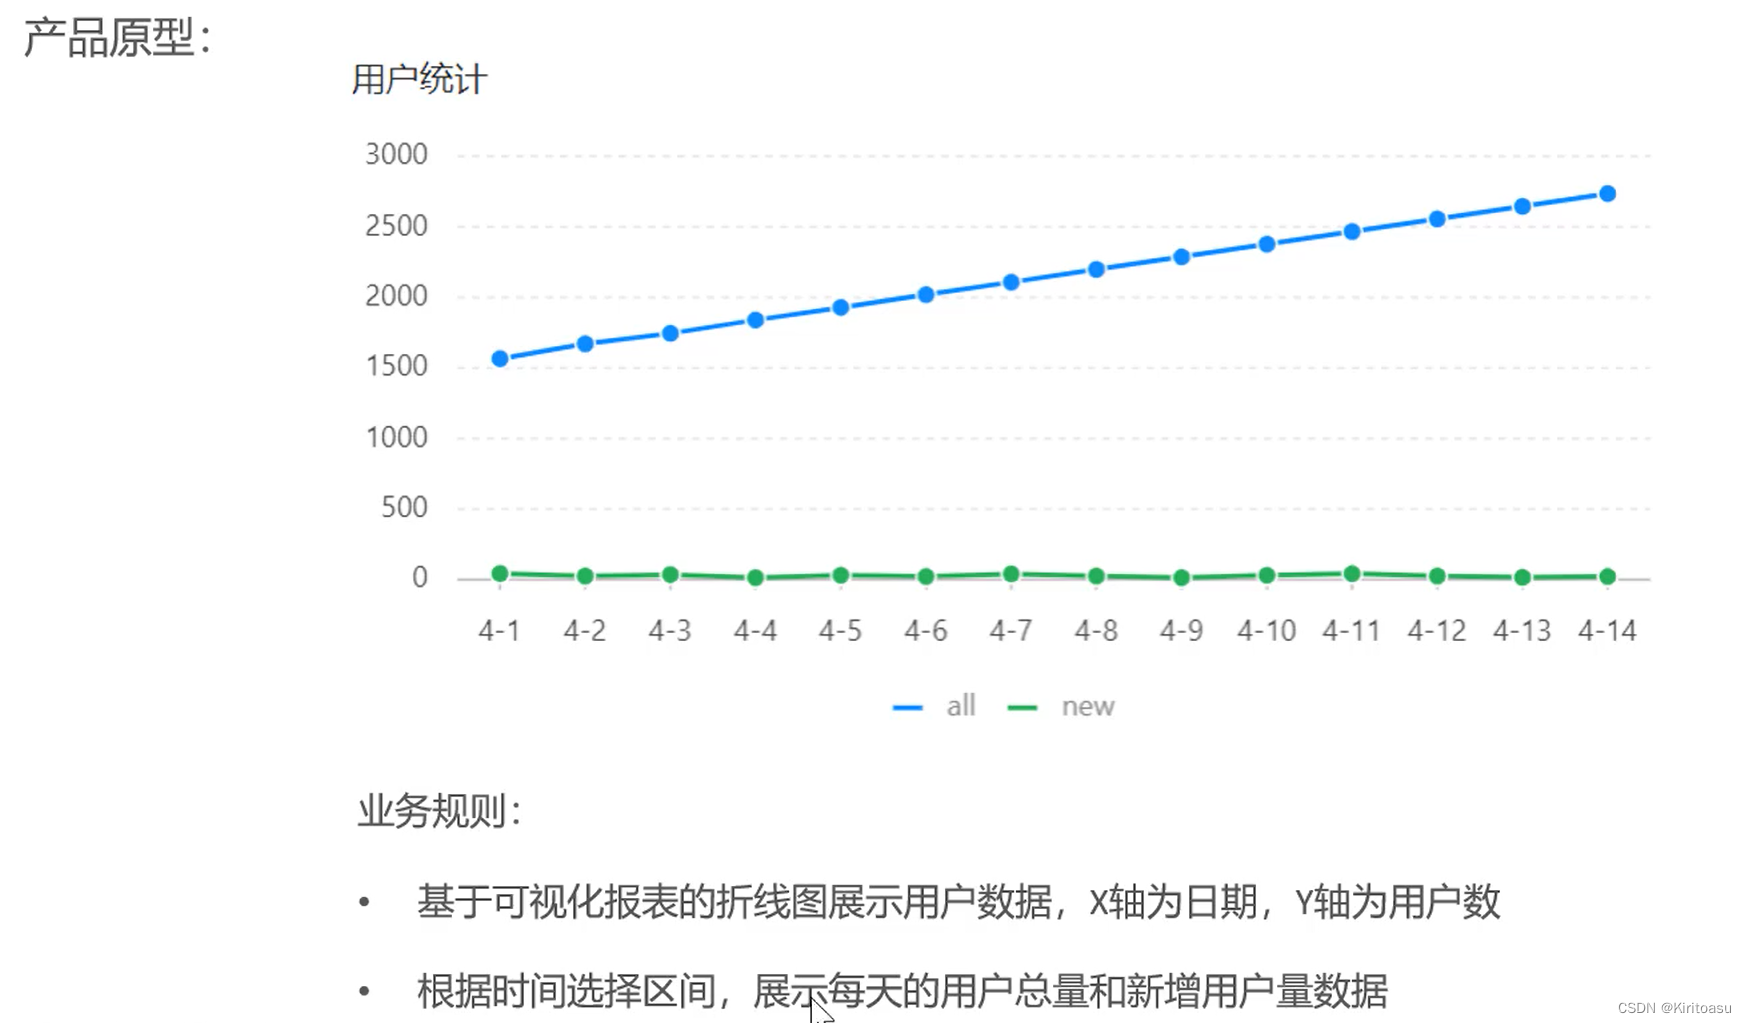
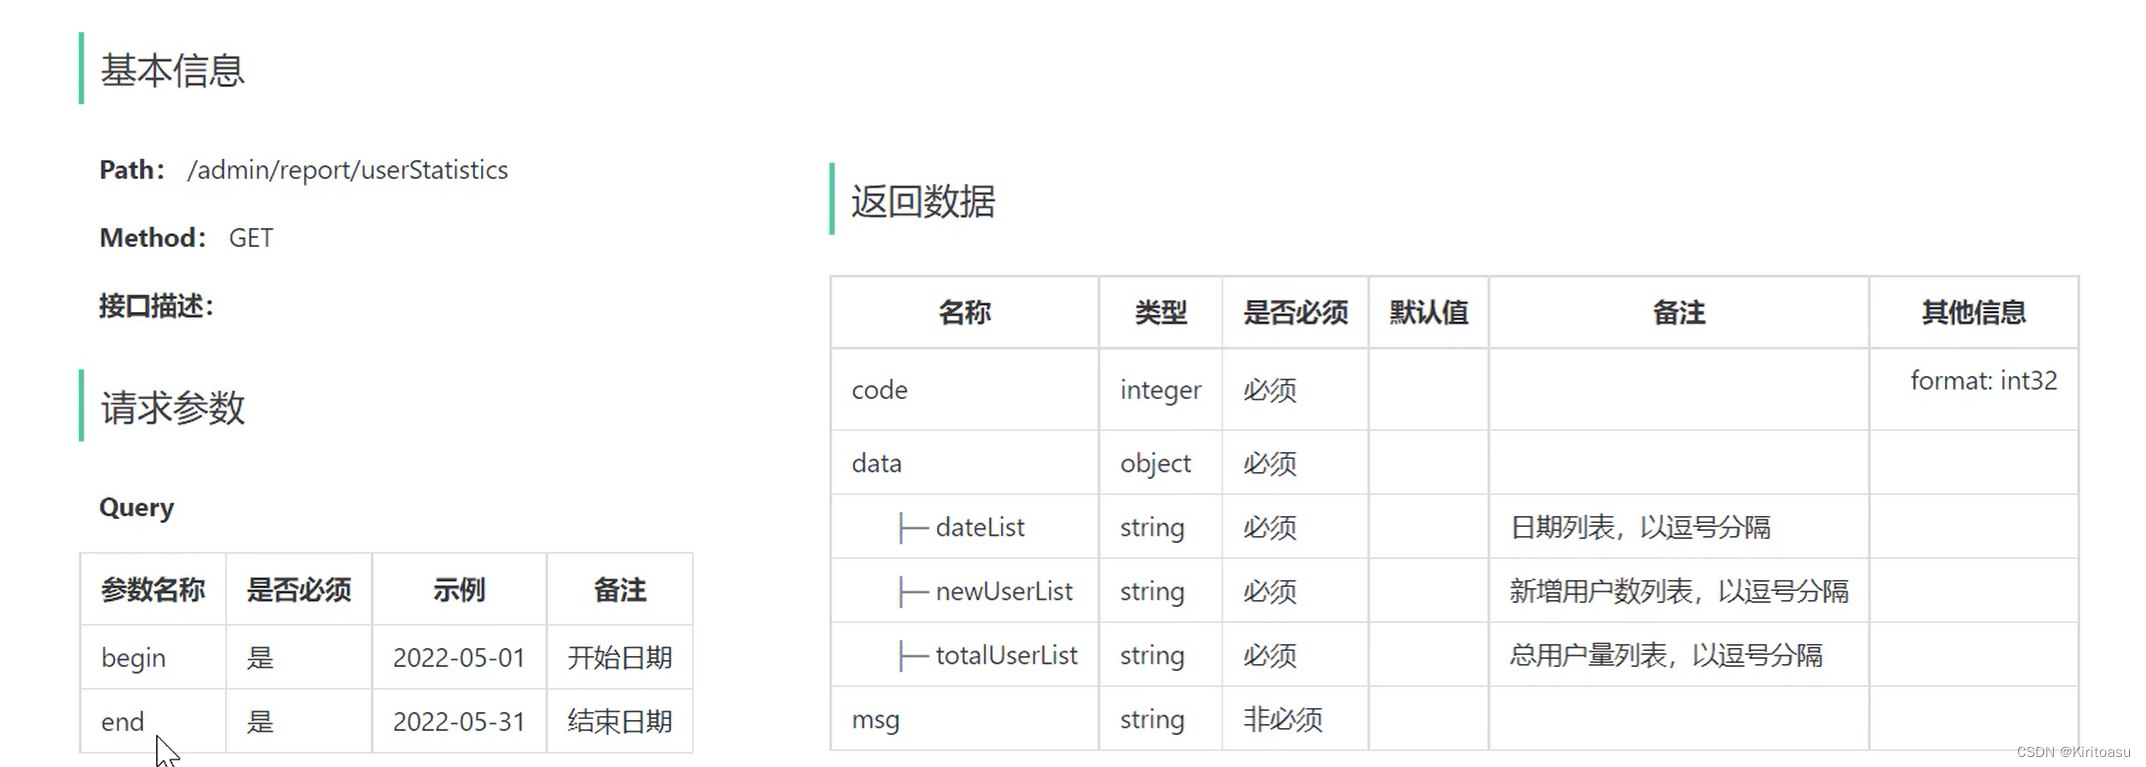
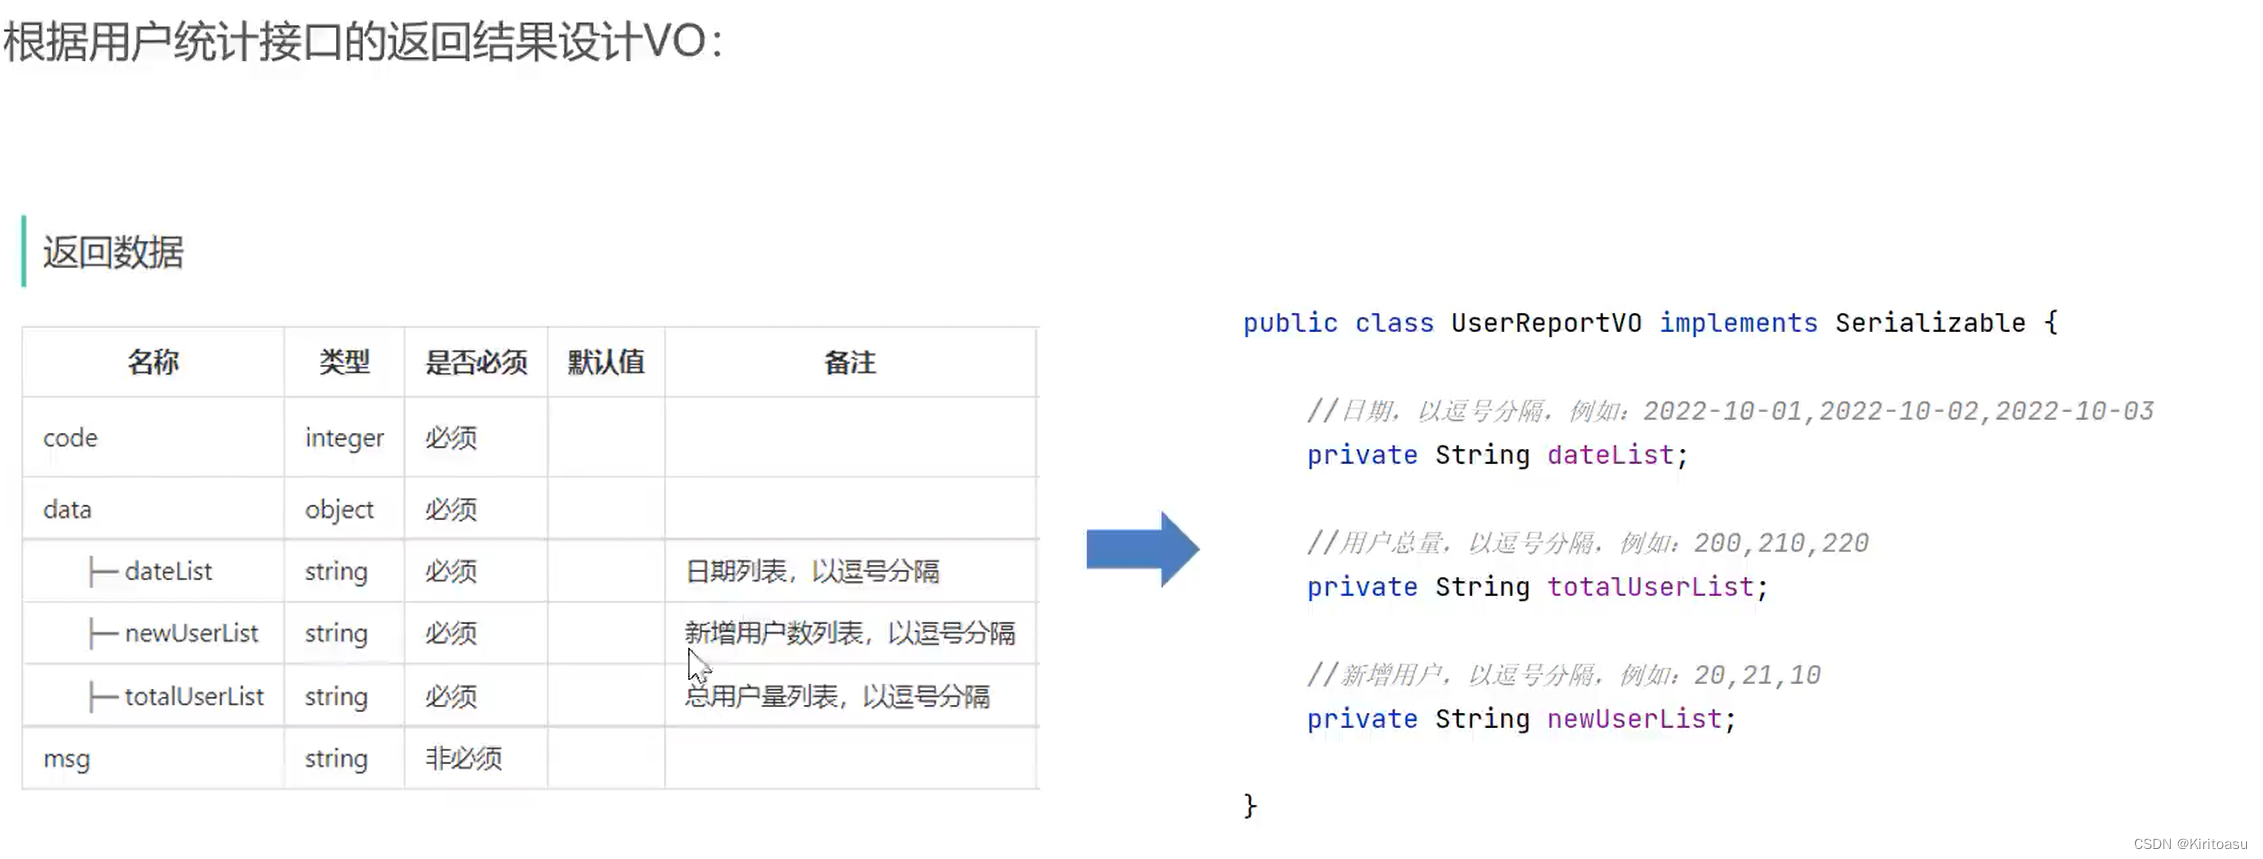
二、用户统计
1、需求分析设计
2、代码开发
ReportController:
    /**
     * 用户统计
     * @param begin
     * @param end
     * @return
     */
    @GetMapping("/userStatistics")
    @ApiOperation("用户统计")
    public Result<UserReportVO> userStatistics(
            @DateTimeFormat(pattern = "yyyy-MM-dd")LocalDate begin,
            @DateTimeFormat(pattern = "yyyy-MM-dd")LocalDate end){
        return Result.success(reportService.getUserStatistics(begin, end));
    }
ReportService:
    /**
     * 统计指定区间内的用户数据
     * @param begin
     * @param end
     * @return
     */
    UserReportVO getUserStatistics(LocalDate begin, LocalDate end);
ReportServiceImpl:
    /**
     * 营业额统计
     * @param begin
     * @param end
     * @return
     */
    @Override
    public UserReportVO getUserStatistics(LocalDate begin, LocalDate end) {
        //当前集合用于存放从begin到end范围内的每天的日期
        List<LocalDate> dateList = new ArrayList<>();
        while (!begin.equals(end.plusDays(1))){
            dateList.add(begin);
            begin = begin.plusDays(1);
        }
        //每天新增的用户量
        List<Integer> newUserList = new ArrayList<>();
        //每天的总用户量
        List<Integer> totalUserList = new ArrayList<>();

        for(LocalDate date : dateList){
            //查询date日期对应的营业额数据:状态为 已完成 的订单金额合计
            LocalDateTime beginTime = LocalDateTime.of(date, LocalTime.MIN);
            LocalDateTime endTime = LocalDateTime.of(date,LocalTime.MAX);
            Map map = new HashMap();
            map.put("end",endTime);
            //总用户数量
            Integer totalUser = userMapper.countByMap(map);
            map.put("begin",beginTime);
            //新增的用户数量
            Integer newUser = userMapper.countByMap(map);
            totalUserList.add(totalUser);
            newUserList.add(newUser);
        }


        return UserReportVO.builder()
                .dateList(StringUtils.join(dateList, ","))
                .newUserList(StringUtils.join(newUserList, ","))
                .totalUserList(StringUtils.join(totalUserList, ","))
                .build();
    }
UserMapper:
    /**
     * 根据动态条件查询用户数量
     * @param map
     * @return
     */
    Integer countByMap(Map map);
UserMapper.XML:
<select id="countByMap" resultType="java.lang.Integer">
select count(id) from user
<where>
<if test="begin != null">
and create_time > #{begin}
</if>
<if test="end != null">
and create_time < #{end}
</if>
</where>
</select>
3、测试
查看近七日的用户数据
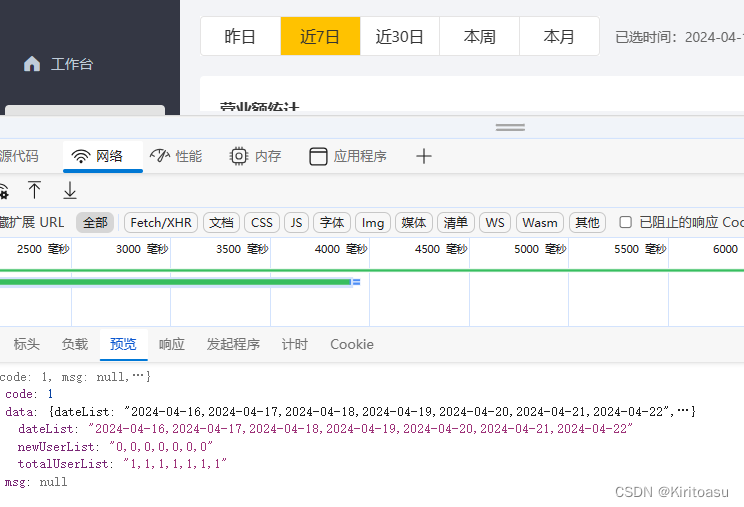
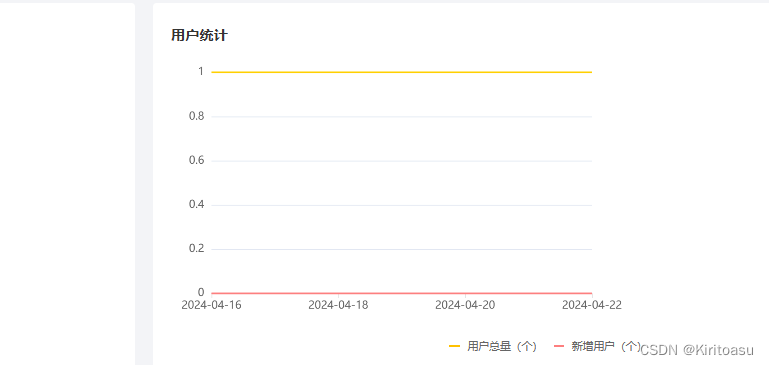
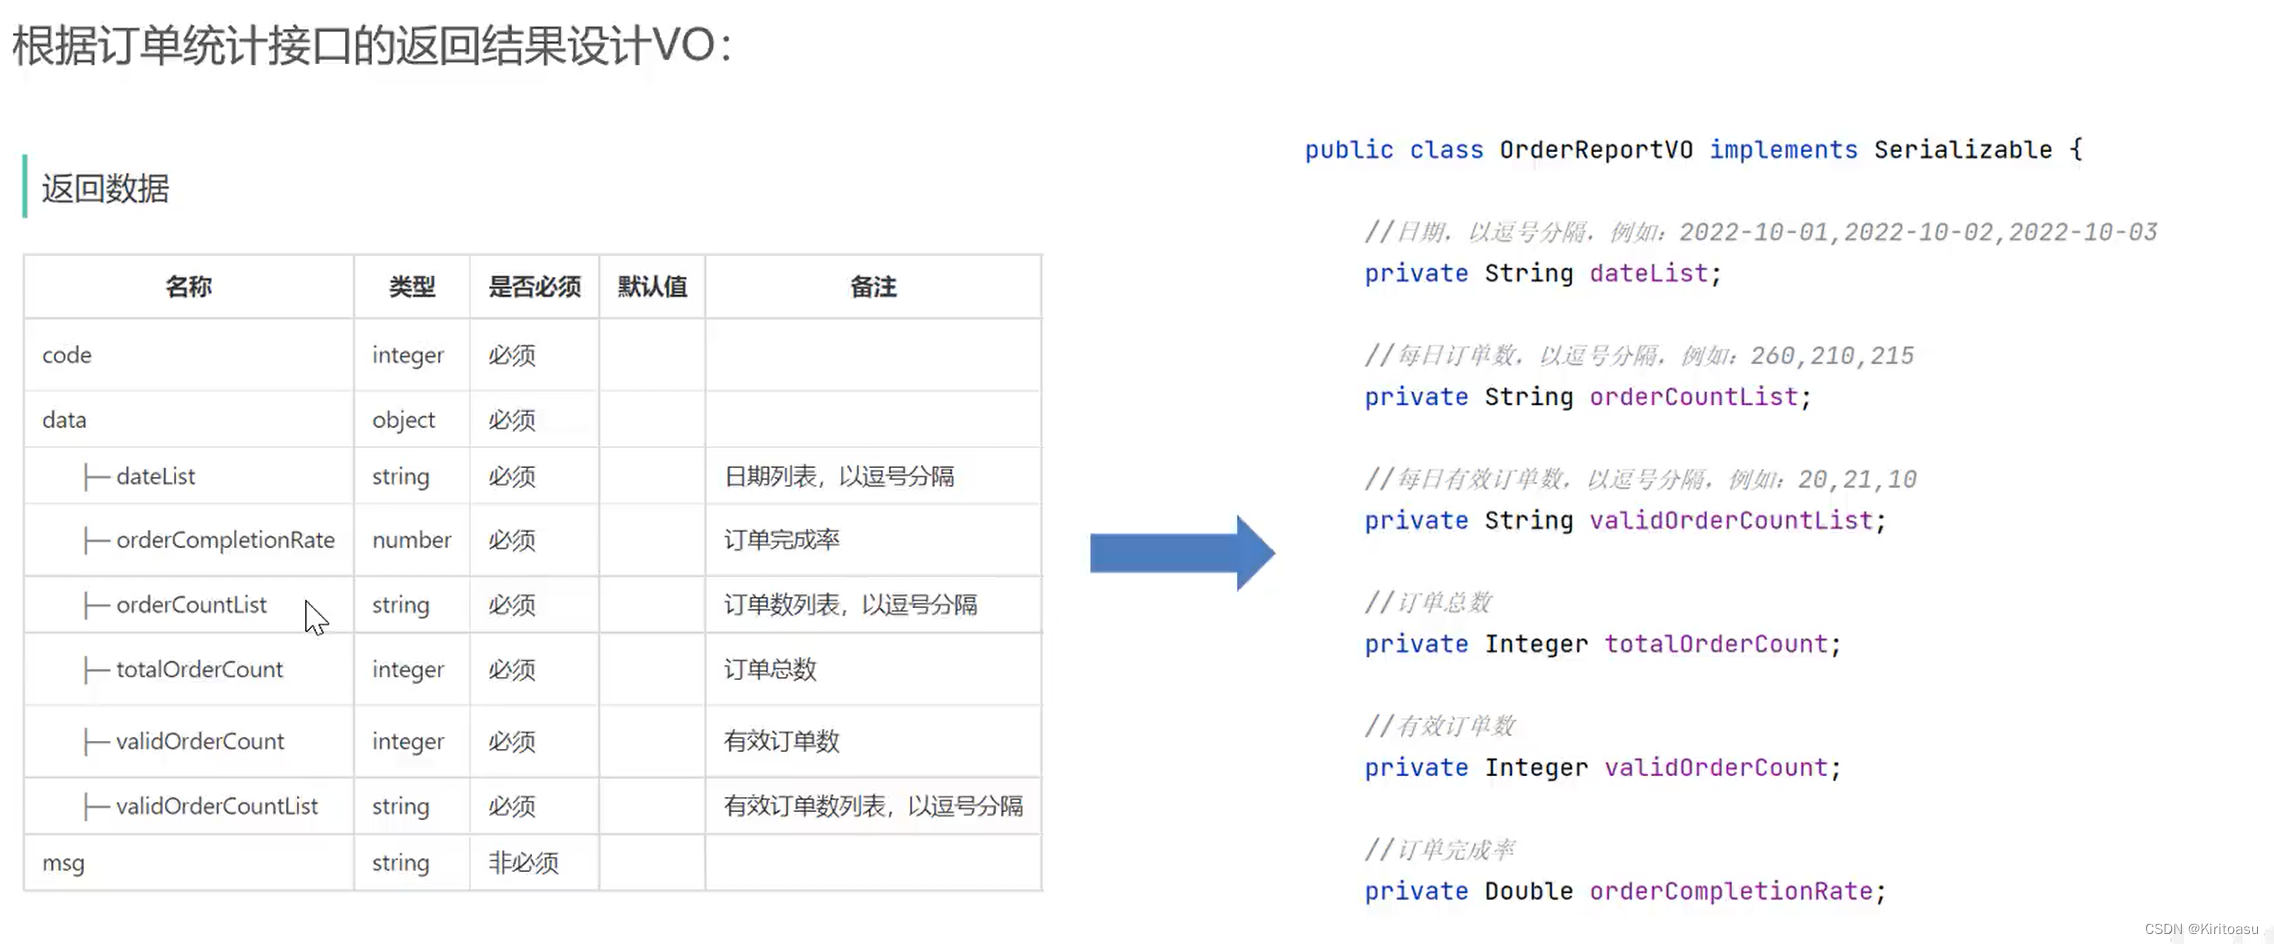
三、订单统计
1、需求设计分析
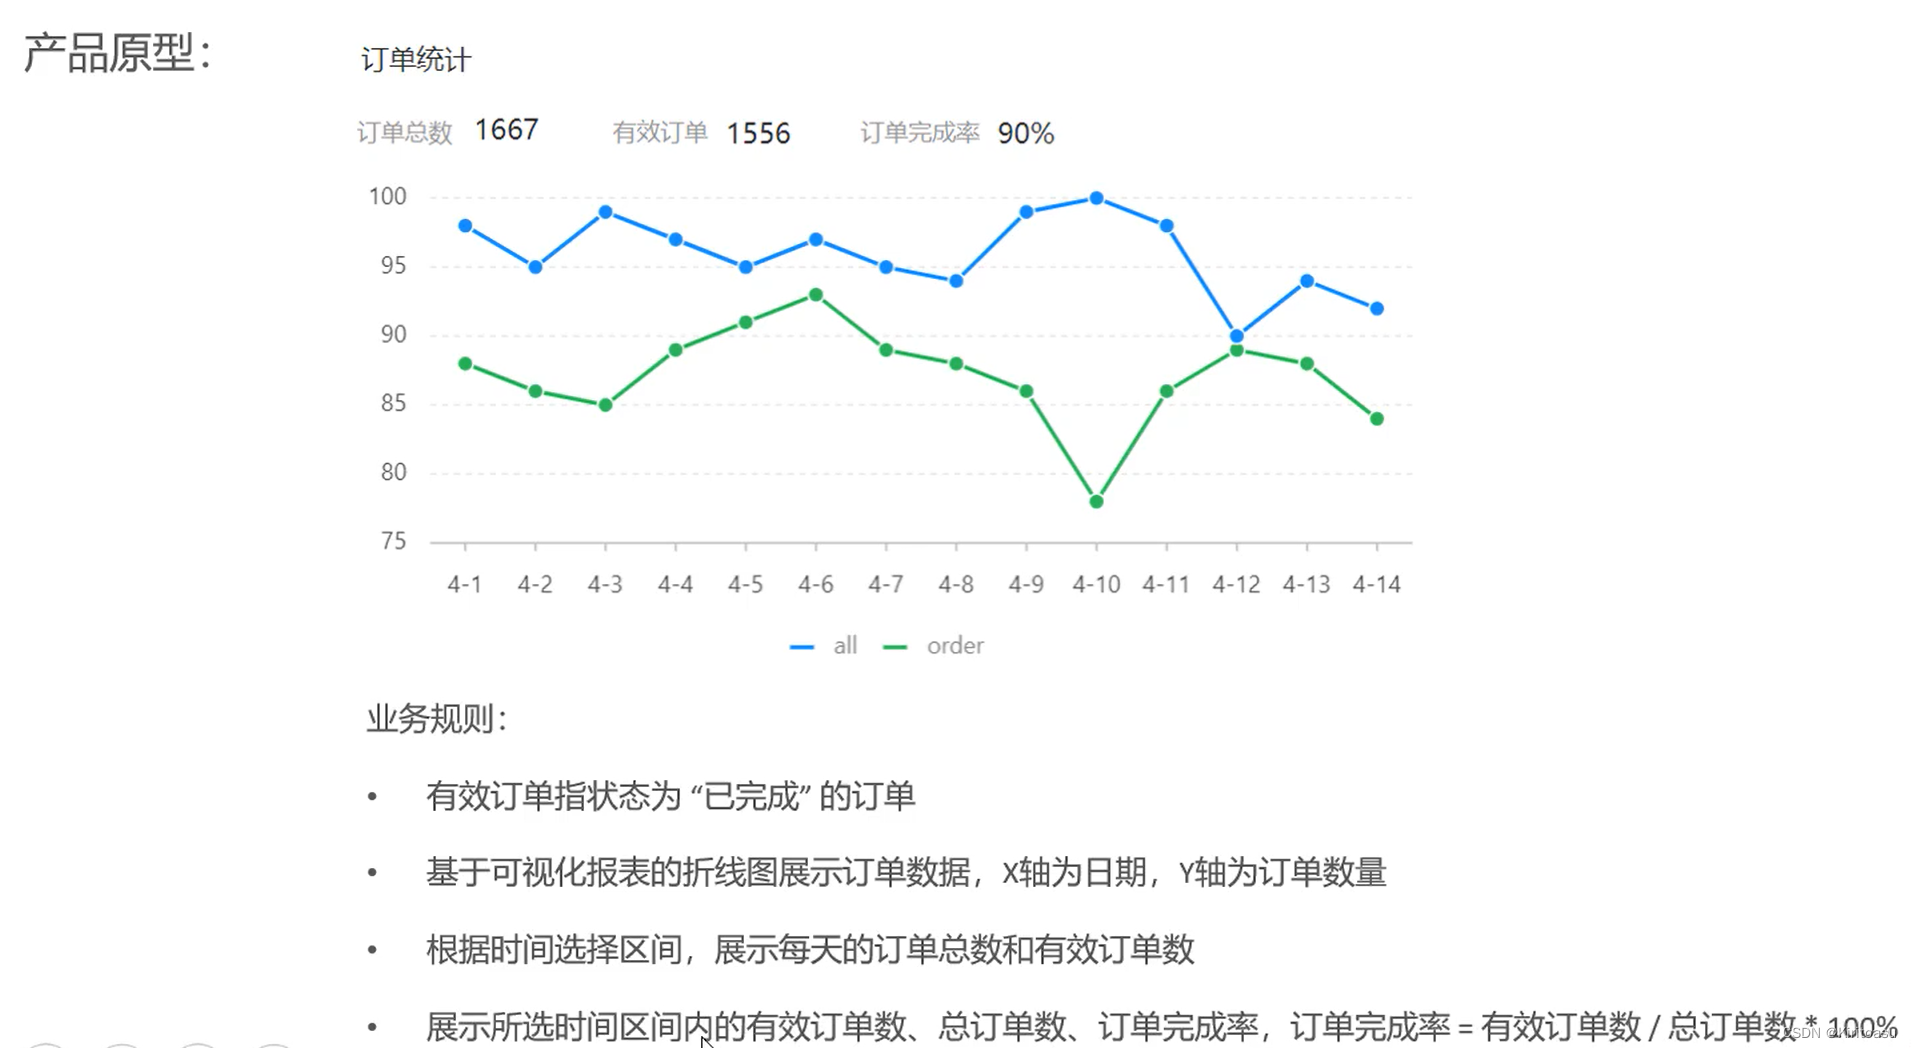
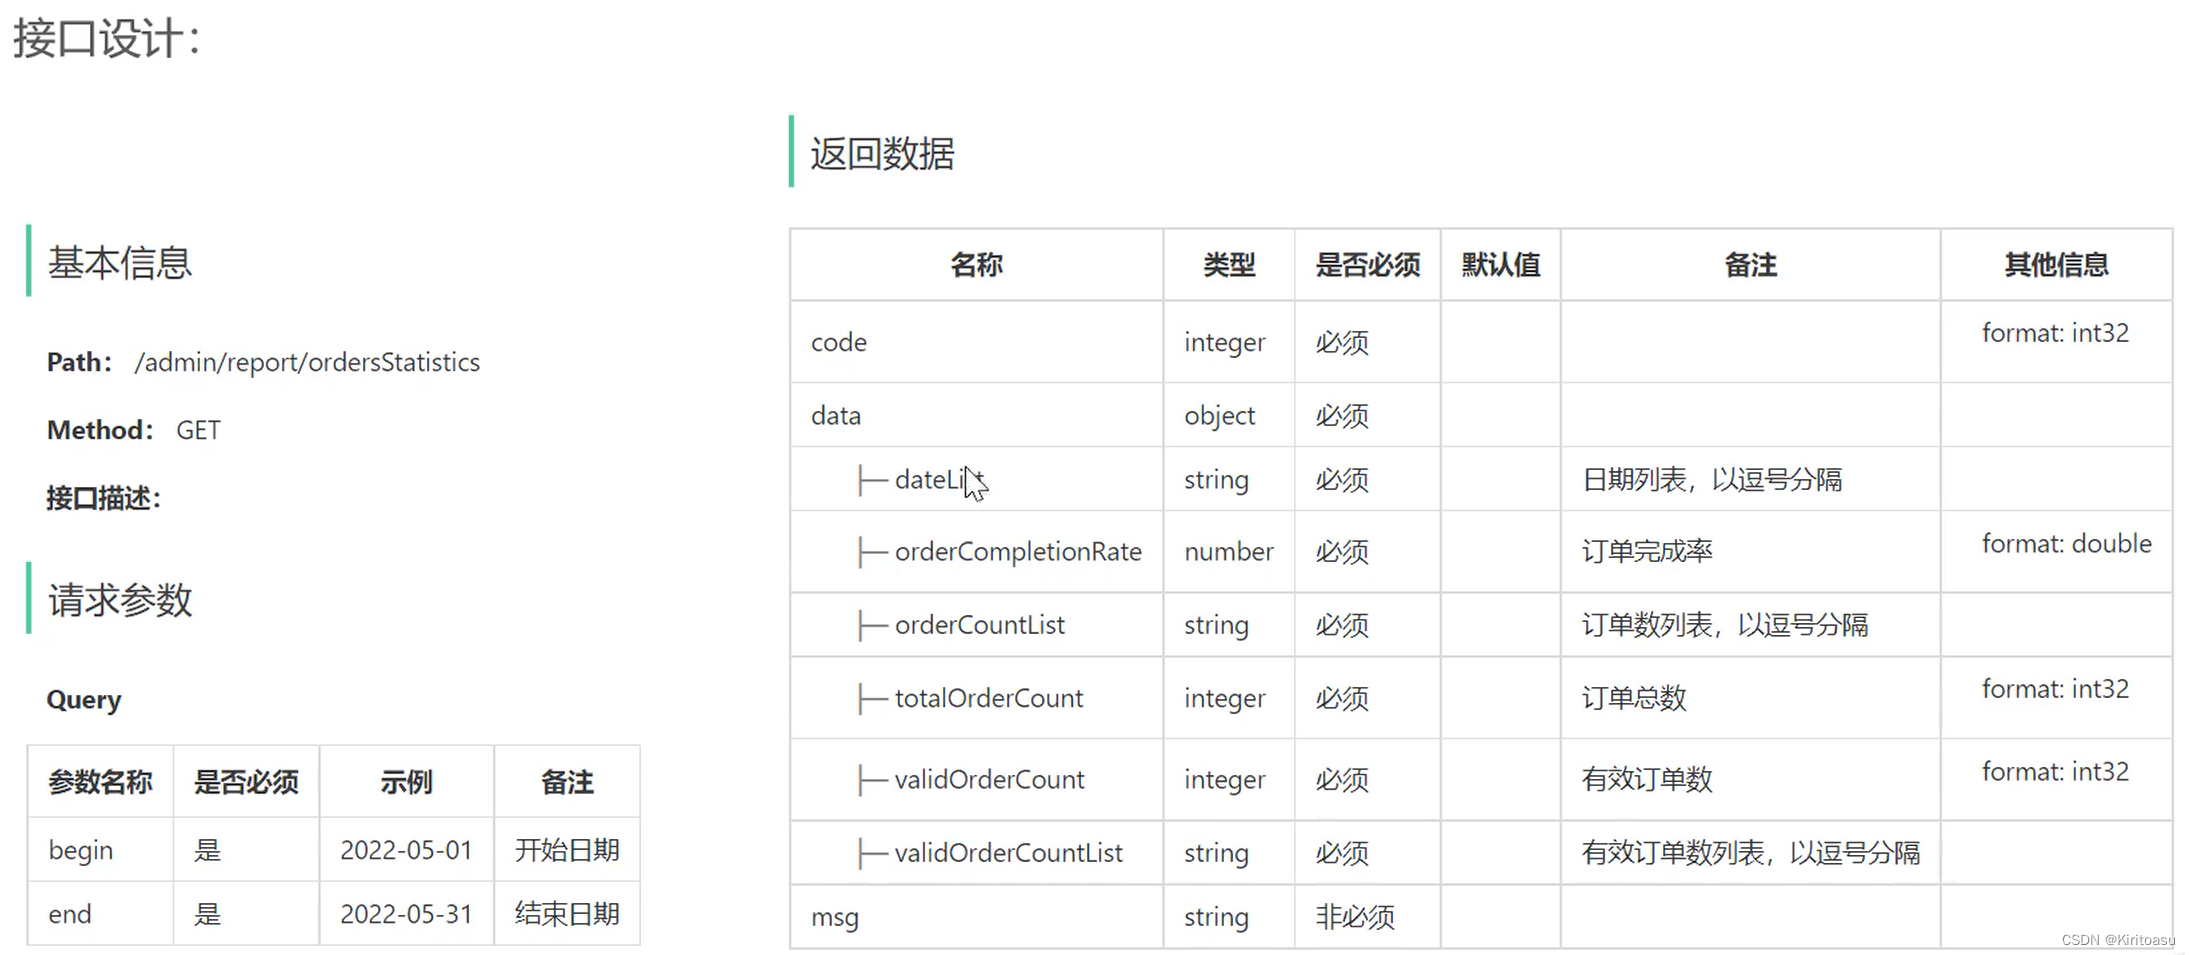
2、代码开发
ReportController:
    /**
     * 订单统计
     * @param begin
     * @param end
     * @return
     */
    @GetMapping("/ordersStatistics")
    @ApiOperation("订单统计")
    public Result<OrderReportVO> ordersStatistics(
            @DateTimeFormat(pattern = "yyyy-MM-dd")LocalDate begin,
            @DateTimeFormat(pattern = "yyyy-MM-dd")LocalDate end){
        return Result.success(reportService.getOrdersStatistics(begin, end));
    }
ReportService:
    /**
     * 统计指定区间内的订单数据
     * @param begin
     * @param end
     * @return
     */
    OrderReportVO getOrdersStatistics(LocalDate begin, LocalDate end);
ReportServiceImpl:
    /**
     * 订单统计
     * @param begin
     * @param end
     * @return
     */
    @Override
    public OrderReportVO getOrdersStatistics(LocalDate begin, LocalDate end) {
        //当前集合用于存放从begin到end范围内的每天的日期
        List<LocalDate> dateList = new ArrayList<>();
        while (!begin.equals(end.plusDays(1))){
            dateList.add(begin);
            begin = begin.plusDays(1);
        }
        //每日有效订单数
        List<Integer> validOrderCountList = new ArrayList<>();
        //每日订单数
        List<Integer> orderCountList = new ArrayList<>();

        for(LocalDate date : dateList){
            //查询date日期对应的营业额数据:状态为 已完成 的订单金额合计
            LocalDateTime beginTime = LocalDateTime.of(date, LocalTime.MIN);
            LocalDateTime endTime = LocalDateTime.of(date,LocalTime.MAX);
            Map map = new HashMap();
            map.put("end",endTime);
            map.put("begin",beginTime);
            //订单总数
            Integer orderCount = orderMapper.countByMap(map);
            map.put("status", Orders.COMPLETED);
            //有效订单
            Integer validOrderCount = orderMapper.countByMap(map);
            validOrderCountList.add(validOrderCount);
            orderCountList.add(orderCount);
        }

        //计算时间区间中的订单总数量
        Integer totalOrderCount = orderCountList.stream().reduce(Integer::sum).get();
        //计算时间区间内的有效订单数量
        Integer validOrderCount = validOrderCountList.stream().reduce(Integer::sum).get();

        Double orderComletionRate = 0.0;
        if(totalOrderCount != 0){
            //计算完成率
            orderComletionRate = validOrderCount.doubleValue() / totalOrderCount;
        }

        return OrderReportVO.builder()
                .dateList(StringUtils.join(dateList, ","))
                .validOrderCountList(StringUtils.join(validOrderCountList, ","))
                .orderCountList(StringUtils.join(orderCountList, ","))
                .validOrderCount(validOrderCount)
                .totalOrderCount(totalOrderCount)
                .orderCompletionRate(orderComletionRate)
                .build();
    }
UserMapper:
    /**
     * 根据同态条件统计订单数量
     * @param map
     * @return
     */
    Integer countByMap(Map map);
UserMapper.XML:
<select id="countByMap" resultType="java.lang.Integer">
select count(id) from orders
<where>
<if test="begin != null">
and order_time > #{begin}
</if>
<if test="end != null">
and order_time < #{end}
</if>
<if test="status != null">
and status = #{status}
</if>
</where>
</select>
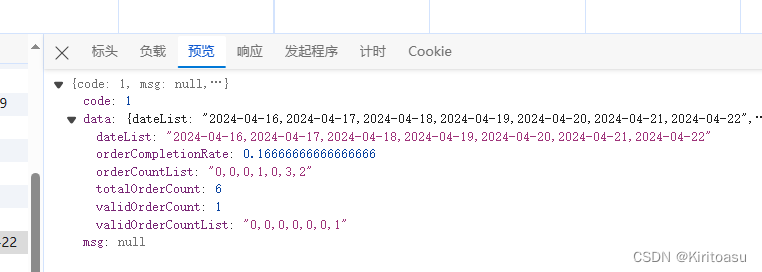
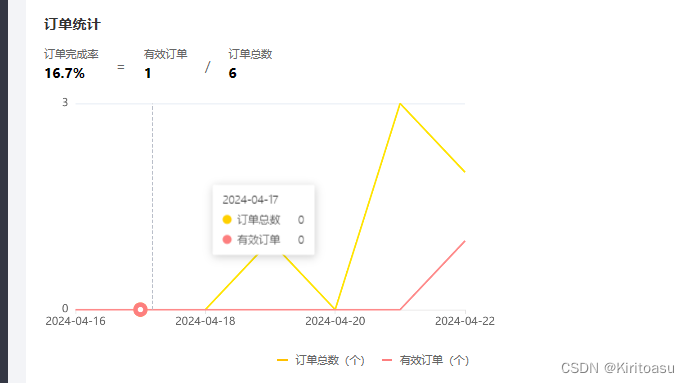
3、测试
近七日订单数据
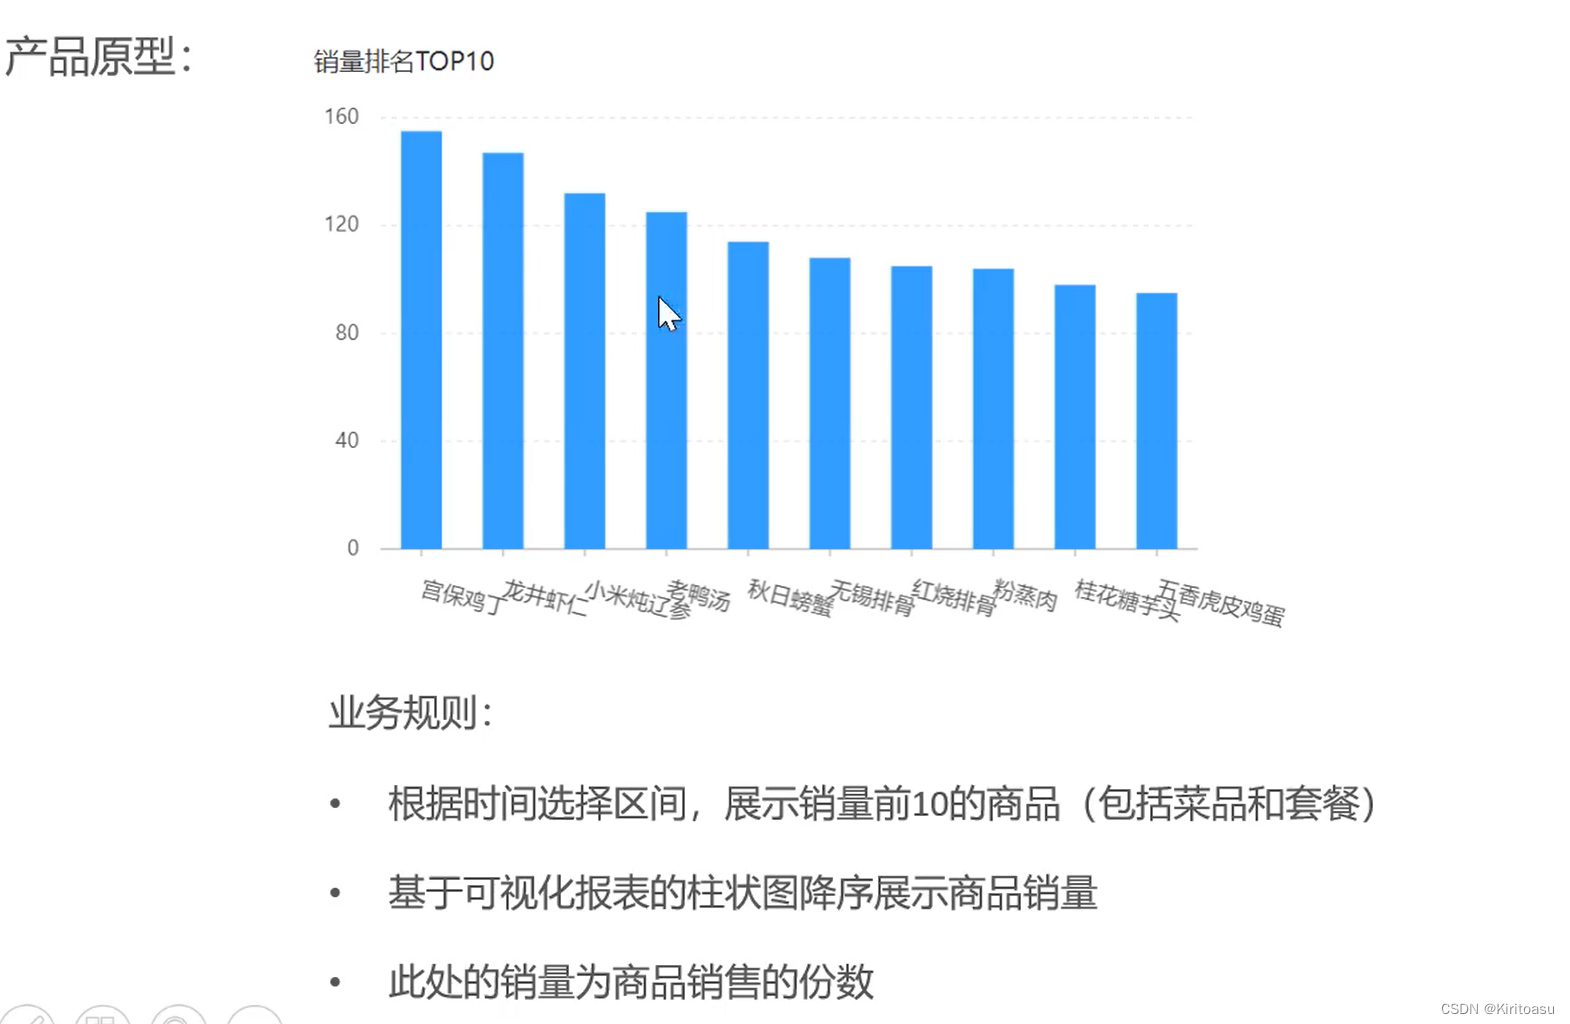
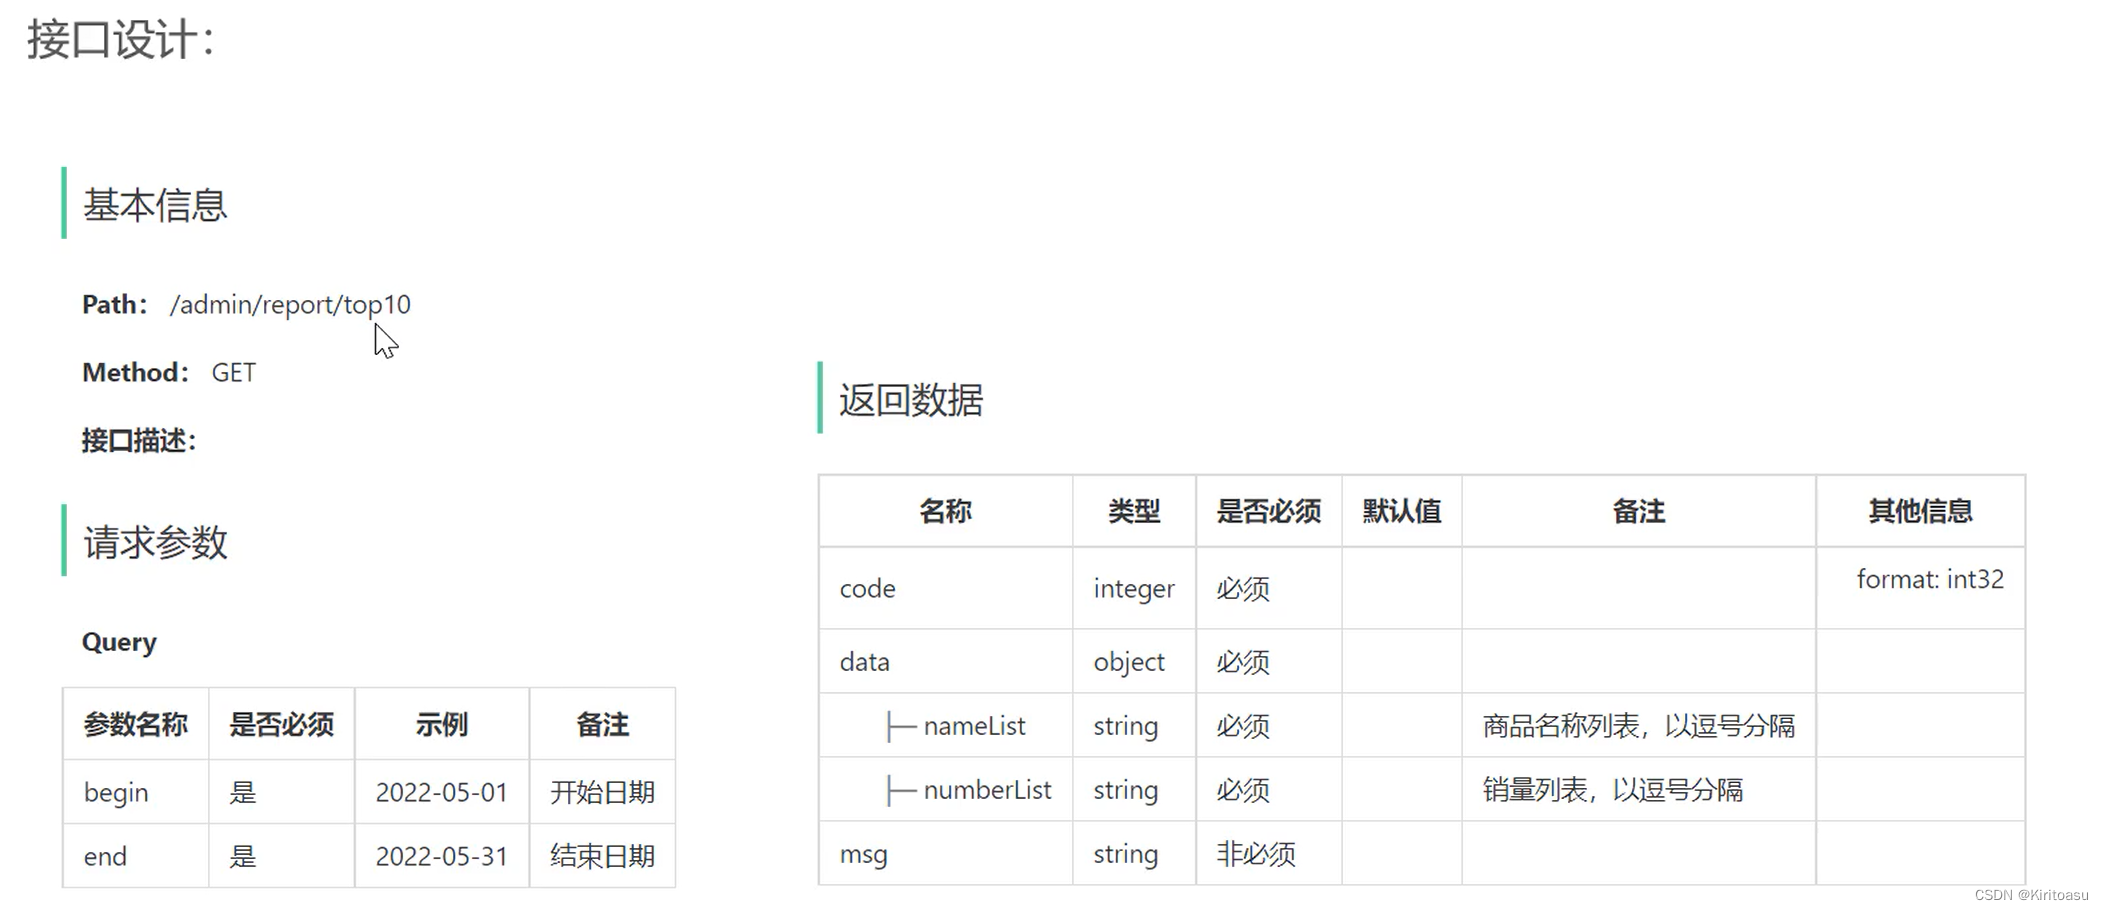
四、销量排名TOP10
1、需求分析设计
2、代码分析
ReportController:
    /**
     * 销量统计
     * @param begin
     * @param end
     * @return
     */
    @GetMapping("/top10")
    @ApiOperation("销量排名top10")
    public Result<SalesTop10ReportVO> top10(
            @DateTimeFormat(pattern = "yyyy-MM-dd")LocalDate begin,
            @DateTimeFormat(pattern = "yyyy-MM-dd")LocalDate end){
        return Result.success(reportService.getTop10(begin, end));
    }
ReportService
    /**
     * 销量统计
     * @param begin
     * @param end
     * @return
     */
    SalesTop10ReportVO getTop10(LocalDate begin, LocalDate end);
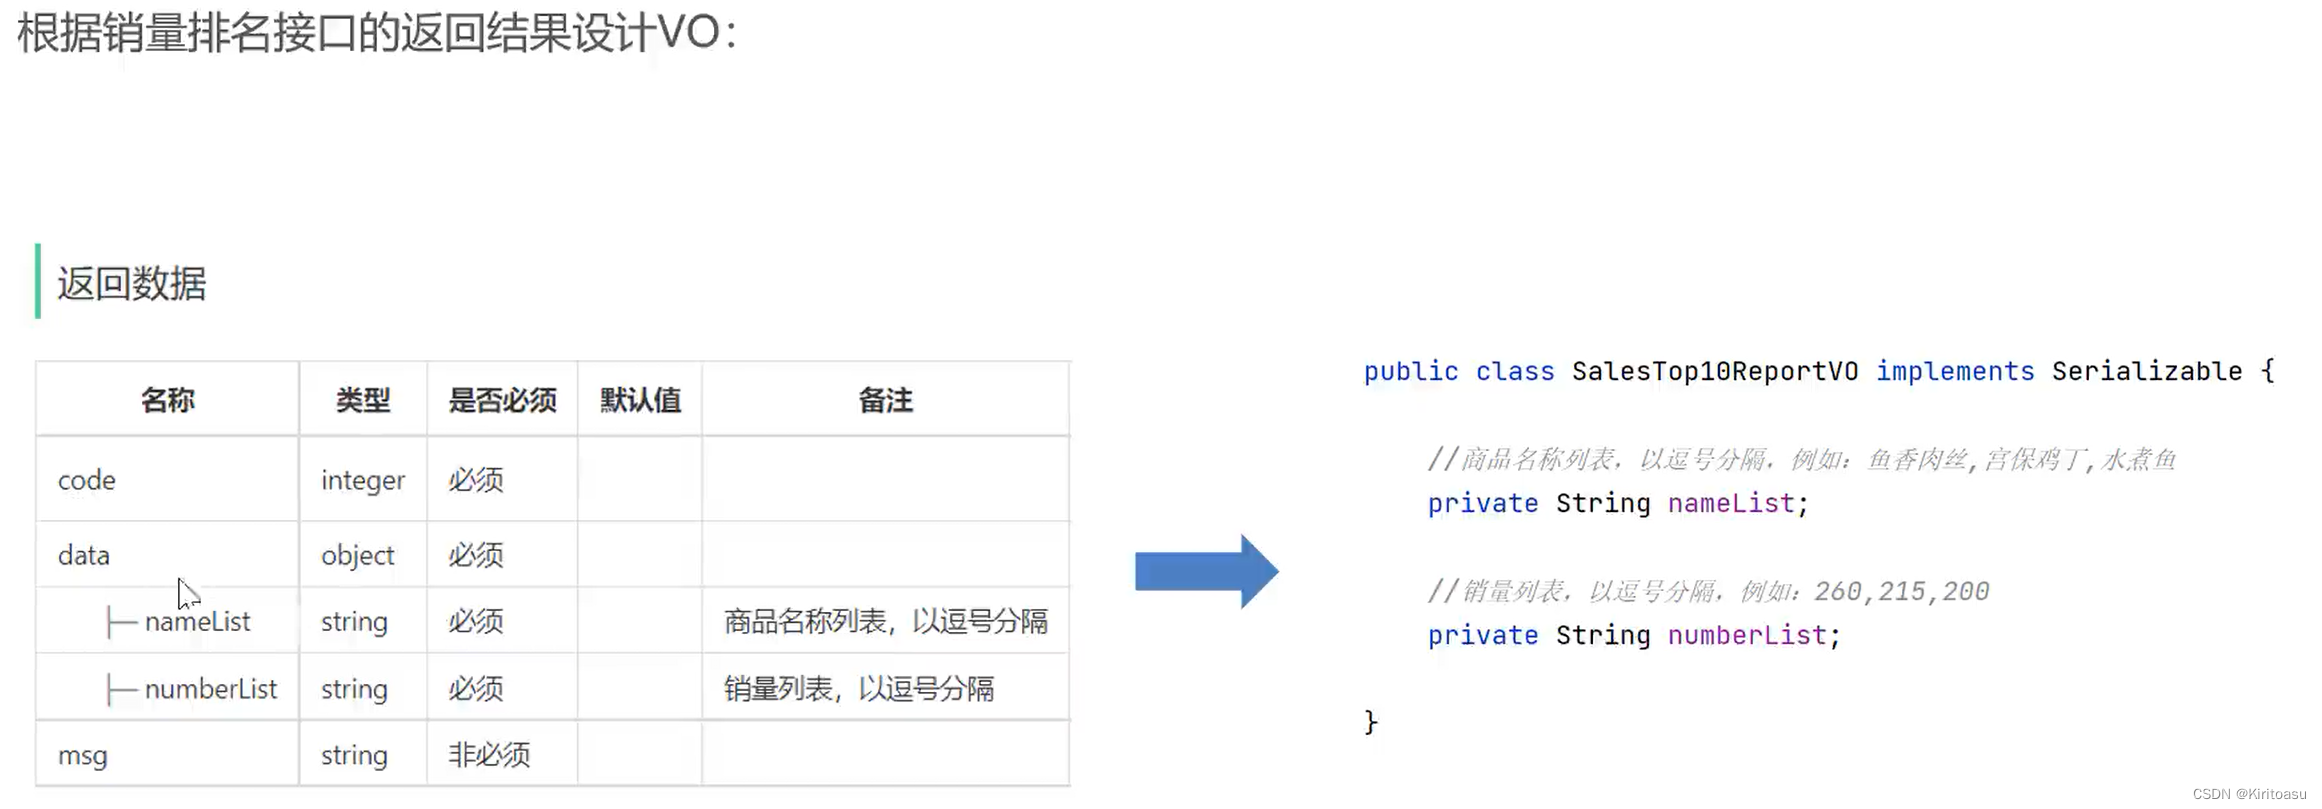
ReportServiceImpl:
    /**
     * 销量统计
     * @param begin
     * @param end
     * @return
     */
    @Override
    public SalesTop10ReportVO getTop10(LocalDate begin, LocalDate end) {
        LocalDateTime beginTime = LocalDateTime.of(begin, LocalTime.MIN);
        LocalDateTime endTime = LocalDateTime.of(end,LocalTime.MAX);

        List<GoodsSalesDTO> salesTop10 = orderMapper.getSalesTop(beginTime,endTime);

        List<String> names = salesTop10.stream().map(GoodsSalesDTO::getName).collect(Collectors.toList());
        String nameList = StringUtils.join(names,",");
        List<Integer> numbers = salesTop10.stream().map(GoodsSalesDTO::getNumber).collect(Collectors.toList());
        String numberList = StringUtils.join(numbers,",");

        return SalesTop10ReportVO.builder()
                .nameList(nameList)
                .numberList(numberList)
                .build();
    }
OrderMapper:
    /**
     * 销量统计
     * @param begin
     * @param end
     * @return
     */
    List<GoodsSalesDTO> getSalesTop(LocalDateTime begin, LocalDateTime end);
OrderMapper.XML:
<select id="getSalesTop" resultType="com.sky.dto.GoodsSalesDTO">
select od.name, sum(od.number) number
from order_detail od, orders o
where od.order_id = o.id and o.status = 5
<if test="begin != null">
and o.order_time > #{begin}
</if>
<if test="end != null">
and o.order_time < #{end}
</if>
group by od.name
order by number desc
limit 0,10
</select>
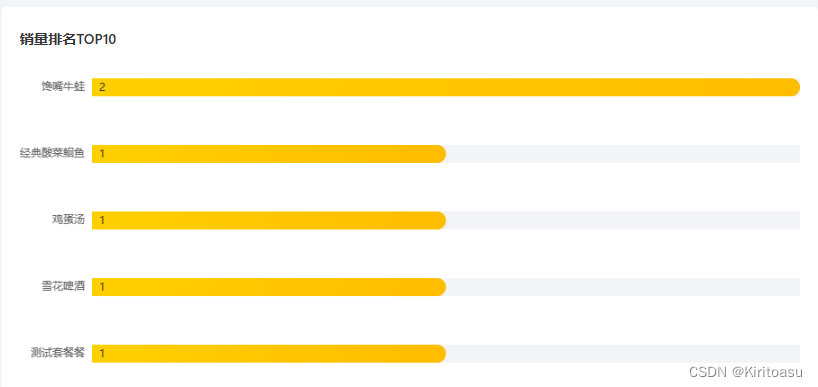
3、测试
五、Apache Echarts
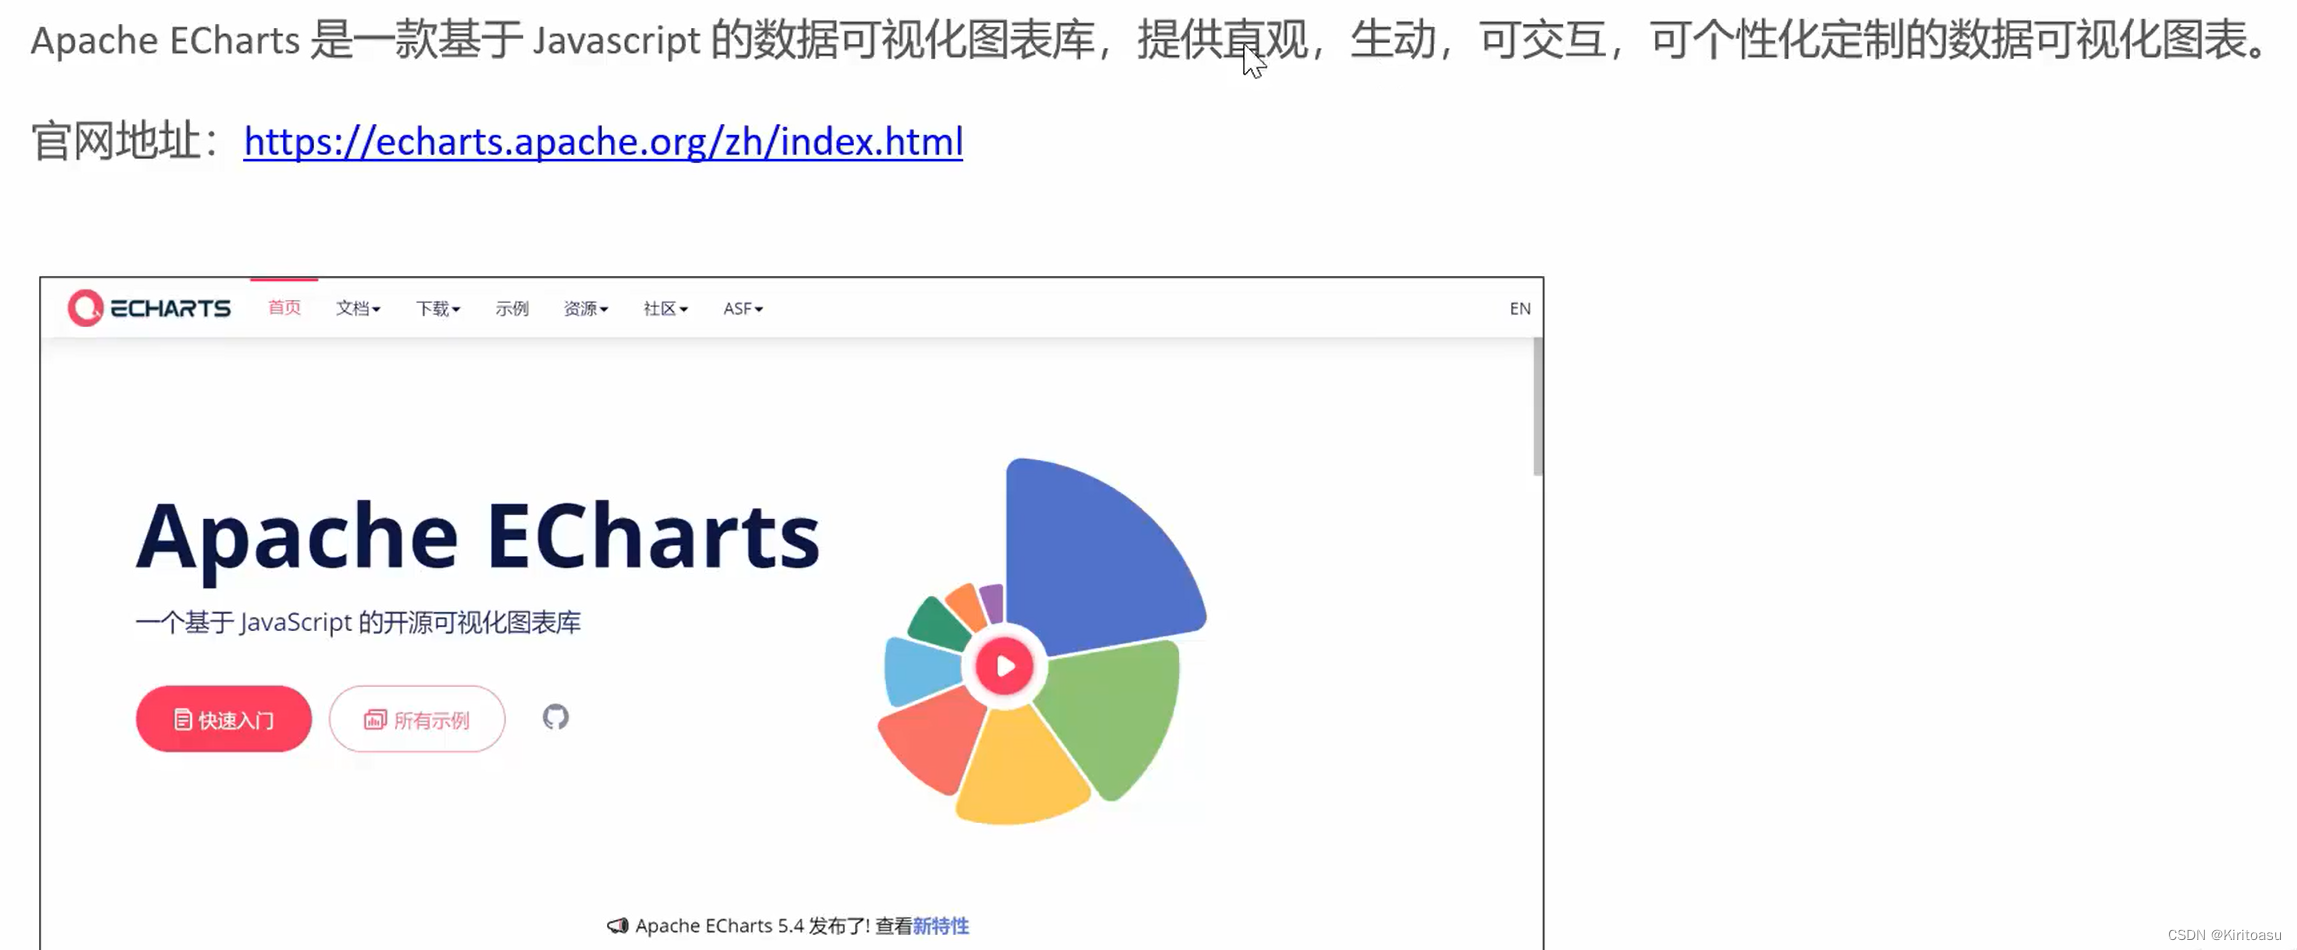
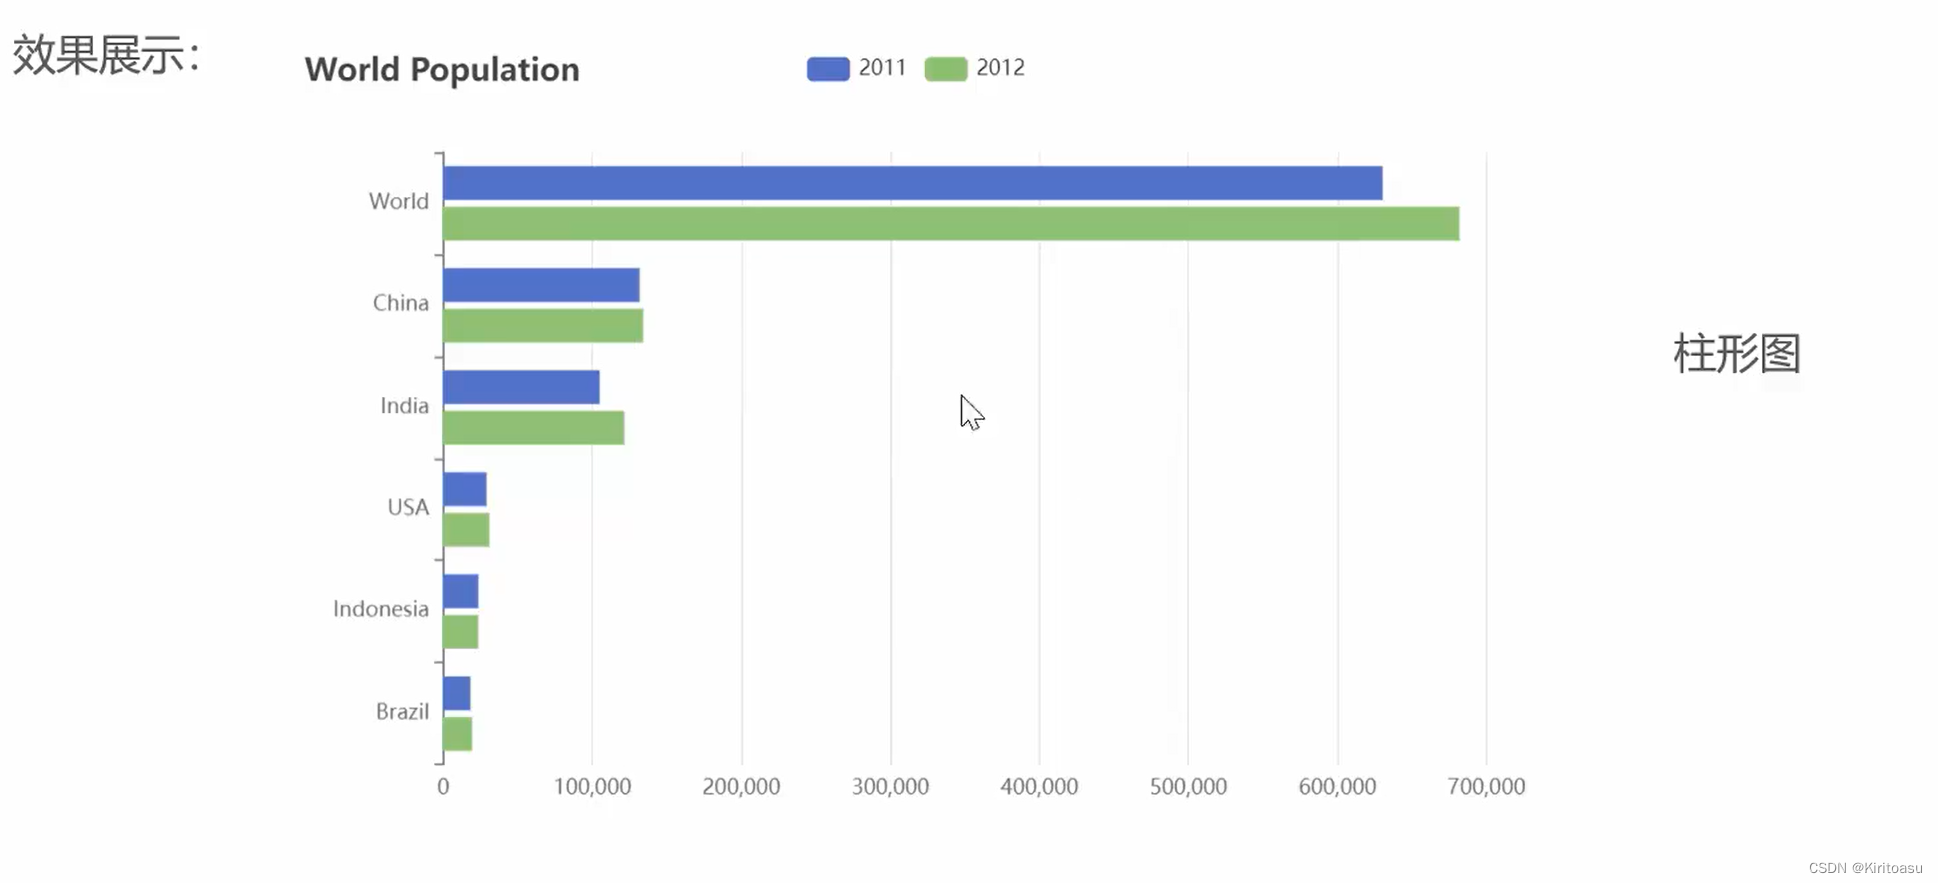
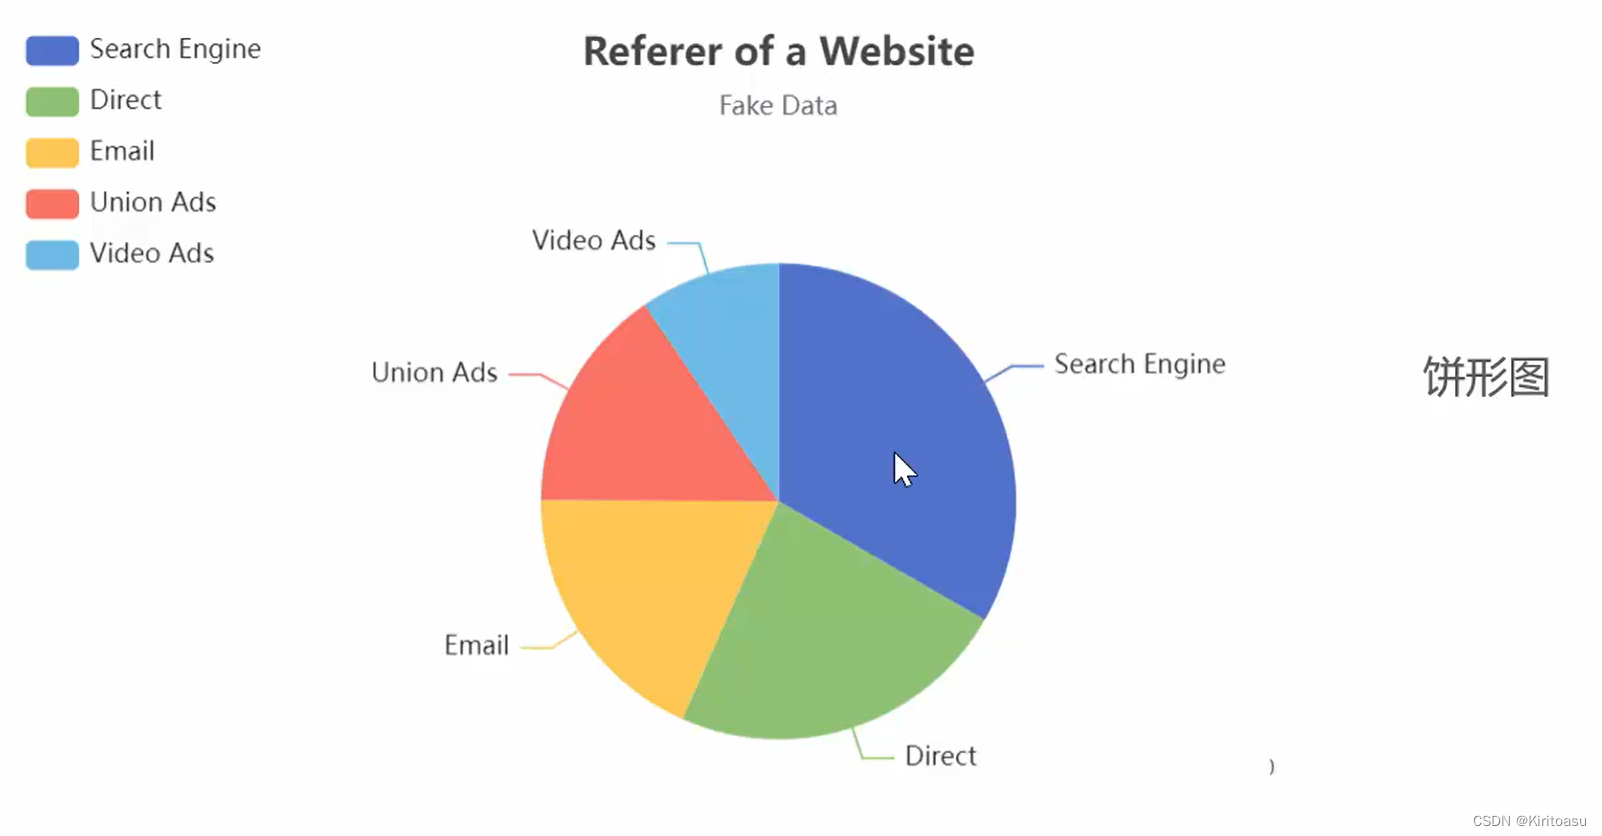
去官网查看具体使用流程:
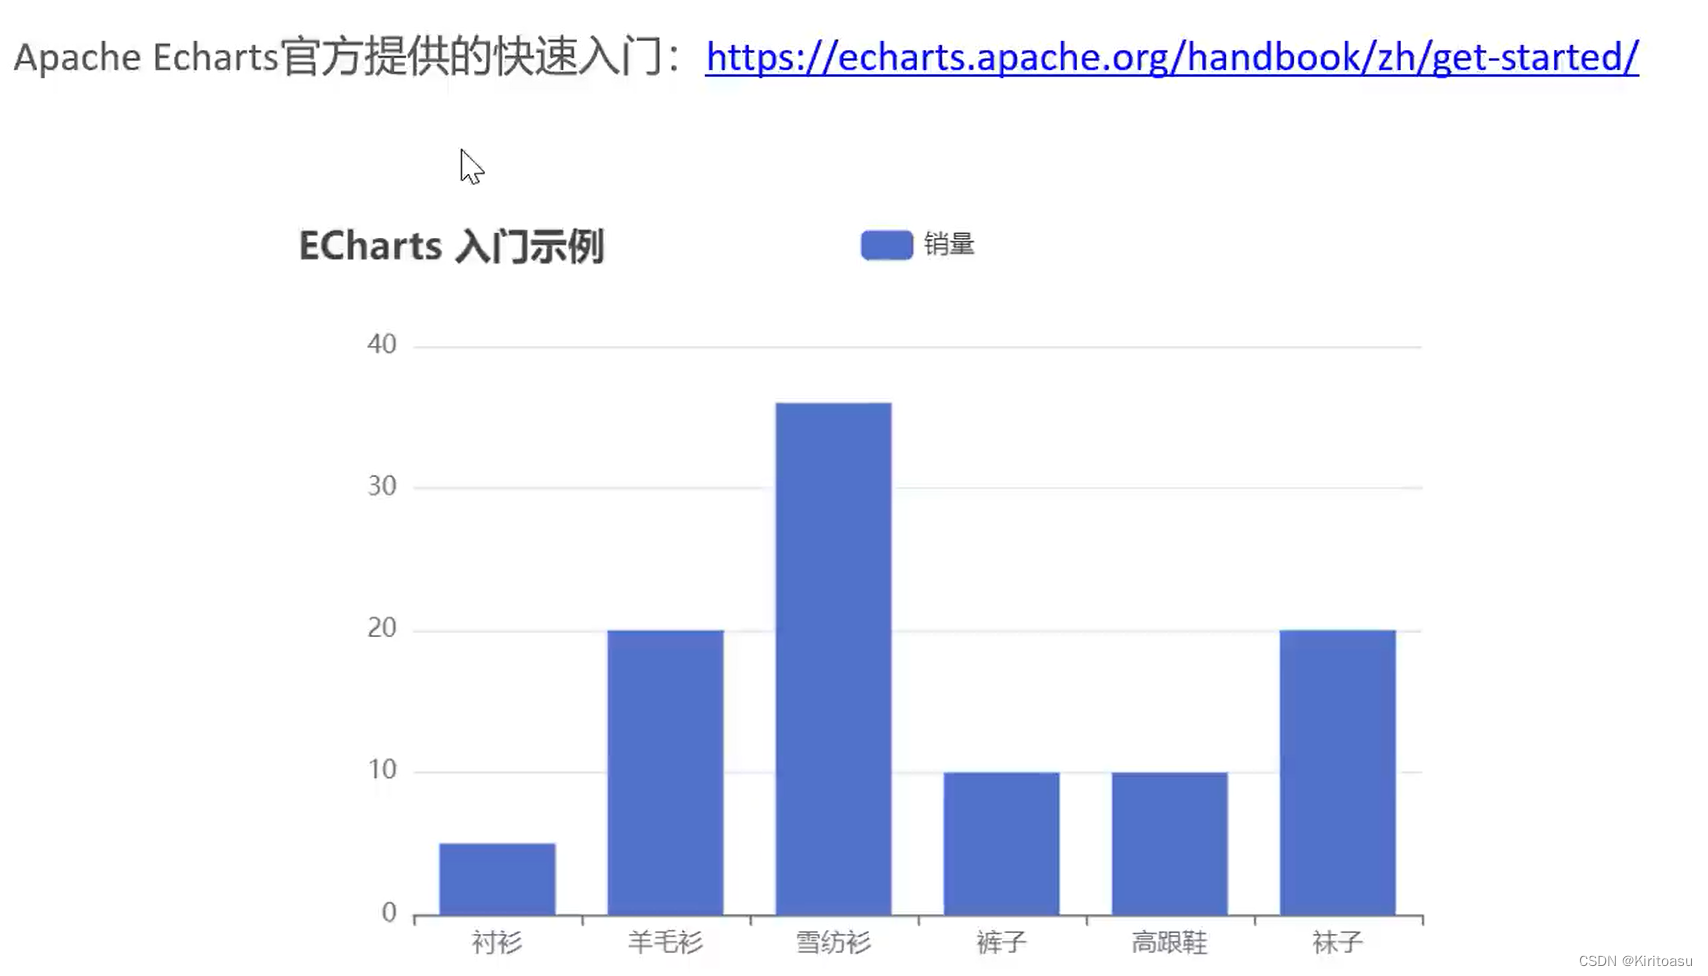
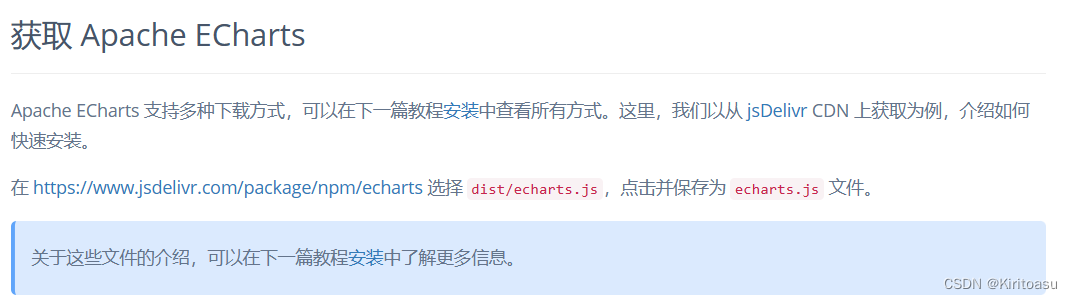
展示一个echarts入门案例
<!DOCTYPE html>
<html>
  <head>
    <meta charset="utf-8" />
    <title>ECharts</title>
    <!-- 引入刚刚下载的 ECharts 文件 -->
    <script src="echarts.js"></script>
  </head>
  <body>
    <!-- 为 ECharts 准备一个定义了宽高的 DOM -->
    <div id="main" style="width: 600px;height:400px;"></div>
    <script type="text/javascript">
      // 基于准备好的dom,初始化echarts实例
      var myChart = echarts.init(document.getElementById('main'));

      // 指定图表的配置项和数据
      var option = {
        title: {
          text: 'ECharts 入门示例'
        },
        tooltip: {},
        legend: {
          data: ['销量']
        },
        xAxis: {
          data: ['衬衫', '羊毛衫', '雪纺衫', '裤子', '高跟鞋', '袜子']
        },
        yAxis: {},
        series: [
          {
            name: '销量',
            type: 'bar',
            data: [5, 20, 36, 10, 10, 20]
          }
        ]
      };

      // 使用刚指定的配置项和数据显示图表。
      myChart.setOption(option);
    </script>
  </body>
</html>


 1097
1097

 被折叠的 条评论
为什么被折叠?
被折叠的 条评论
为什么被折叠?
 到【灌水乐园】发言


