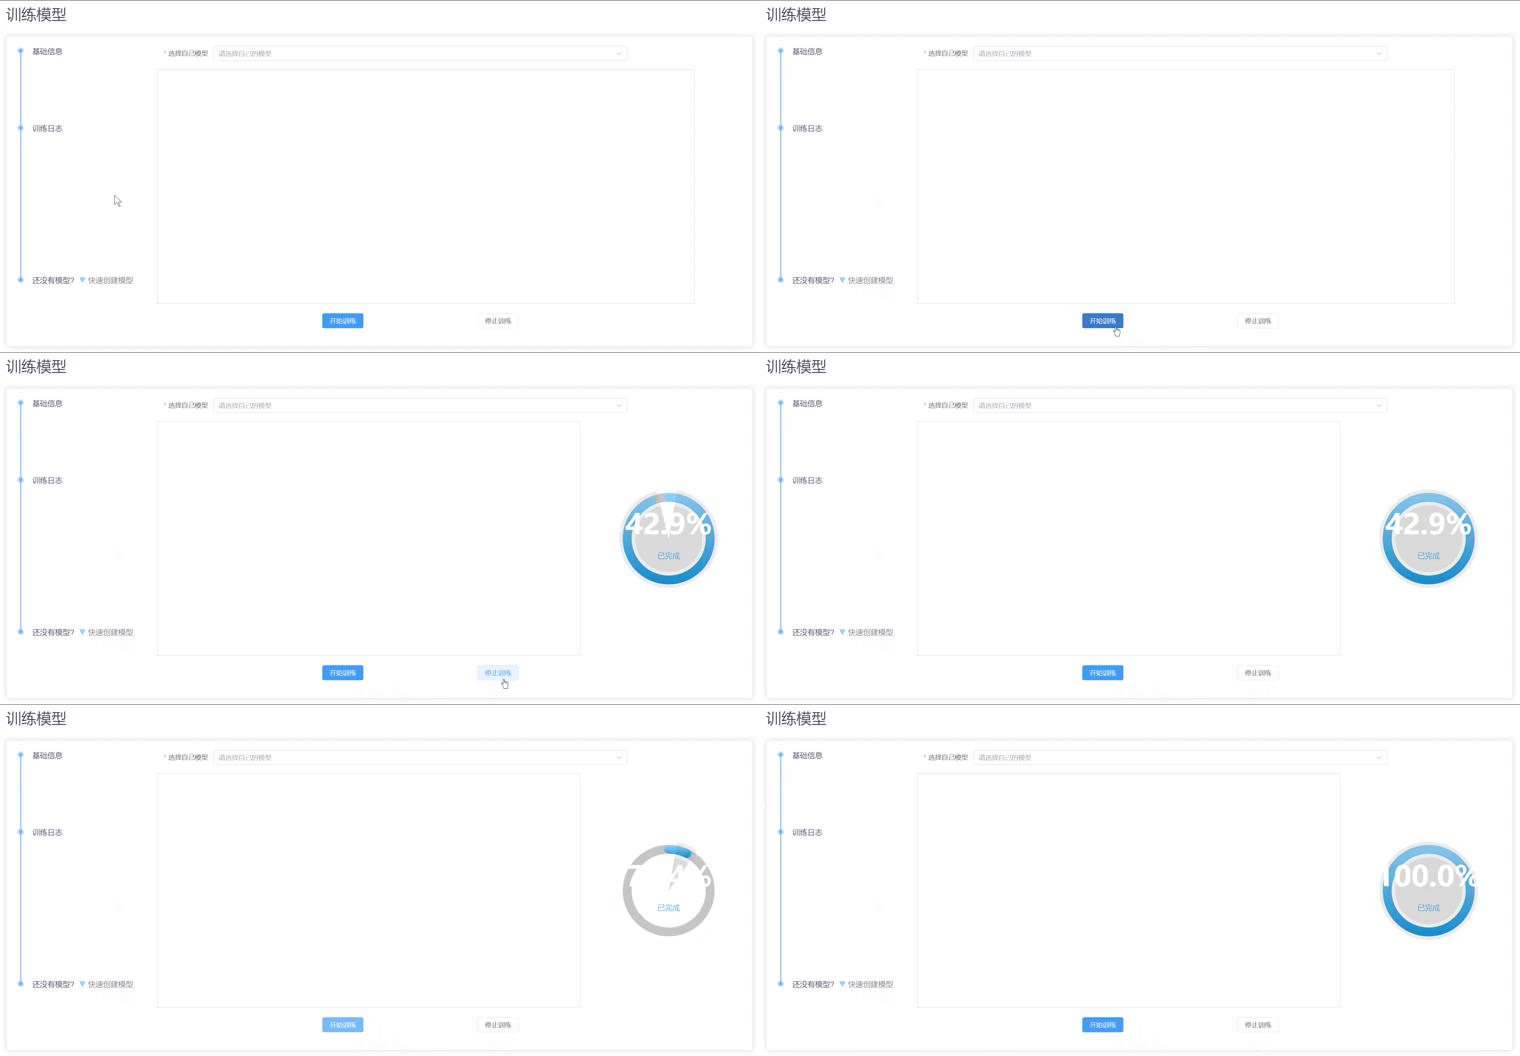
在vue3 + js + vite项目中 , 实现点击显示echarts , echarts数据进行加载
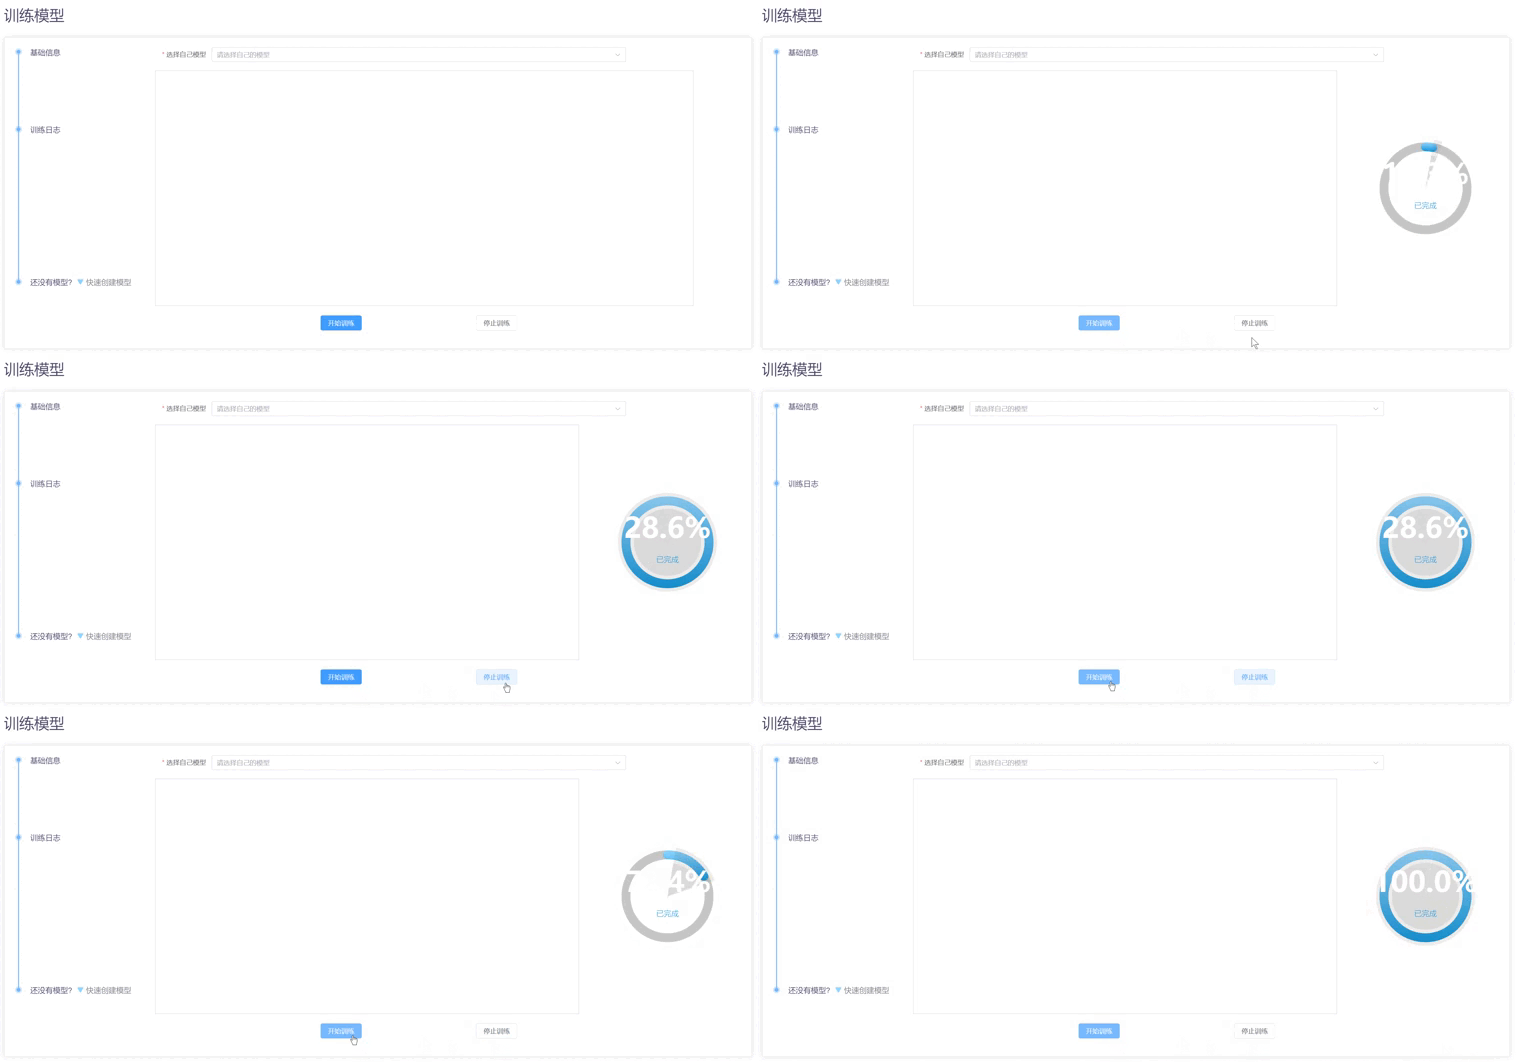
最终效果如下

遇到了一个问题 : 暂停以后再开始 , 数字会走的很快
原因分析 : 因为在暂停期间,currentIndex的值仍会不断增加 。所以 , 需要将currentIndex的值重置为当前数字的值

完整代码如下
<template>
  <div class="deploy">
    <div class="cardTop">训练模型</div>
    <el-card class="elCard">
      <div class="left">
        <ul class="leftUl">
          <li :class="changeClass">
            <div class="circle">
              <img src="../../assets/image/圆圈.svg" alt="" />
            </div>
            <div class="text">基础信息</div>
          </li>

          <li class="leftLi1-5">
            <div class="circle">
              <img src="../../assets/image/圆圈.svg" alt="" />
            </div>
            <div class="text">训练日志</div>
          </li>

          <li class="leftLi2">
            <div class="circle">
              <img src="../../assets/image/圆圈.svg" alt="" />
            </div>
            <div class="text">还没有模型?</div>
            <div class="textBottom" @click="mouseupHandle()">
              <img :src="isCreate ? xiala2 : xiala" alt="" />
              快速创建模型
            </div>
          </li>
          <li class="leftLi3" :class="changeClass">
            <div class="circle3">
              <img src="../../assets/image/圆圈.svg" alt="" />
            </div>
          </li>
        </ul>
      </div>
      <div class="elForm">
        <el-form
          :model="tableData"
          :rules="rules"
          label-width="120px"
          ref="formRef"
        >
          <el-form-item label="选择自己模型" prop="cont_name">
            <el-select v-model="form.cont_name" placeholder="请选择自己的模型">
              <el-option
                v-for="(item, index) in my_container_name"
                :key="index"
                :label="item"
                :value="item"
              />
            </el-select>
          </el-form-item>
          <div class="conent">
            <!-- 日志区域 -->
            <div class="logs" :class="changeLogs">
              <el-scrollbar height="500px">
                <div
                  v-for="(message, index) in messages"
                  :key="index"
                  class="echartsMsg"
                >
                  {{ message }}
                </div>
              </el-scrollbar>
            </div>

            <!-- echarts区域 -->
            <div class="echarts">
              <div
                id="myEcharts"
                :style="{
                  width: '100%',
                  height: '500px'
                }"
              ></div>
            </div>
          </div>

          <!-- 高级选项 -->
          <div class="high" v-if="isHighShow">
            <el-button type="primary" large @click="toCreate" class="toCreate"
              >快速创建模型</el-button
            >
          </div>
          <el-form-item class="elButton" v-if="!isHighShow">
            <el-button type="primary" @click="onSubmit">开始训练</el-button>
            <el-button type="primary" @click="cancel">开始训练测试版</el-button>

            <el-button @click="cancel1">停止训练测试版</el-button>
            <el-button @click="closeWebSocket">停止训练</el-button>
            <!-- <el-button @click="connectWebSocket">开始训练</el-button> -->
          </el-form-item>
        </el-form>
      </div>
    </el-card>
  </div>
</template>

<script setup>
import {
  ElButton,
  ElForm,
  ElFormItem,
  ElSelect,
  ElOption,
  ElMessage,
  ElScrollbar,
  ElCard
} from 'element-plus'
import { ref, reactive, computed, onUnmounted, onMounted } from 'vue'
import { beginDrill, listDeploy } from '../../api/model.js'
import xiala2 from '../../assets/image/上拉.png'
import xiala from '../../assets/image/下拉.png'
import { useRouter } from 'vue-router'
import * as echarts from 'echarts'
const echartsData = [1, 2, 3, 4, 5, 6, 7] // echarts中的数据,应该切换成losses
const losses = ref([]) //websocket的返回

let currentIndex = 0 // 当前数据索引
let timer // 定时器
let chartInstance //echarts实例

const echartsShow = ref(false)
const logsShow = ref(false)

const ws = ref(null)
const messages = ref([])

function connectWebSocket () {
  ws.value = new WebSocket('ws://192.168.11.222:5533/train_logs/langtrain')
  ws.timeout = 5000000000
  ws.value.onopen = () => {
    console.log('WebSocket已连接')
  }
  ws.value.onmessage = event => {
    losses.value = data.map(item => item.loss)
    console.log(losses)
    console.log(event.data)
    messages.value.push(event.data)
  }
  ws.value.onclose = event => {
    console.log('WebSocket已断开', event)
  }
  ws.value.onerror = error => {
    console.error('WebSocket出错', error)
  }
}

const closeWebSocket = () => {
  if (ws.value) {
    ws.value.close()
    messages.value = []
  }
}

// logs宽度变化
const changeLogs = computed(() => {
  if (logsShow.value) {
    return 'logs isCreateTrue'
  } else {
    return 'logs'
  }
})

// onMounted(() => {
// 在组件加载时自动连接WebSocket
//connectWebSocket()
//})

// onUnmounted(() => {
//   // 在组件卸载时关闭WebSocket
//   closeWebSocket()
// })

const tableData = reactive([
  {
    creat_time: '2023-05-03',
    container_name: 'Tom',
    image_name: 'https://mirrors.aliyun.com/'
  }
])

const my_container_name = ref([''])

async function fetchData () {
  try {
    await listDeploy().then(res => {
      tableData.length = 0 // 清空tableData数组
      tableData.push(...res.data) // 将返回的数据添加到tableData数组中
      my_container_name.value = tableData.map(item => item.container_name)

      const styleOptions = {
        year: 'numeric',
        month: 'long', // 使用长格式,例如:'一月'
        day: 'numeric',
        hour: '2-digit',
        minute: '2-digit',
        second: '2-digit'
      }

      const dateRegex =
        /^(\d{4})-(\d{1,2})-(\d{1,2})T(\d{1,2}):(\d{1,2}):(\d{1,2})\.\d+Z$/

      tableData.forEach(item => {
        const matches = dateRegex.exec(item.creat_time)
        if (matches) {
          const [, year, month, day, hour, minute, second] = matches
          item.creat_time = new Date(
            Date.UTC(
              Number(year),
              Number(month) - 1,
              Number(day),
              Number(hour),
              Number(minute),
              Number(second)
            )
          )
            .toLocaleString(undefined, styleOptions)
            .replace(/\//g, '-')
        }
      })

      // console.log('tableData', tableData)
    })
  } catch (error) {
    console.error('从后台拿现有模型列表失败', error)
  }
}

const router = useRouter()

const formRef = ref(null)

const form = ref({
  cont_name: '',
  image: '',
  model: ''
})

const modelList = ref([
  'agi ui',
  'autogen',
  'bert-base-chinese',
])

const selectedOption = ref('')

const isHighShow = ref(false) // 还没有模型?显示
const isCreate = ref(false) // 下拉图片切换

//左侧 还没有模型? 显示事件
const mouseupHandle = () => {
  isCreate.value = !isCreate.value
  isHighShow.value = !isHighShow.value
}

//左侧 还没有模型? 显示事件
const changeClass = computed(() => {
  if (isCreate.value) {
    return 'leftLi isCreateTrue'
  } else {
    return 'leftLi'
  }
})

const cancel = () => {
  // router.push('./drill')
  echartsShow.value = true
  logsShow.value = true
  timer = setInterval(initChart, 1000)
}

const cancel1 = () => {
  // router.push('./drill')
  echartsShow.value = false
  logsShow.value = true
  clearInterval(timer)
  currentIndex = logsData[logsData.length - 1].value // 将 currentIndex 重置为当前数字的值
  timer = setInterval(initChart, 1000)
}

const rules = reactive({
  cont_name: [
    { required: true, message: '请输入正确的模型', trigger: 'blur' }
    // {
    //   pattern: /^(?=.*[a-zA-Z])(?=.*\d).+$/,
    //   message: '英文名字格式错误 支持英文+数字',
    //   trigger: 'blur'
    // }
  ]
})

// my_container_name有值 即可提交表单
function validateImage (rule, value, callback) {
  if (my_container_name.value) {
    // 有值时直接通过验证
    callback()
  } else {
    // 没有值时显示错误信息
    callback(new Error('请从下图中选择镜像地址'))
  }
}

const toCreate = () => {
  router.push('./create')
}

onMounted(() => {
  fetchData()
  initChart()
})

const onSubmit = async () => {
  console.log('form.cont_name', form.value.cont_name)
  // const valid = await formRef.value.validate()
  // if (valid) {
  let msgData = {
    cont_name: form.value.cont_name,
    imgname: 'llama0.82',
    // cont_name: 'langtrain',
    path_to_llama_model: '/src/openbuddy-openllama-7b-v5-fp16',
    model_type: 'llama',
    output_dir: '/output',
    output_path: '/nvme1/ningyu/lang_output/test24_01_19',
    logs_path: '/nvme1/ningyu/langport_logs',
    finetuning_type: 'lora',
    dataset_location: 'oaast_sft_zh',
    dataset_info: '',
    gpu_nums: '1',
    deepspeed_type: '1'
  }
  beginDrill(msgData)
    .then(res => {
      // 处理请求成功的响应
      console.log('这是开始训练的res', res)
      setTimeout(() => {
        connectWebSocket()
      }, 5000)
    })
    .catch(error => {
      // 处理请求错误
      console.error(error)
    })
  // } else {
  //   console.log('训练的表单数据不完整')
  // }
}

function getPct (index) {
  const total = echartsData.length
  const pct = ((index + 1) / total) * 100
  return pct.toFixed(1) + '%'
}

function initChart () {
  if (echartsShow.value === false) {
    // 当 echartsData 的长度为 0 时,直接停止定时器
    clearInterval(timer)
    return
  } else {
    if (currentIndex >= echartsData.length) {
      // 达到最后一个数据时停止定时器
      clearInterval(timer)
      return
    }

    const chartDom = document.getElementById('myEcharts')
    if (chartInstance) {
      // 在初始化图表之前,可能已经存在一个使用相同 DOM 元素的图表实例 , 会报警告"[ECharts] There is a chart instance already initialized on the dom."
      chartInstance.dispose()
    }

    chartInstance = echarts.init(chartDom)

    chartInstance.setOption({
      title: [
        {
          text: '已完成',
          x: 'center',
          top: '55%',
          textStyle: {
            color: '#1296db',
            fontSize: 16,
            fontWeight: '100'
          }
        },
        {
          text: getPct(currentIndex),
          x: 'center',
          top: '38%',
          textStyle: {
            fontSize: '60',
            color: '#FFFFFF',
            fontFamily: 'DINAlternate-Bold, DINAlternate',
            foontWeight: '600'
          }
        }
      ],
      // backgroundColor: '#111',
      polar: {
        radius: ['42%', '52%'],
        center: ['50%', '50%']
      },
      angleAxis: {
        max: 100,
        show: false
      },
      radiusAxis: {
        type: 'category',
        show: true,
        axisLabel: {
          show: false
        },
        axisLine: {
          show: false
        },
        axisTick: {
          show: false
        }
      },
      series: [
        {
          name: '',
          type: 'bar',
          roundCap: true,
          barWidth: 90,
          showBackground: true,
          backgroundStyle: {
            color: 'rgba(66, 66, 66, .3)'
          },
          data: [100],
          coordinateSystem: 'polar',

          itemStyle: {
            color: new echarts.graphic.LinearGradient(0, 1, 0, 0, [
              {
                offset: 0,
                color: '#1296db'
              },
              {
                offset: 1,
                color: '#91D5FF'
              }
            ])
          }
        },
        {
          name: '',
          type: 'pie',
          startAngle: 80,
          radius: ['56%'],
          center: ['50%', '50%'],
          itemStyle: {
            color: 'rgba(66, 66, 66, .1)'
          },
          data: [100]
        },
        {
          name: '',
          type: 'pie',
          startAngle: 80,
          radius: ['38%'],
          center: ['50%', '50%'],
          itemStyle: {
            color: 'rgba(66, 66, 66, .1)'
          },
          data: [100]
        }
      ]
    })

    window.onresize = function () {
      //自适应大小
      chartInstance.resize()
    }
    currentIndex++
    // setTimeout(() => {
    //   initChart()
    //   currentIndex++
    // }, currentIndex * 10000) // 在10秒后更新数字

    console.log('currentIndex', currentIndex)
  }
}

timer = setInterval(initChart, 1000)

// setTimeout(() => {
//   timer = setInterval(initChart, 1000)
// }, 10000) //

// 关闭echarts时销毁实例
onUnmounted(() => {
  if (chartInstance) {
    chartInstance.dispose()
  }
  closeWebSocket()
})
</script>

<style lang="less" scoped>
.deploy {
  padding: 30px 60px 0 60px;

  .cardTop {
    margin-bottom: 30px;
    color: #27264d;
    font-size: 32px;
    opacity: 0.85;
    display: flex;
  }
  .elCard {
    .left {
      width: 300px;
      .leftUl {
        img {
          width: 20px;
          height: 20px;
        }
        .text {
          margin-left: 15px;
          color: #27264d;
          font-weight: 500;
          font-size: 16px;
          line-height: 24px;
          letter-spacing: 0;
          opacity: 0.85;
        }

        .leftLi {
          display: flex;
          .circle {
            position: relative;
          }
          .circle::after {
            content: '';
            position: absolute;
            top: 60%;
            left: 50%;
            transform: translate(-50%, 0);
            width: 2px;
            height: var(--circle-height, 480px);
            background-color: #75b7ff;
          }
        }
        .leftLi1-5 {
          display: flex;
          margin-top: 140px;
          align-items: center;
          .textBottom {
            padding-left: 10px;
            color: rgba(112, 114, 121, 0.85);
            cursor: pointer;
            img {
              width: 15px;
              height: 12px;
            }
          }
        }
        .leftLi2 {
          display: flex;
          margin-top: 300px;
          align-items: center;
          .textBottom {
            padding-left: 10px;
            color: rgba(112, 114, 121, 0.85);
            cursor: pointer;
            img {
              width: 15px;
              height: 12px;
            }
          }
        }
        .leftLi3 {
          display: flex;
          .circle3 {
            position: relative;
            top: var(--circle-top, 20px);
            opacity: var(--opacity, 0);
          }
        }
        .isCreateTrue {
          --circle-height: 560px;
          --circle-top: 60px;
          --opacity: 1;
        }
      }
    }
    .elForm {
      width: 1000px;

      .conent {
        display: flex;
        width: 1500px;

        .logs {
          width: var(--width, 80%;);
          height: 500px;
          overflow: auto;
          border: 1px #ccc solid;
        }
        .isCreateTrue {
          --width: 60%;
        }
        .echarts {
          height: 500px;
          width: 25%;
        }
      }

      :deep(.el-select) {
        width: 100%;
      }
      .elButton {
        :deep(.el-form-item__content) {
          display: flex;
          justify-content: space-evenly;
          margin-top: 20px;
        }
      }
    }
  }

  :deep(.el-card__body) {
    display: flex;
  }
  :deep(.toCreate) {
    margin-top: 20px;
  }
}
</style>


 本文描述了在Vue3+Vite项目中使用Echarts时遇到的问题,即暂停后数据加载过快。解决方法是确保在暂停期间重置currentIndex以防止数值连续增加。作者提供了完整的代码示例和解决方案。


 4114
4114


 被折叠的 条评论
为什么被折叠?


