


基本原理
”物以聚类,点以距离分“的思想。对于给定的样本集,根据样本之间的距离划分为K个族,让族内的点的距离尽量的小,族间的距离尽量大。
主要步骤
1.从数据中选择K个对象作为初始的距离中心
2.计算每个聚类对象到聚类中心的距离,将每个对象划分到距离自己最近的聚类中心的一类
3.在每类中重新计算聚类中心,并重复2的操作,直到到达最大迭代次数或者两次更新的聚类中心距离达到要求
4.确定最优的聚类中心
主要的缺陷
1. K个初始中心的选择:K means++
2. K值得确定,因为没有已知得分类数目,所以无法实现知道K得取值,可以采用手肘法,轮廓系数法或者Calinski-harabasz系数等方式确定K值 可以参考 https://blog.csdn.net/qq_15738501/article/details/79036255
python代码
python实现并将结果与python自带得KMeans比较,结果一致
class KMeans():
def __init__(self,n_clusters: int = 8,max_iter: int = 300,tol:float = 1e-4):
self.n_clusters = n_clusters
self.max_iter = max_iter
self.tol = tol
self.c_clusters = None
def cluster(self,lo_c,lo_x):
'''
根据聚类中心确定每个点得类别
lo_c:聚类中心位置
lo_x:数据
'''
## 得到每个点到聚类中心得距离
op = []
for i in range(len(lo_c)):
op.append(np.linalg.norm(lo_c[i,:]-lo_x,axis = 1))
## 根据距离最小确定每个点得类别
return np.argmin(op,axis=0)
def updateCenter(self,lo_x,label):
lo_c= []
for n in range(self.n_clusters):
lo_c.append(np.mean(lo_x[label==n],axis=0))
return lo_c
def score(self,lo_cOld,lo_cNew):
return np.sum(np.linalg.norm(lo_cOld-lo_cNew,axis =1))
def plotFigure(self,lo_c,X,label,i):
ax = plt.subplot(4,4,i )
ax.scatter(X[:,0],X[:,1],c = label,cmap = plt.cm.Paired)
ax.scatter(lo_c[:,0],lo_c[:,1],c = 'g',marker='o',s = 300,alpha=0.5)
def fit(self,X):
index = np.random.randint(0,len(X),self.n_clusters)
self.c_clusters = X[index,:]
lo_cOld =np.copy(self.c_clusters)-100
label = self.cluster(self.c_clusters,X)
Score = self.score(lo_cOld,self.c_clusters)
inter = 1
plt.figure(figsize=(4*2,4*3))
self.plotFigure(self.c_clusters,X,label,inter)
while Score > self.tol and inter < self.max_iter:
print('--------------Score',Score)
lo_cOld = np.copy(self.c_clusters)
# print('--------------第%d次聚类中心%s'%(inter,self.c_clusters ))
self.c_clusters = np.array(self.updateCenter(X,label))
# print('--------------第%d次聚类中心%s'%(inter,self.c_clusters ))
label = self.cluster(self.c_clusters,X)
Score = self.score(lo_cOld,self.c_clusters )
inter +=1
if inter % 1 ==0 and inter < 300:
self.plotFigure(self.c_clusters,X,label,inter)
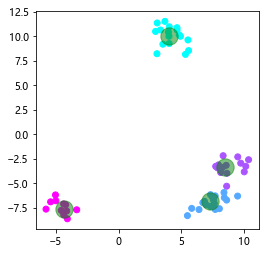
def predict(self,X_test):
label_ = self.cluster(self.c_clusters,X_test)
plt.figure(figsize=(4,4))
plt.scatter(X_test[:,0],X_test[:,1],c = label_,cmap ='cool')
plt.scatter(self.c_clusters[:,0],self.c_clusters[:,1],c = 'g',marker='o',s = 300,alpha=0.5)
return label_ if __name__ == '__main__':
from sklearn import datasets
import pandas as pd
import numpy as np
from sklearn.model_selection import train_test_split
import matplotlib.pyplot as plt
from sklearn import metrics
%matplotlib inline
X,y= datasets.make_blobs(n_samples=300,centers=4)
plt.figure(figsize=(4,4))
plt.scatter(X[:,0],X[:,1],c = y,cmap = plt.cm.Paired)
X_train, X_test, Y_train, Y_test = train_test_split(X, y, test_size=0.2)
kmeans = KMeans(n_clusters = 4,max_iter = 300)
kmeans.fit(X_train)
Y_pred = kmeans.predict(X_test)
print('acc:{}'.format( metrics.silhouette_score(X_test,Y_pred)))
del kmeans
from sklearn.cluster import KMeans
kmeans = KMeans(n_clusters = 4)
kmeans.fit(X_train)
Y_pred = kmeans.predict(X_test)
print('acc:{}'.format( metrics.silhouette_score(X_test,Y_pred)))acc:0.7412038737793807
sklearn Kmeans acc:0.7412038737793807结果可视化
可以看见聚类中心得变化

测试数据的可视化


 366
366


 被折叠的 条评论
为什么被折叠?
被折叠的 条评论
为什么被折叠?
 到【灌水乐园】发言


