


Introdution

When we talk about the model for generation adequacy evaluation, we see that there are a number of generation units and there is a single lumped load. The implication of thins is that, in generation adequacy evaluation, transmission is assumed to be perfectly reliable.
Generator model
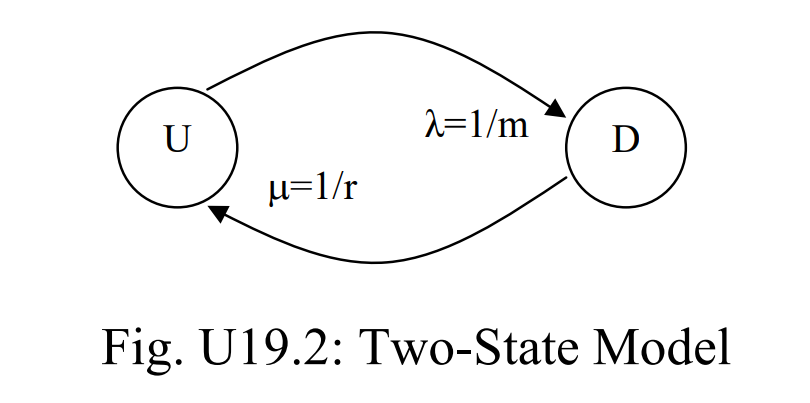
λ 为机组的故障率,μ 为机组的修复率。
Long-run availability A

Long-run unavailability U

Equivalent forced outage rate EFOR

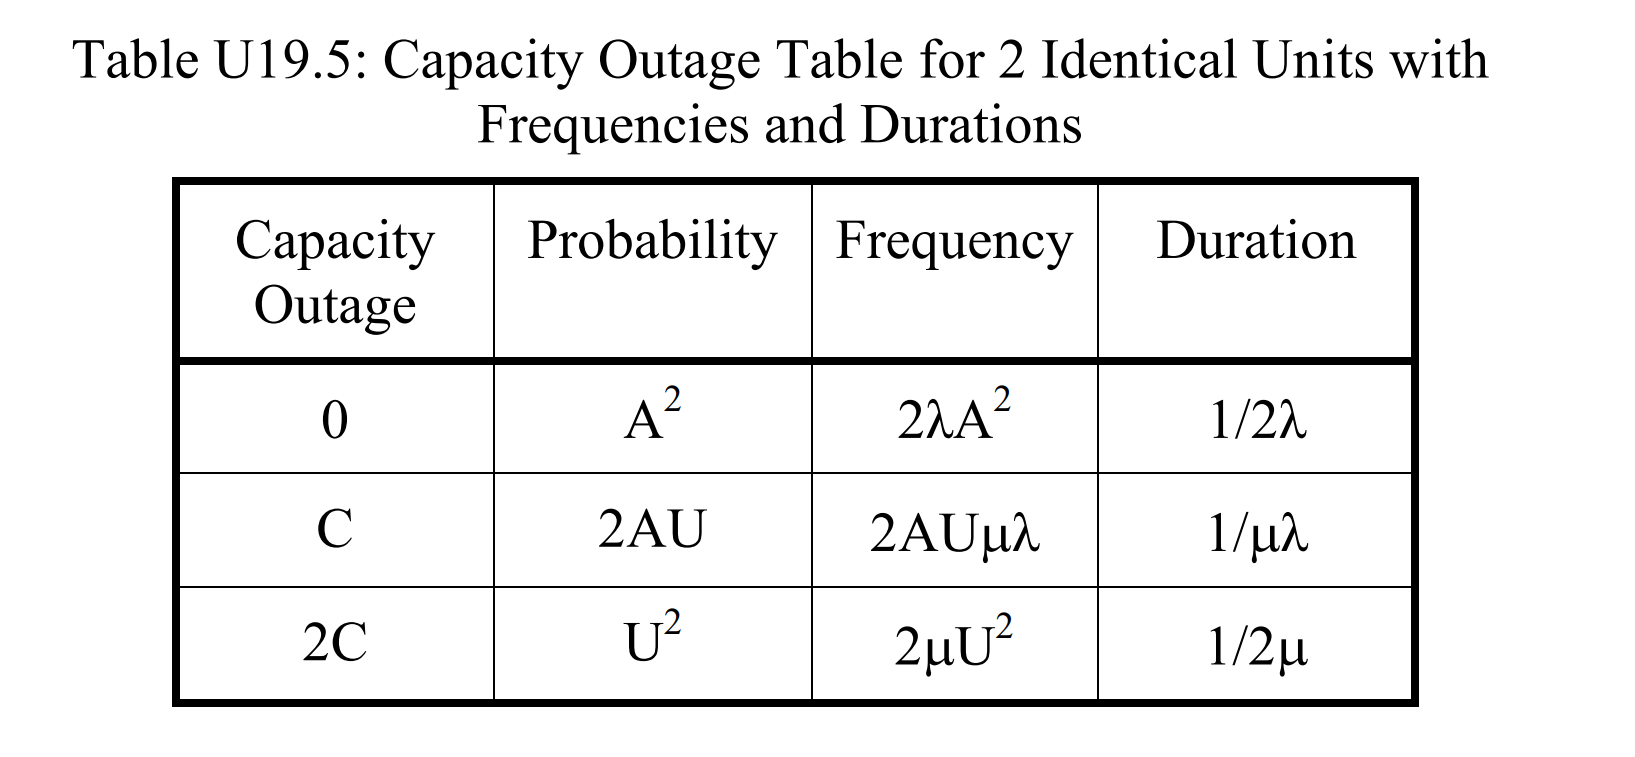
2.1 Capacity outage table for identical units
One generation unit
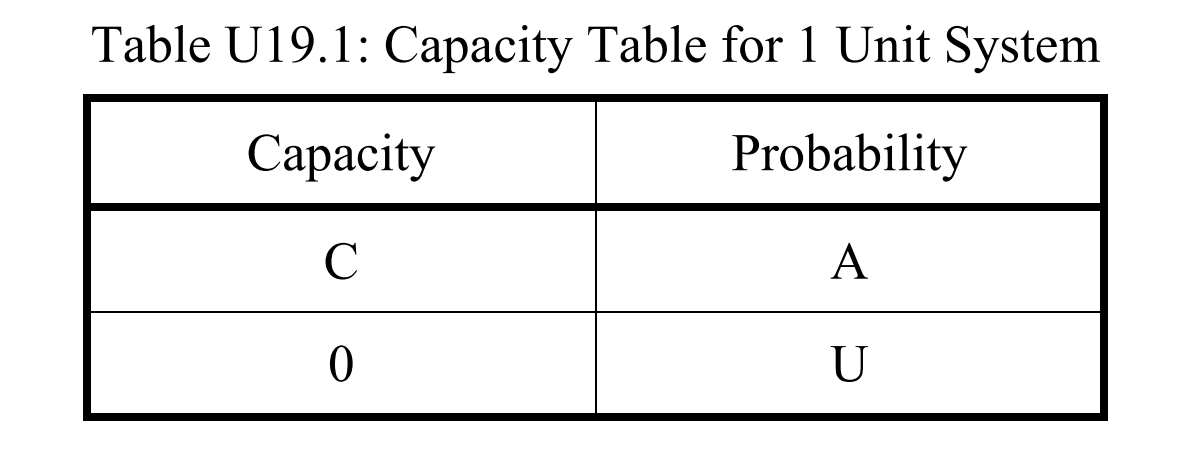

Probability mass function (pmf)


Frequency:

Duration for each state

2.2 Capacity outage table for units having different capacities
2.3 Convolution algorithm
2.4 Deconvolution
Load model
Calculation by Capacity Outage Tables
A capacity planning example
The effective load approach
6.1 Preliminary Definitions
6.2 Effective load
Four additional issues


 1046
1046


 被折叠的 条评论
为什么被折叠?
被折叠的 条评论
为什么被折叠?
 到【灌水乐园】发言


