


 文章介绍了混淆矩阵的基本概念、计算方法以及在评估模型性能时的关键指标,包括精确率和召回率。同时,文章详细阐述了ROC曲线和AUC面积的含义,以及它们在判断分类器效果中的作用。最后,提供了相关代码示例来计算这些指标。
一、混淆矩阵
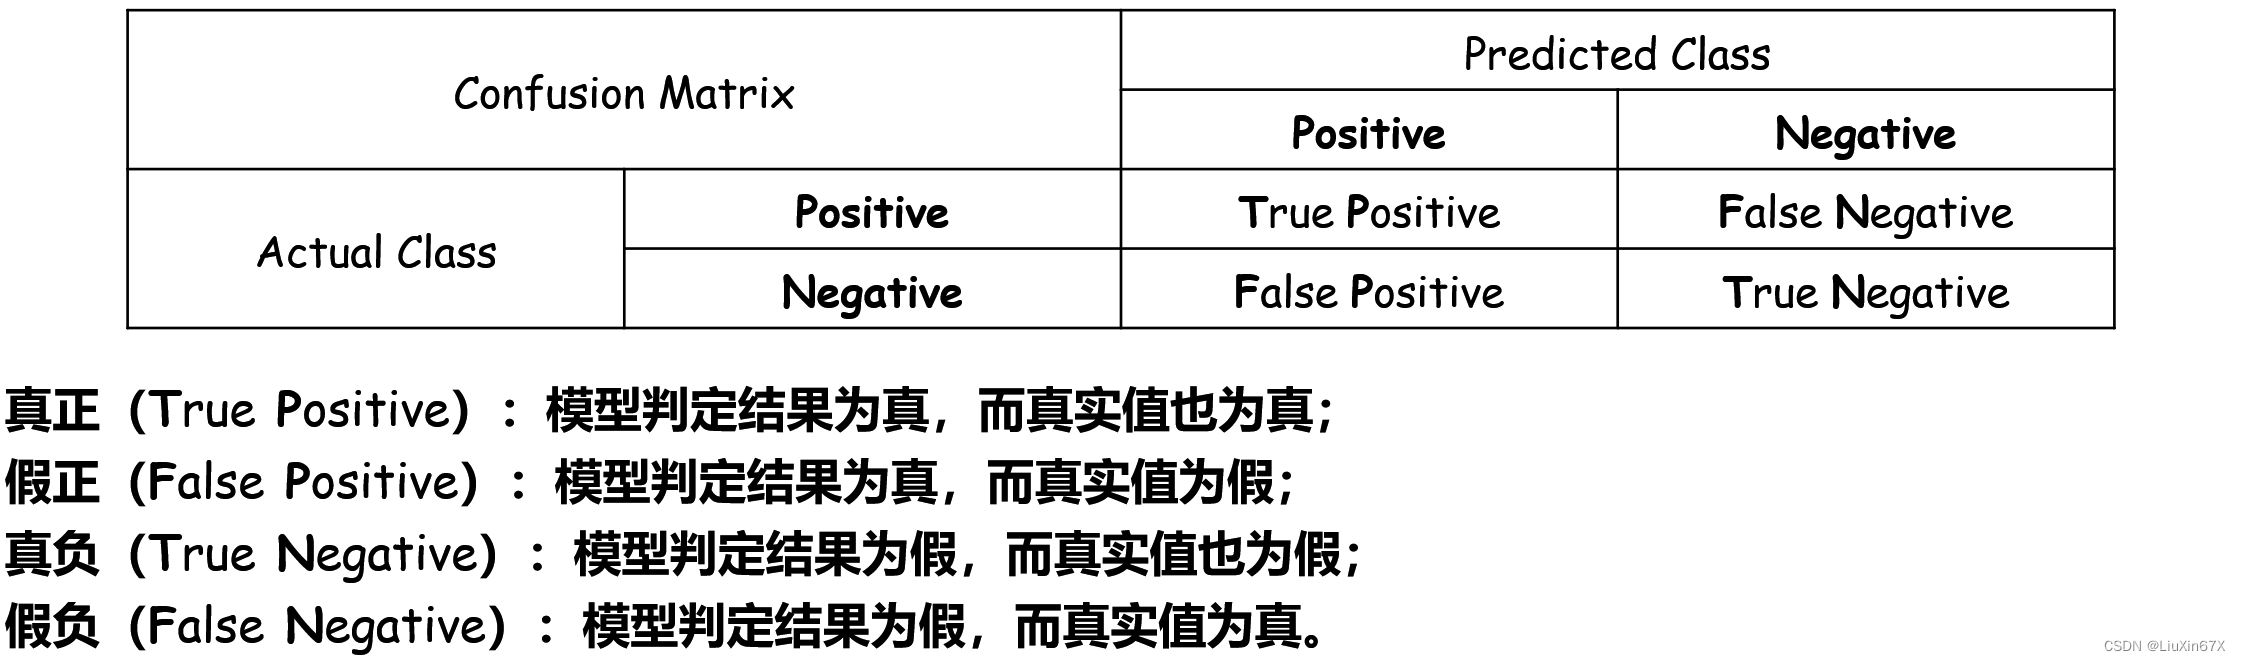
1、基本概念
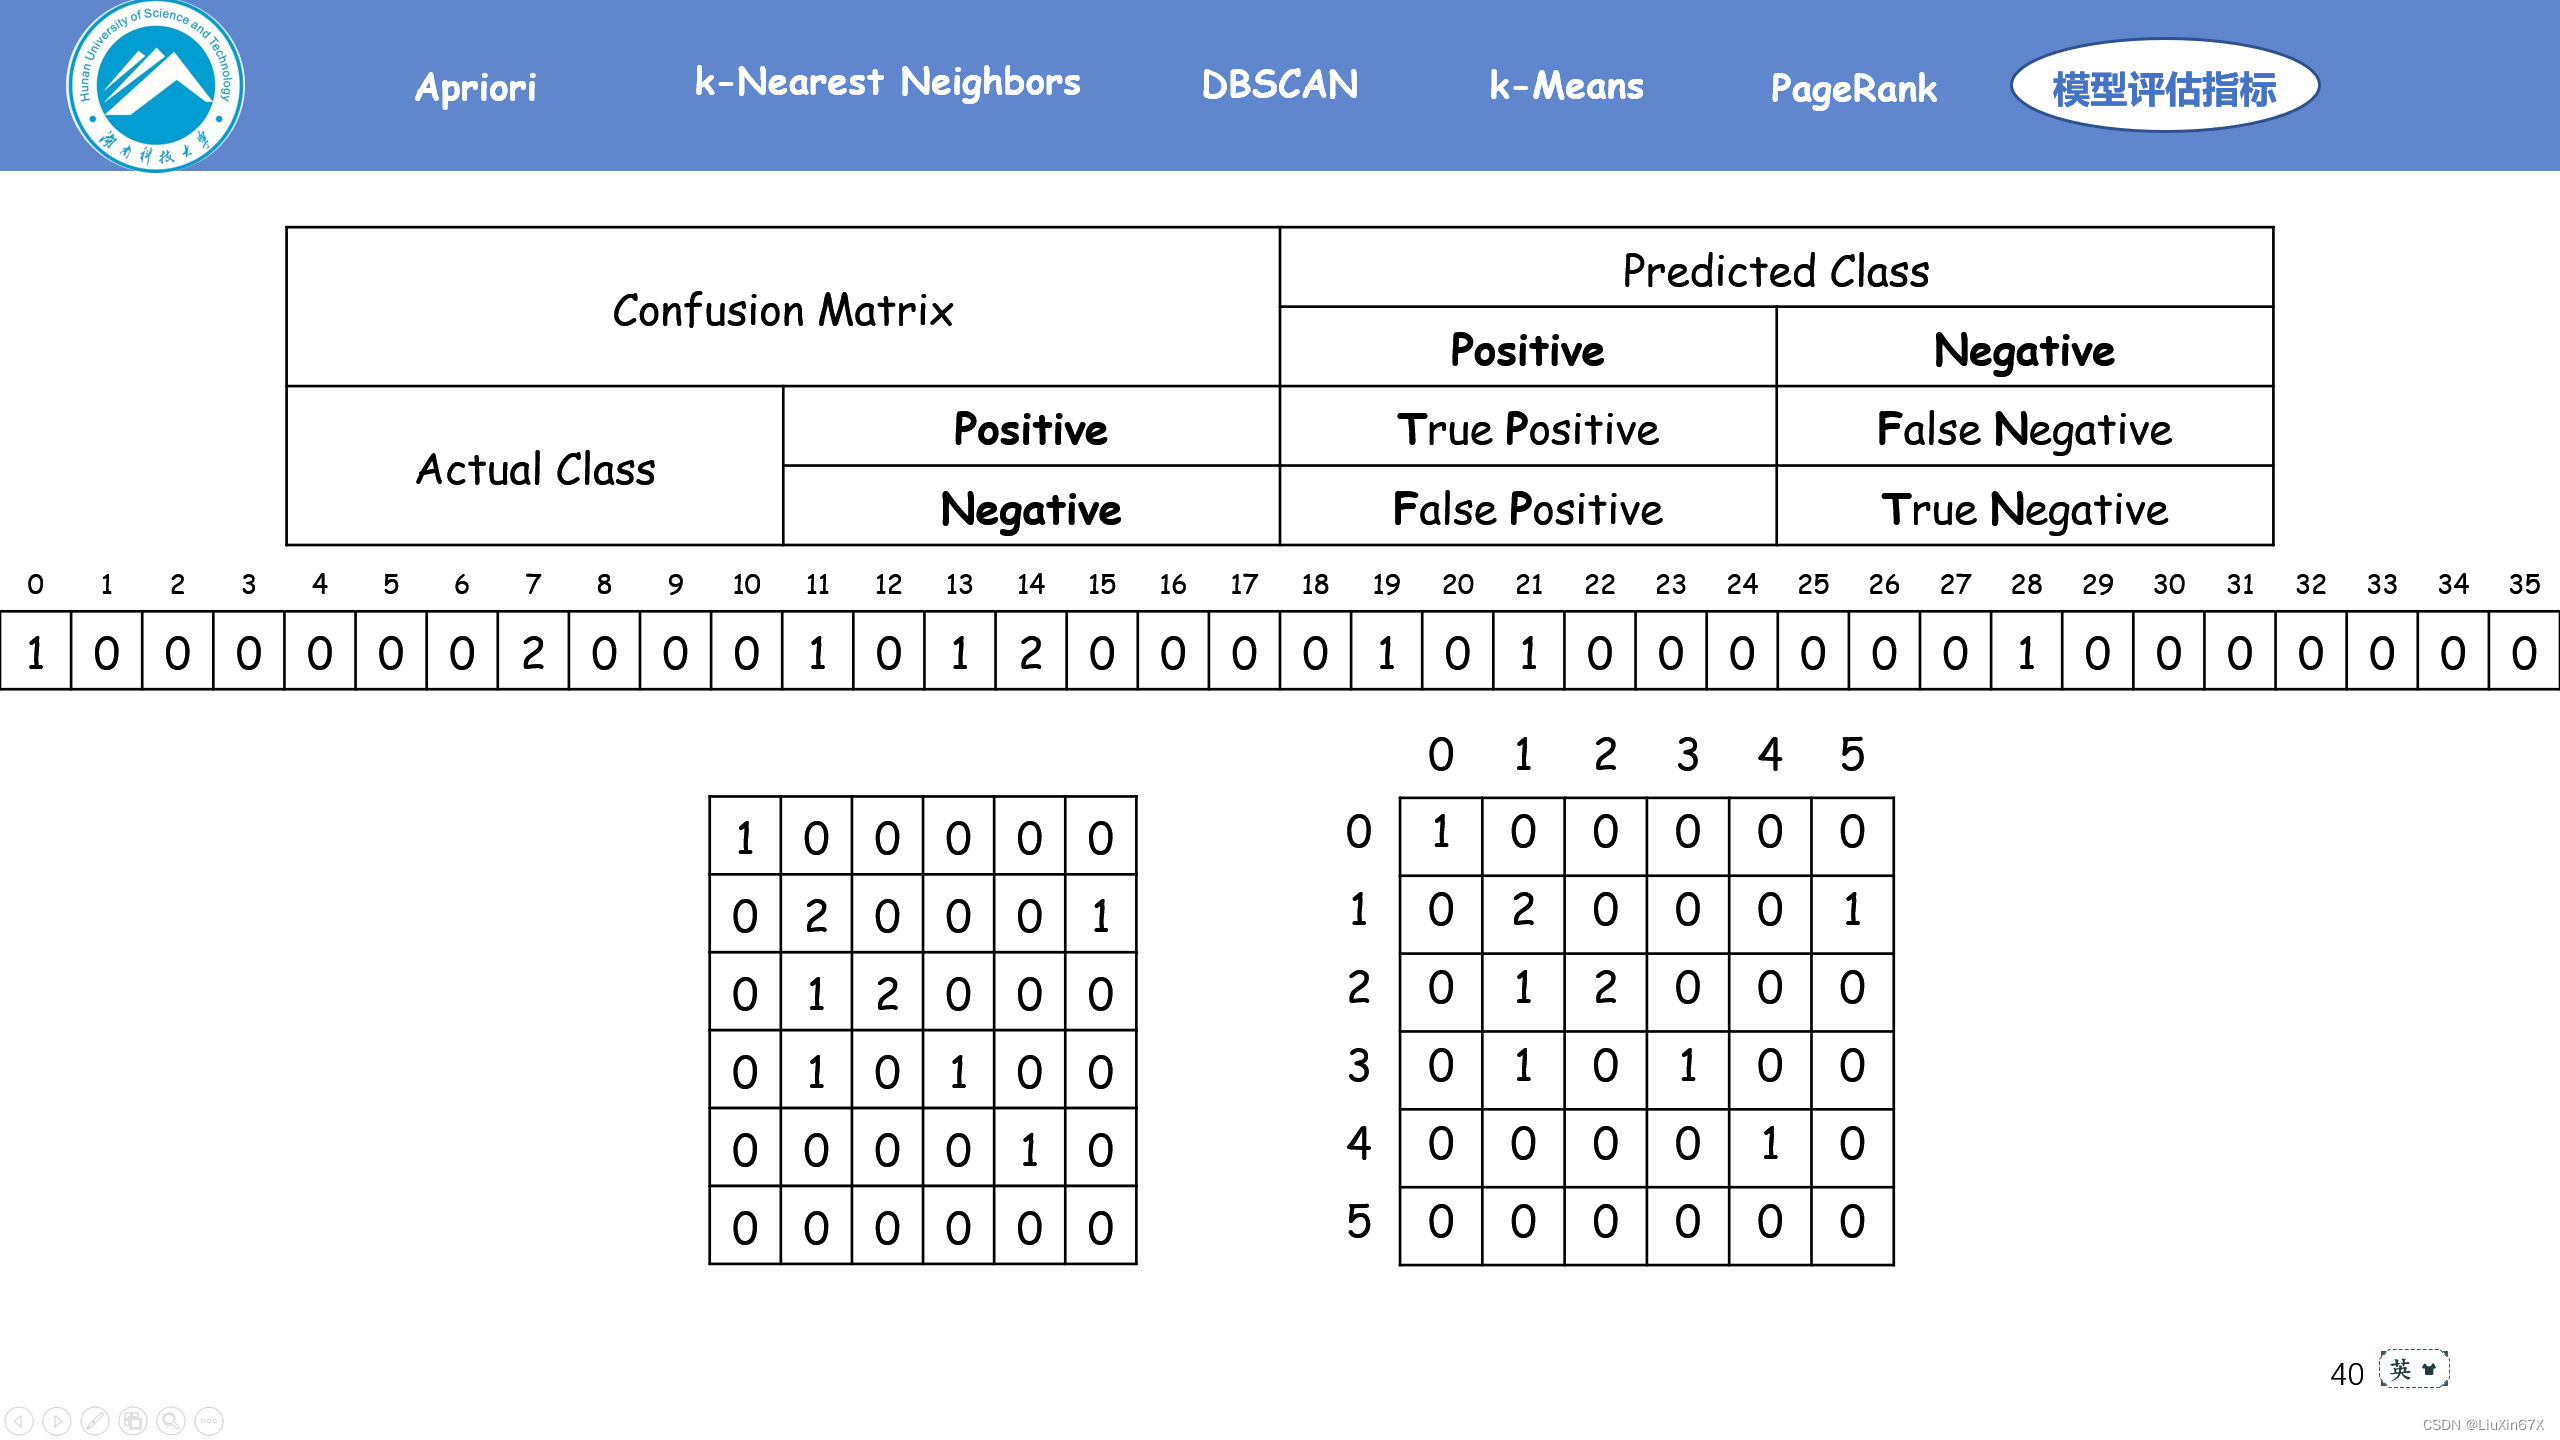
混淆矩阵(confusion matrix),又称为可能性表格或是错误矩阵。在机器学习领域是一种特定的矩阵用来呈现算法性能的可视化效果,通常是监督学习(非监督学习,通常用匹配矩阵:matching matrix)。其每一列代表预测值,每一行代表的是实际的类别。这个名字来源于它可以非常容易的表明多个类别是否有混淆(也就是一个class被预测成另一个class)。
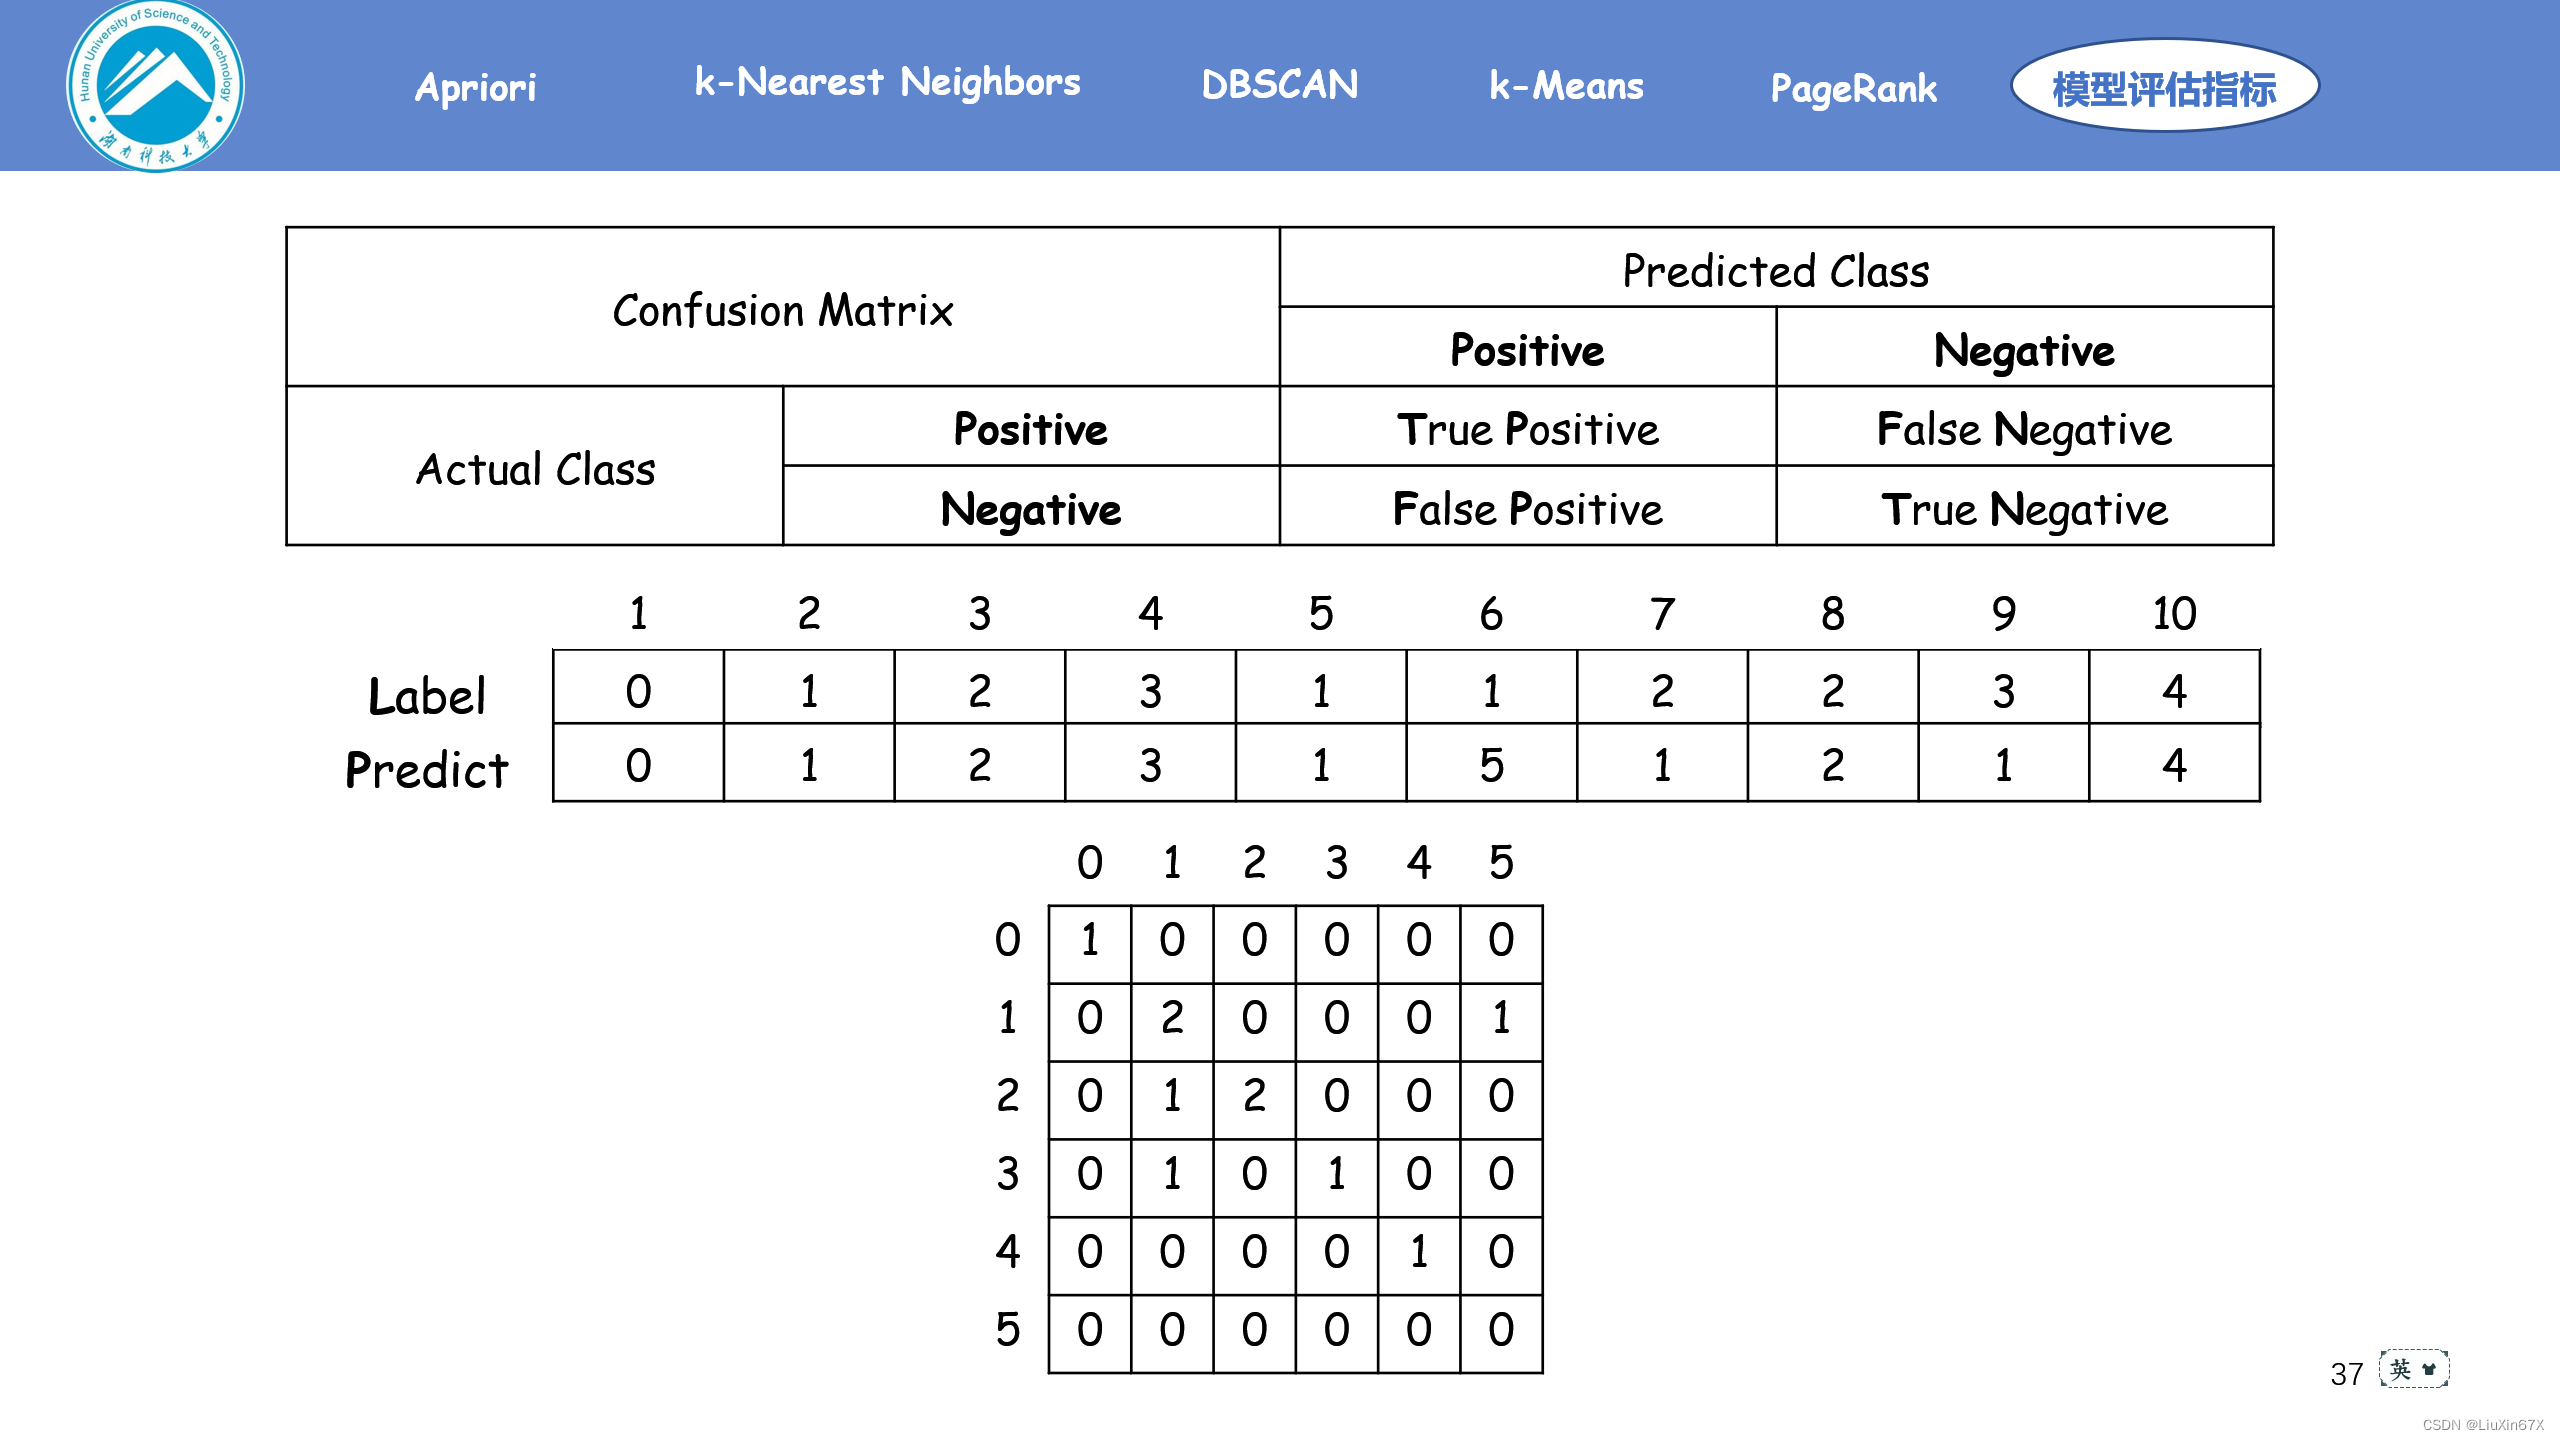
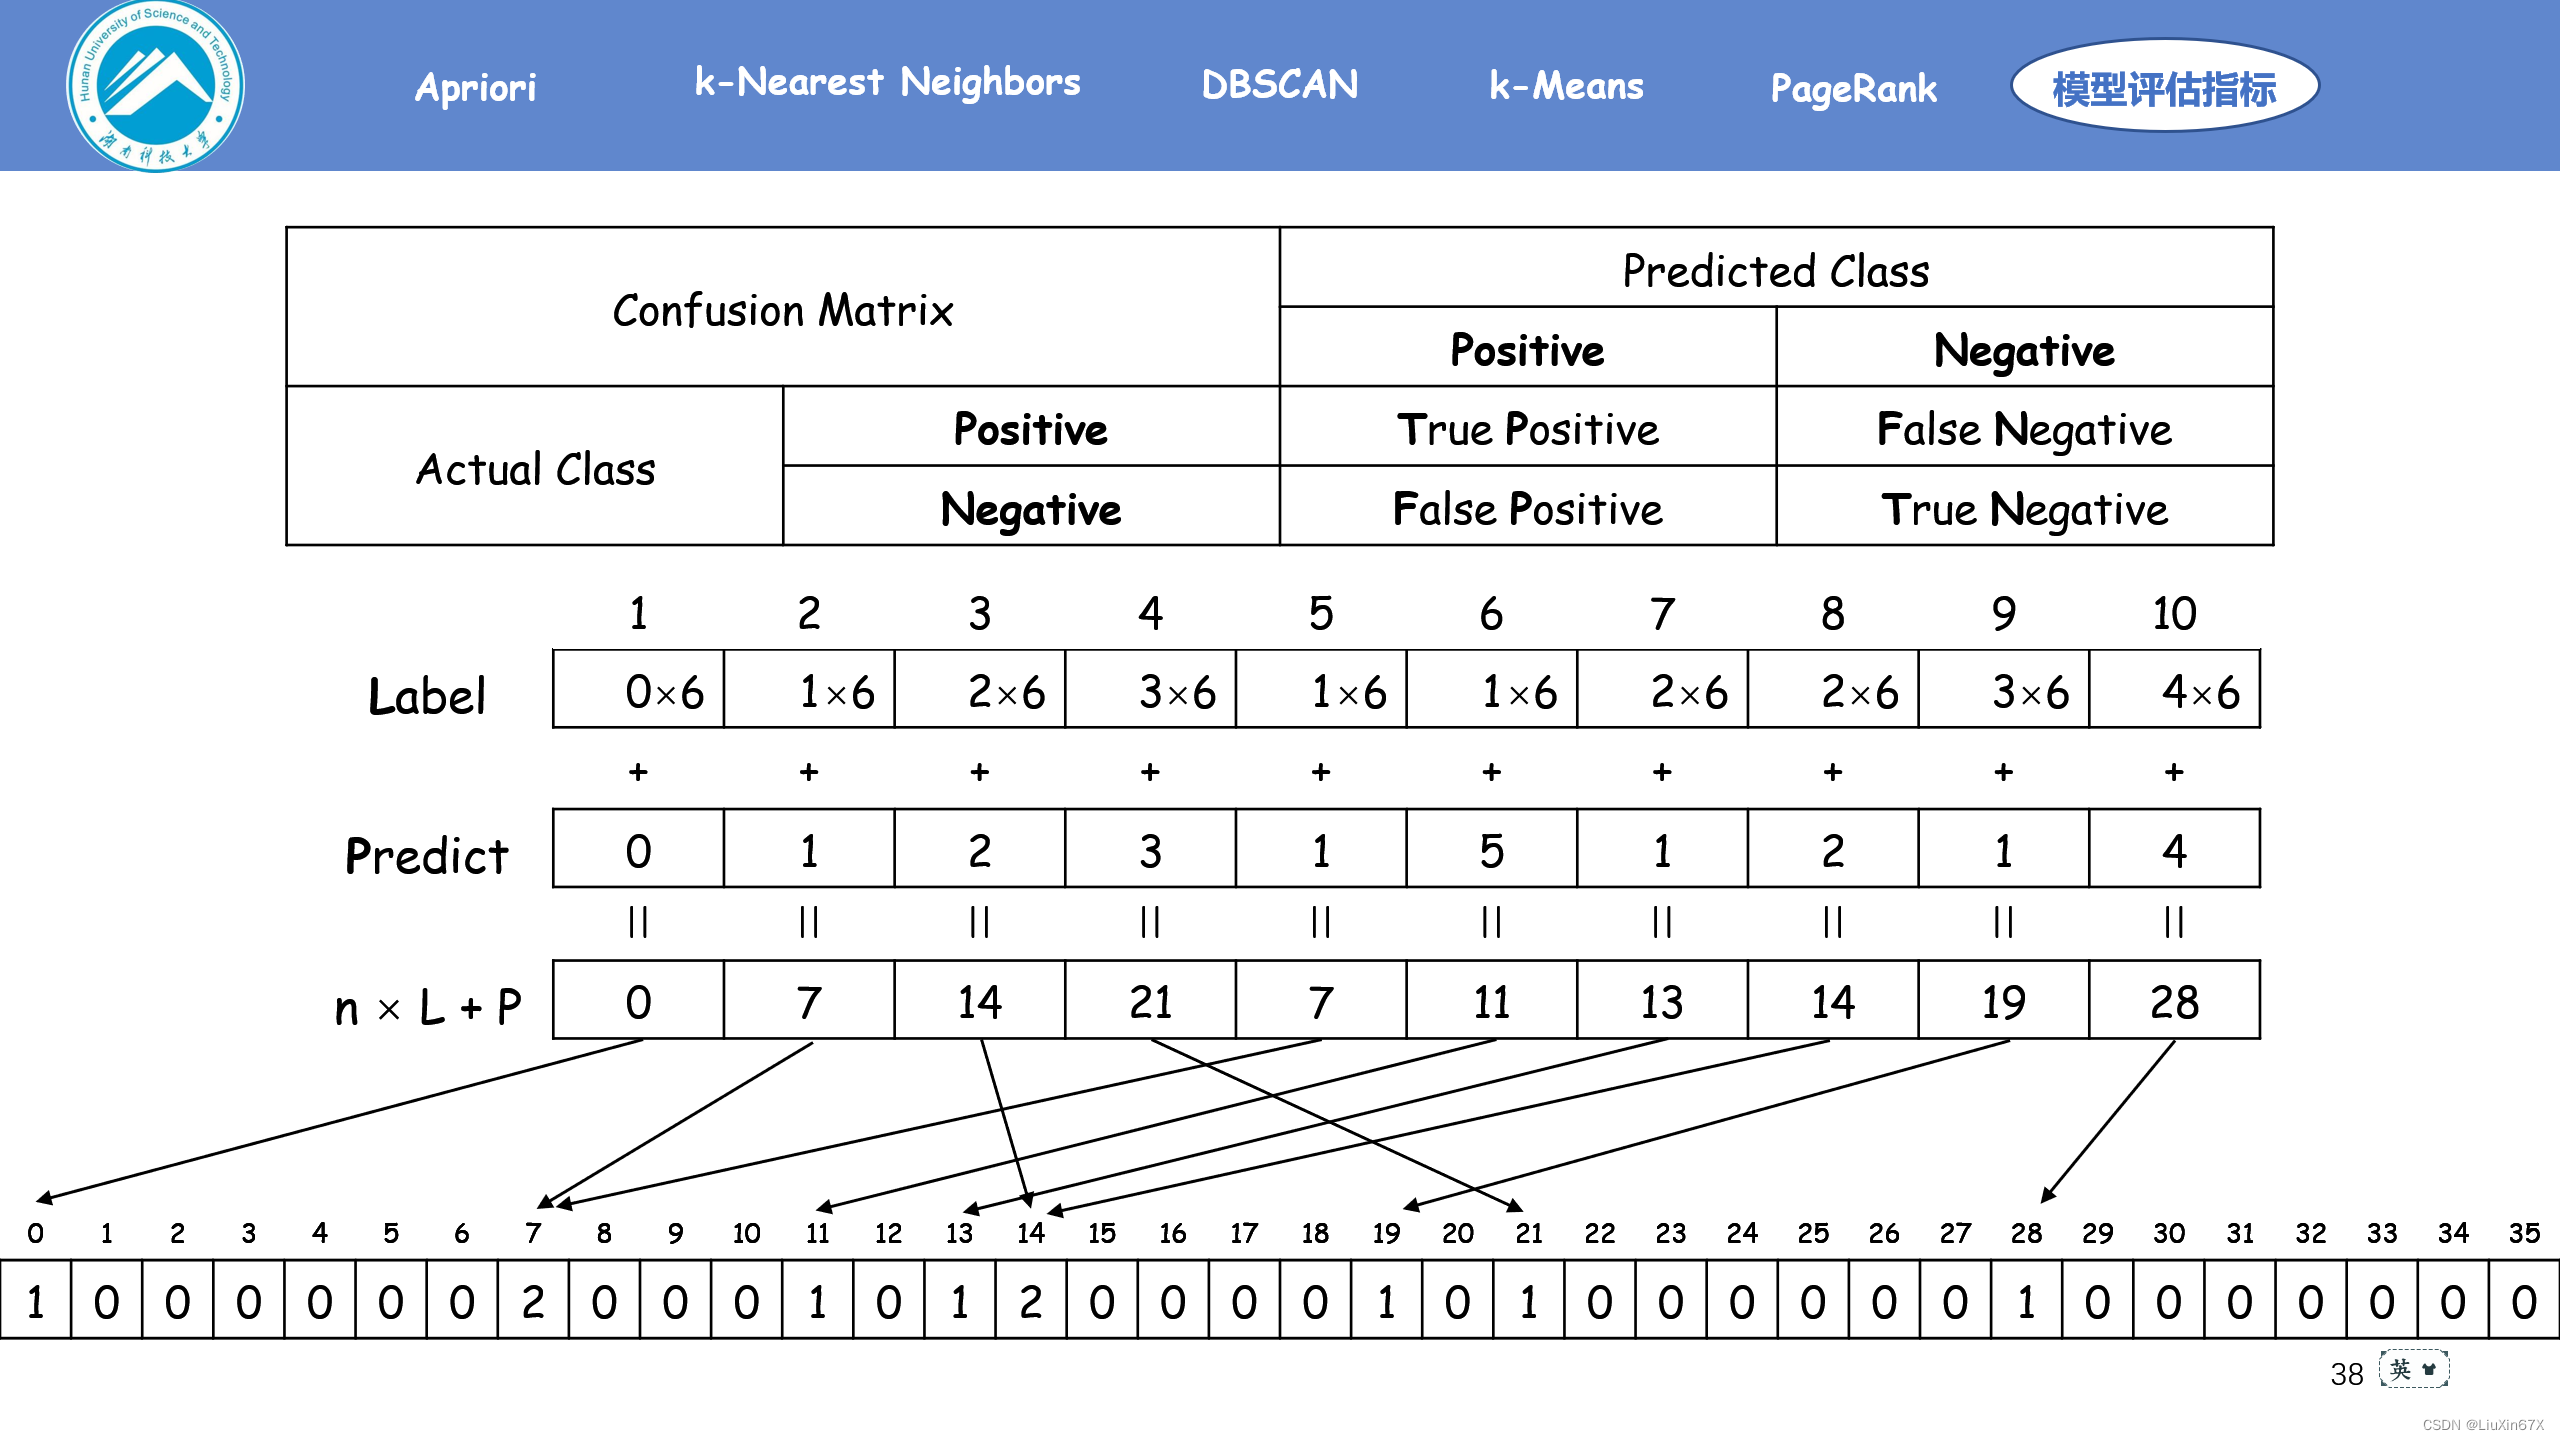
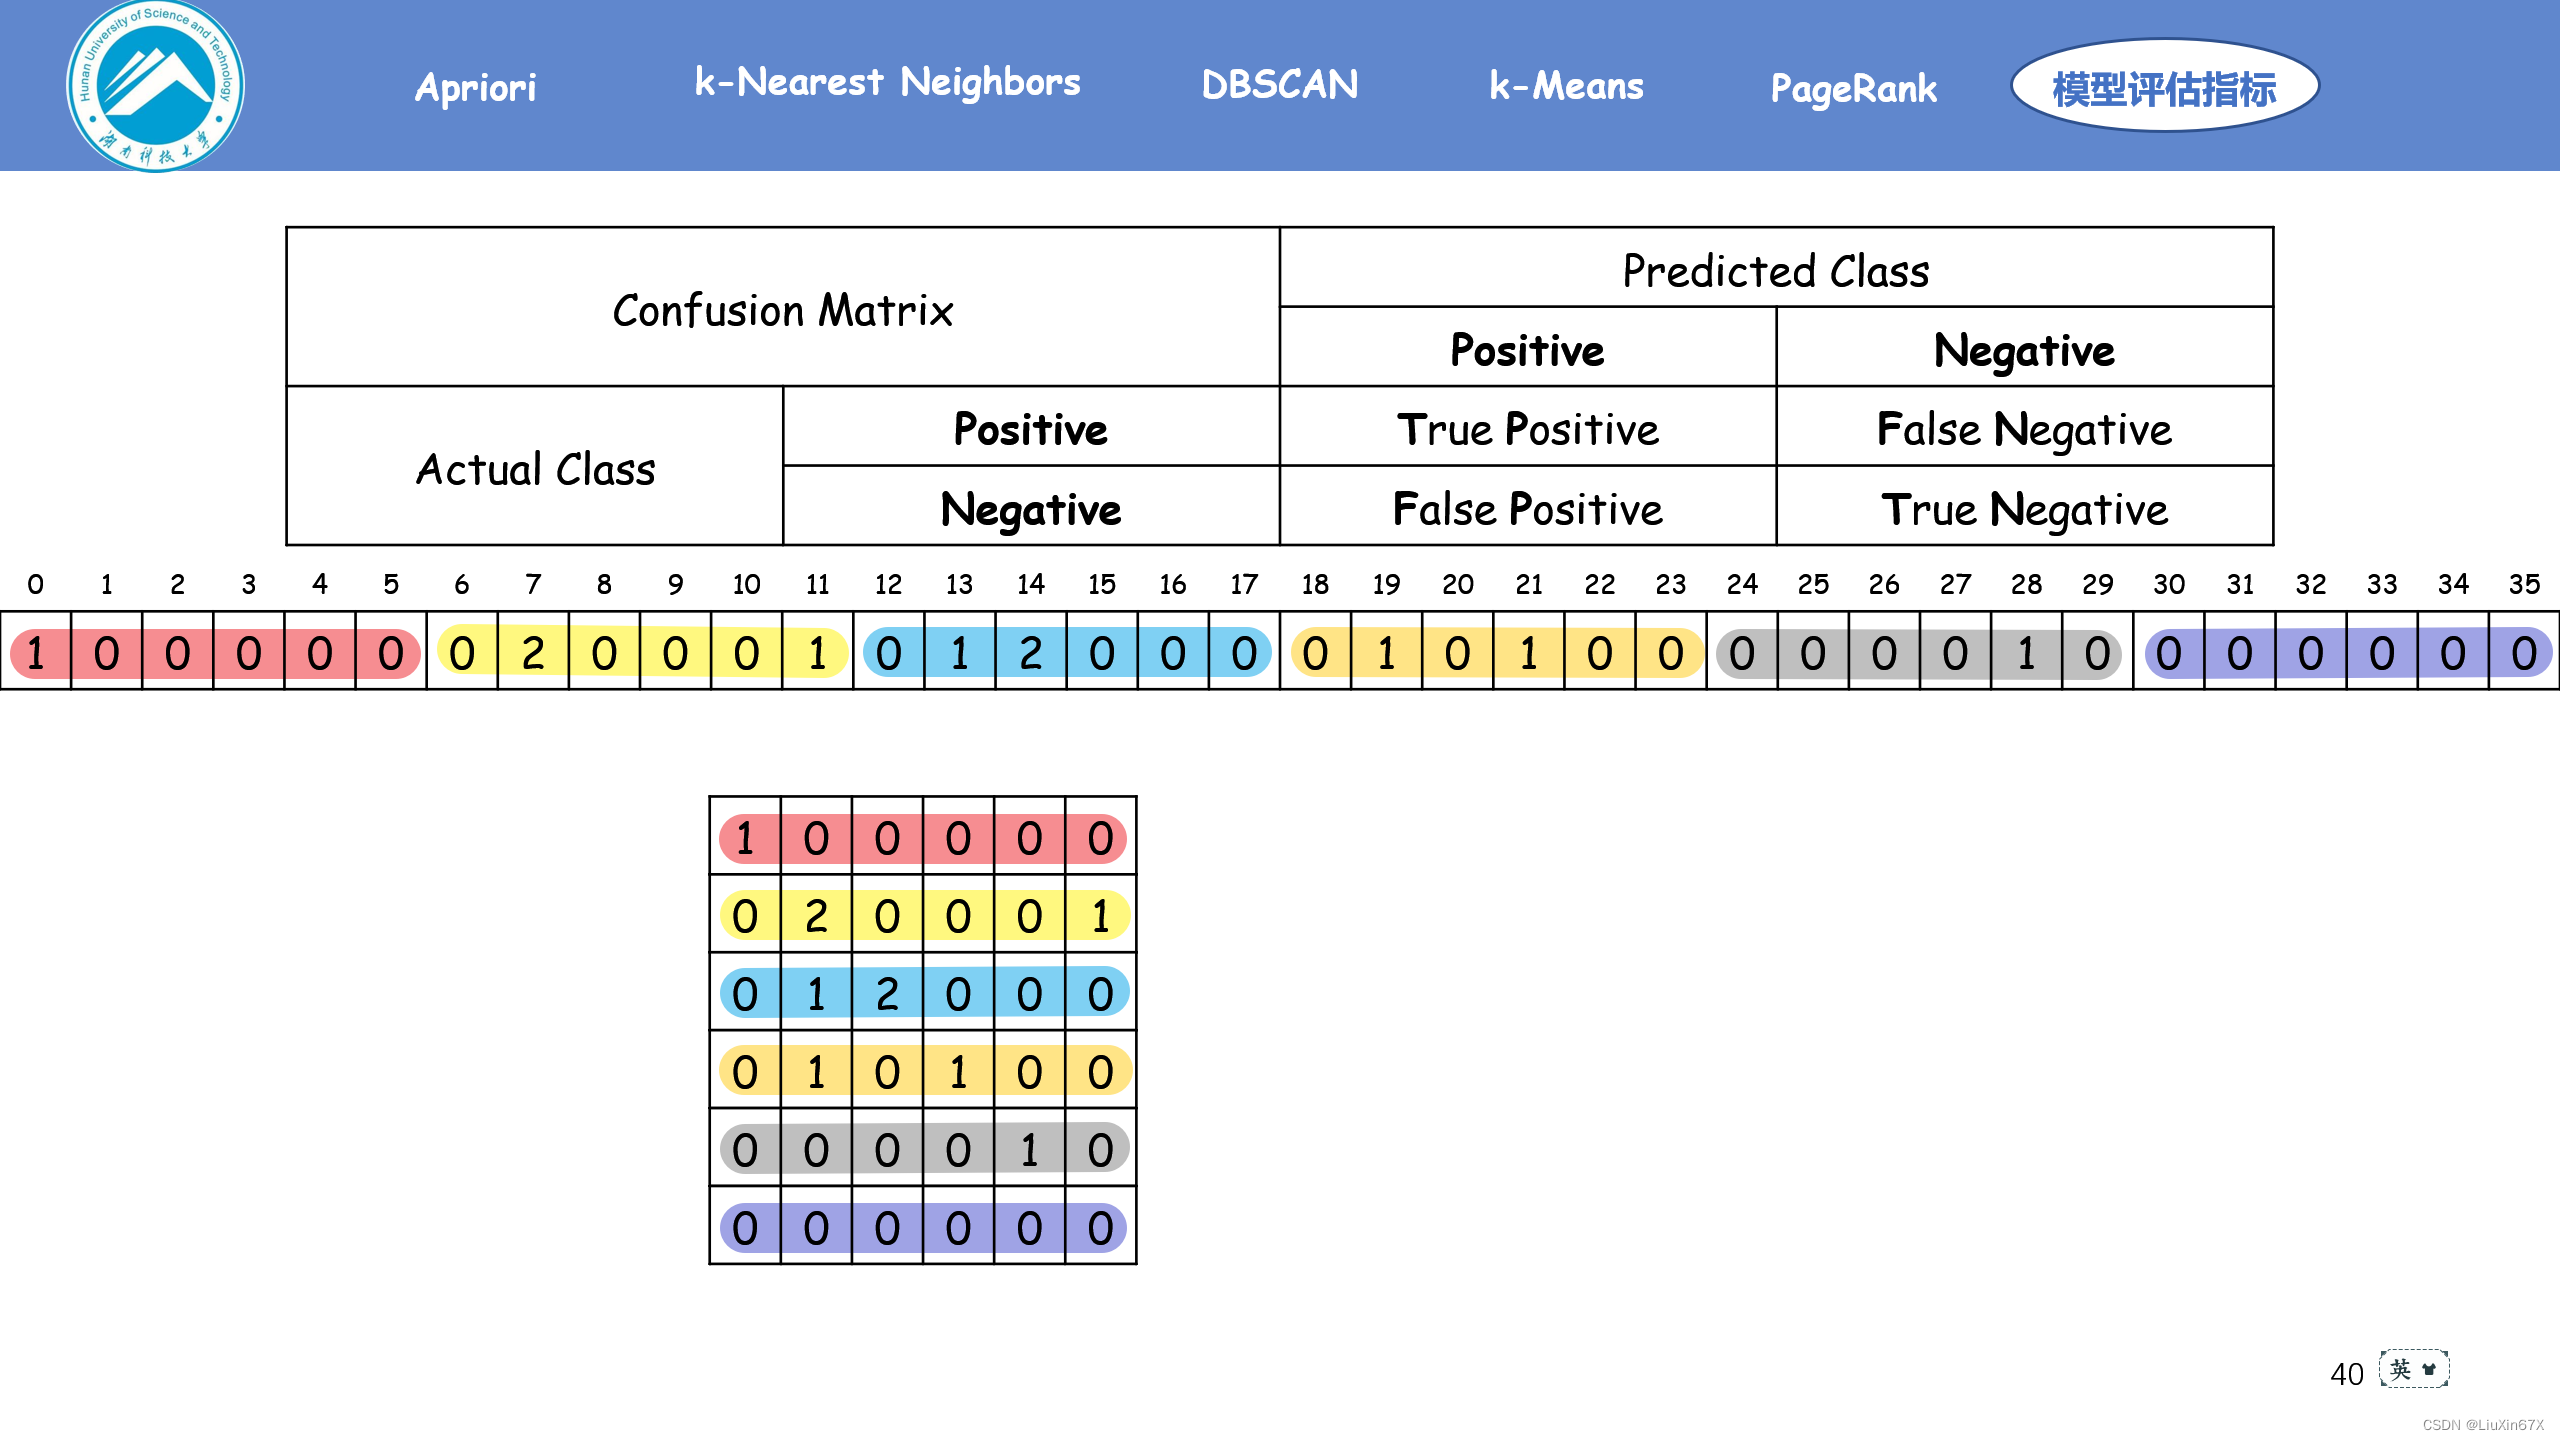
2、计算方法
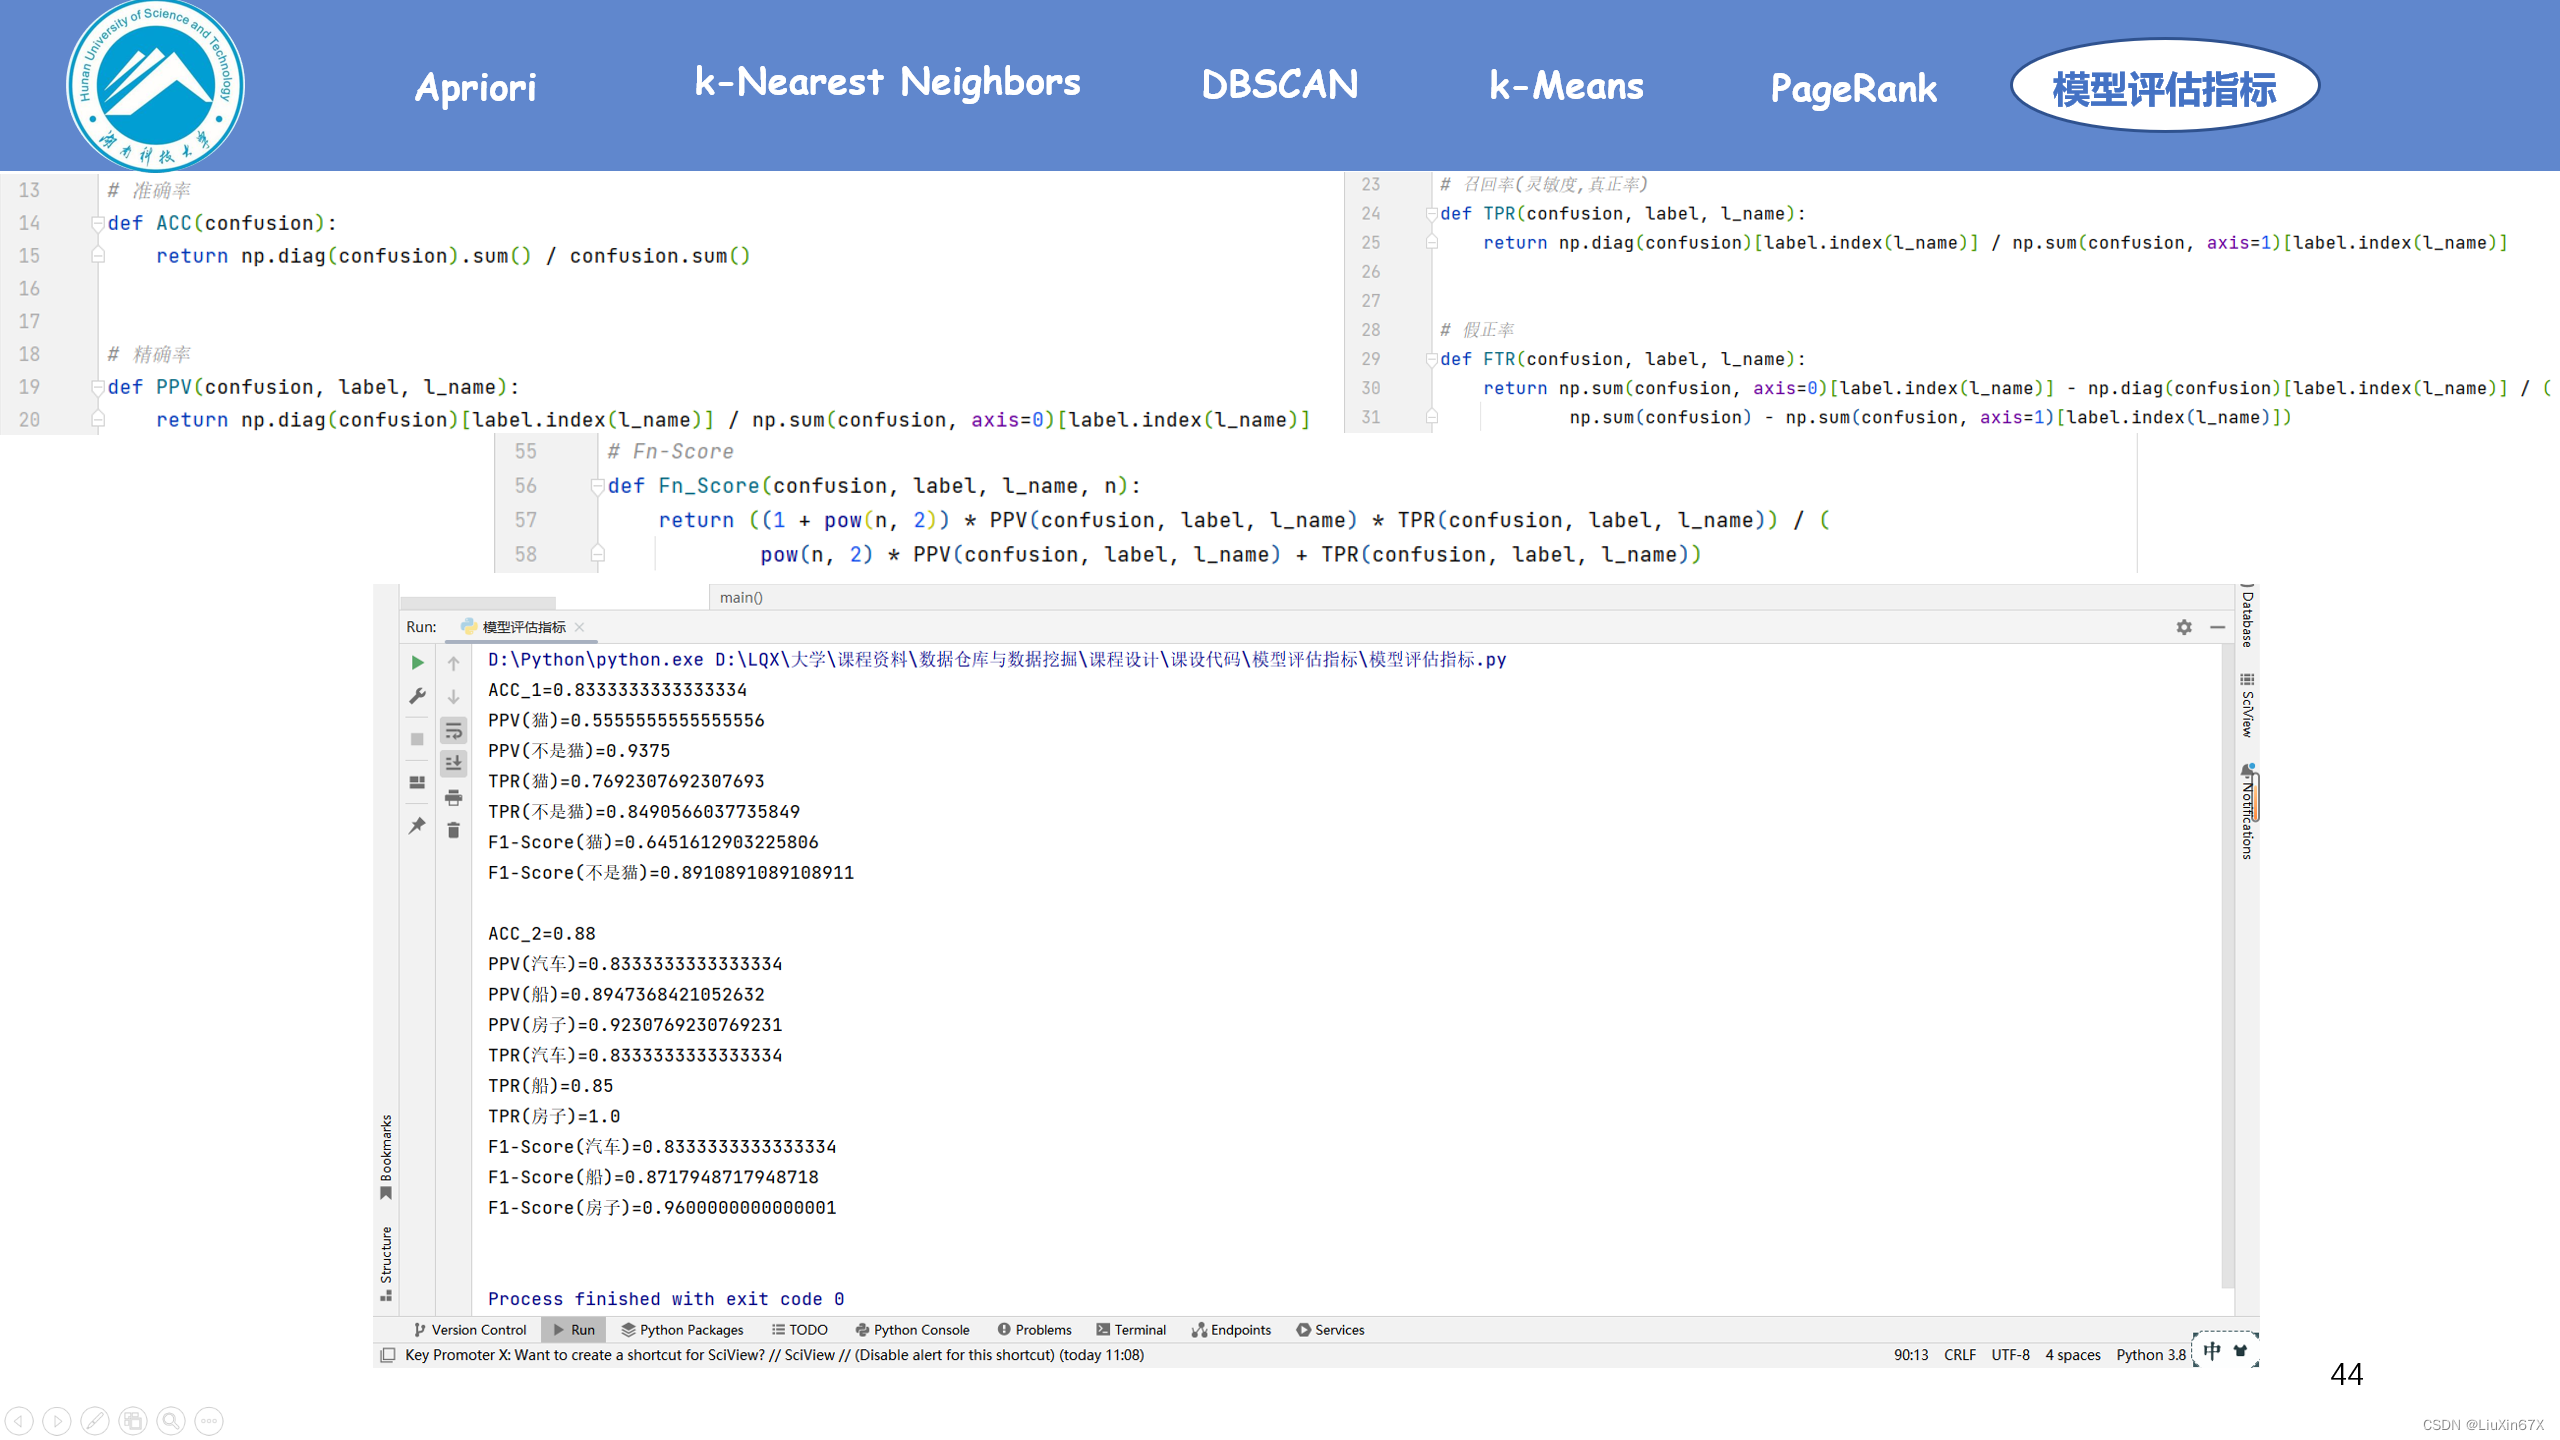
3、关键源码展示
二、混淆矩阵的二级指标与三级指标
1、基本概念
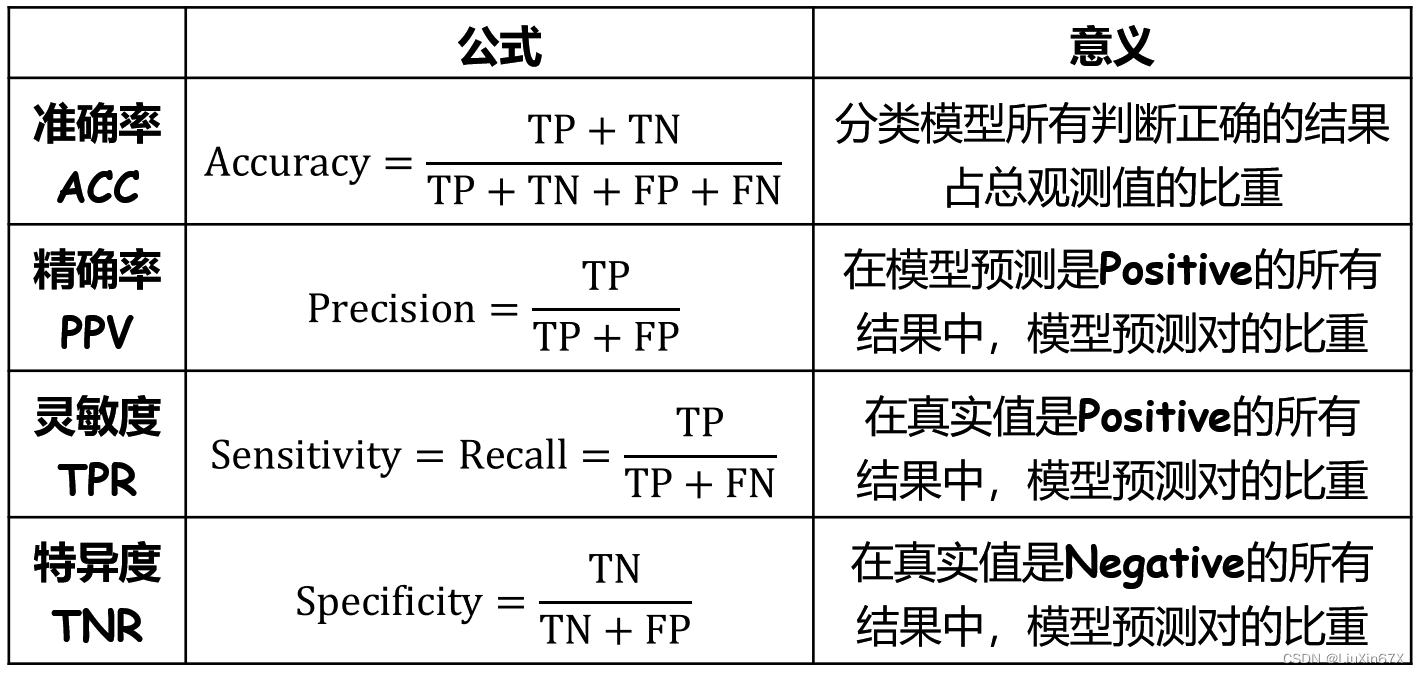
预测性分类模型肯定是希望越准越好。那么对应到混淆矩阵中是希望TP与TN的数量大,而FP与FN的数量小。所以当我们得到了模型的混淆矩阵后,就需要去看有多少观测值在第二、四象限对应的位置,这里的数值越多越好;反之,在第一、三象限对应位置出现的观测值肯定是越少越好。
但是,混淆矩阵里面统计的是个数,有时候面对大量的数据,光凭算个数,很难衡量模型的优劣。因此混淆矩阵在基本统计结果上又延伸了混淆矩阵的二级指标。
混淆矩阵的三级指标一般指𝐹[𝛽−𝑆𝑐𝑜𝑟𝑒],又称平衡𝐹[𝛽]分数,被定义为精确率和召回率的调和平均数:
𝛽一般取1,有时也会取2或0.5。
2、关键源码展示
三、ROC曲线
1、基本概念
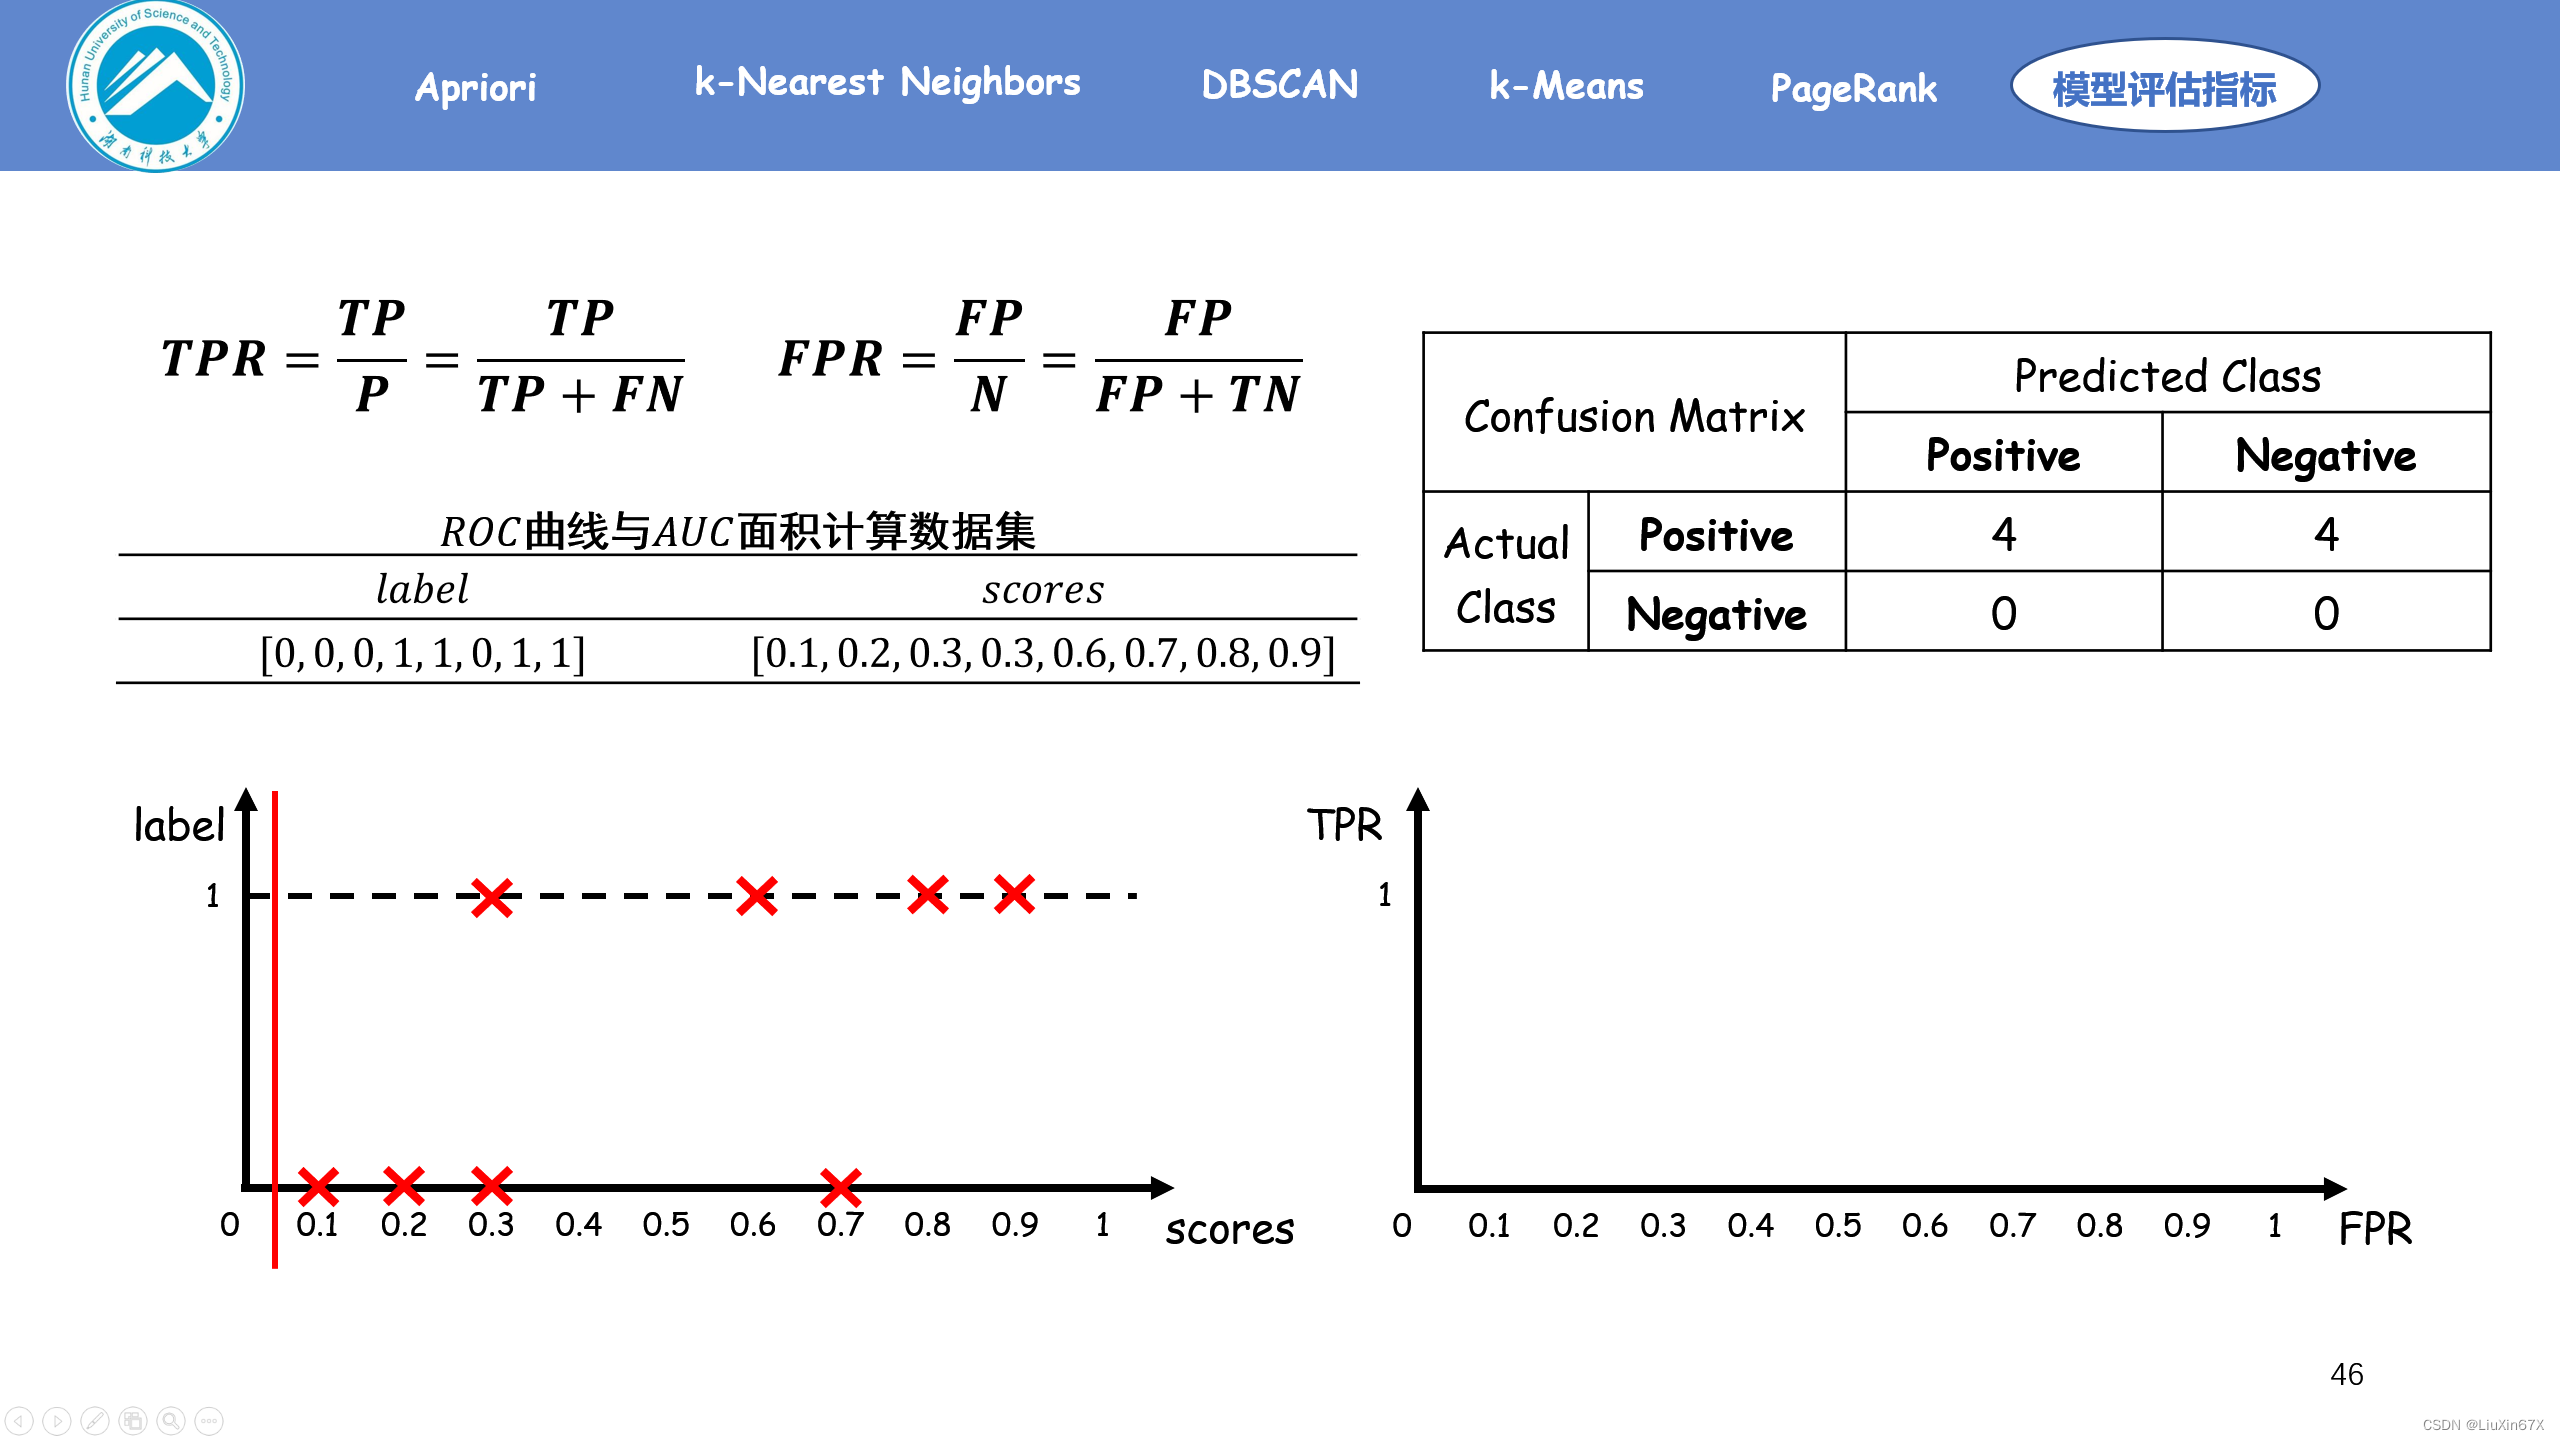
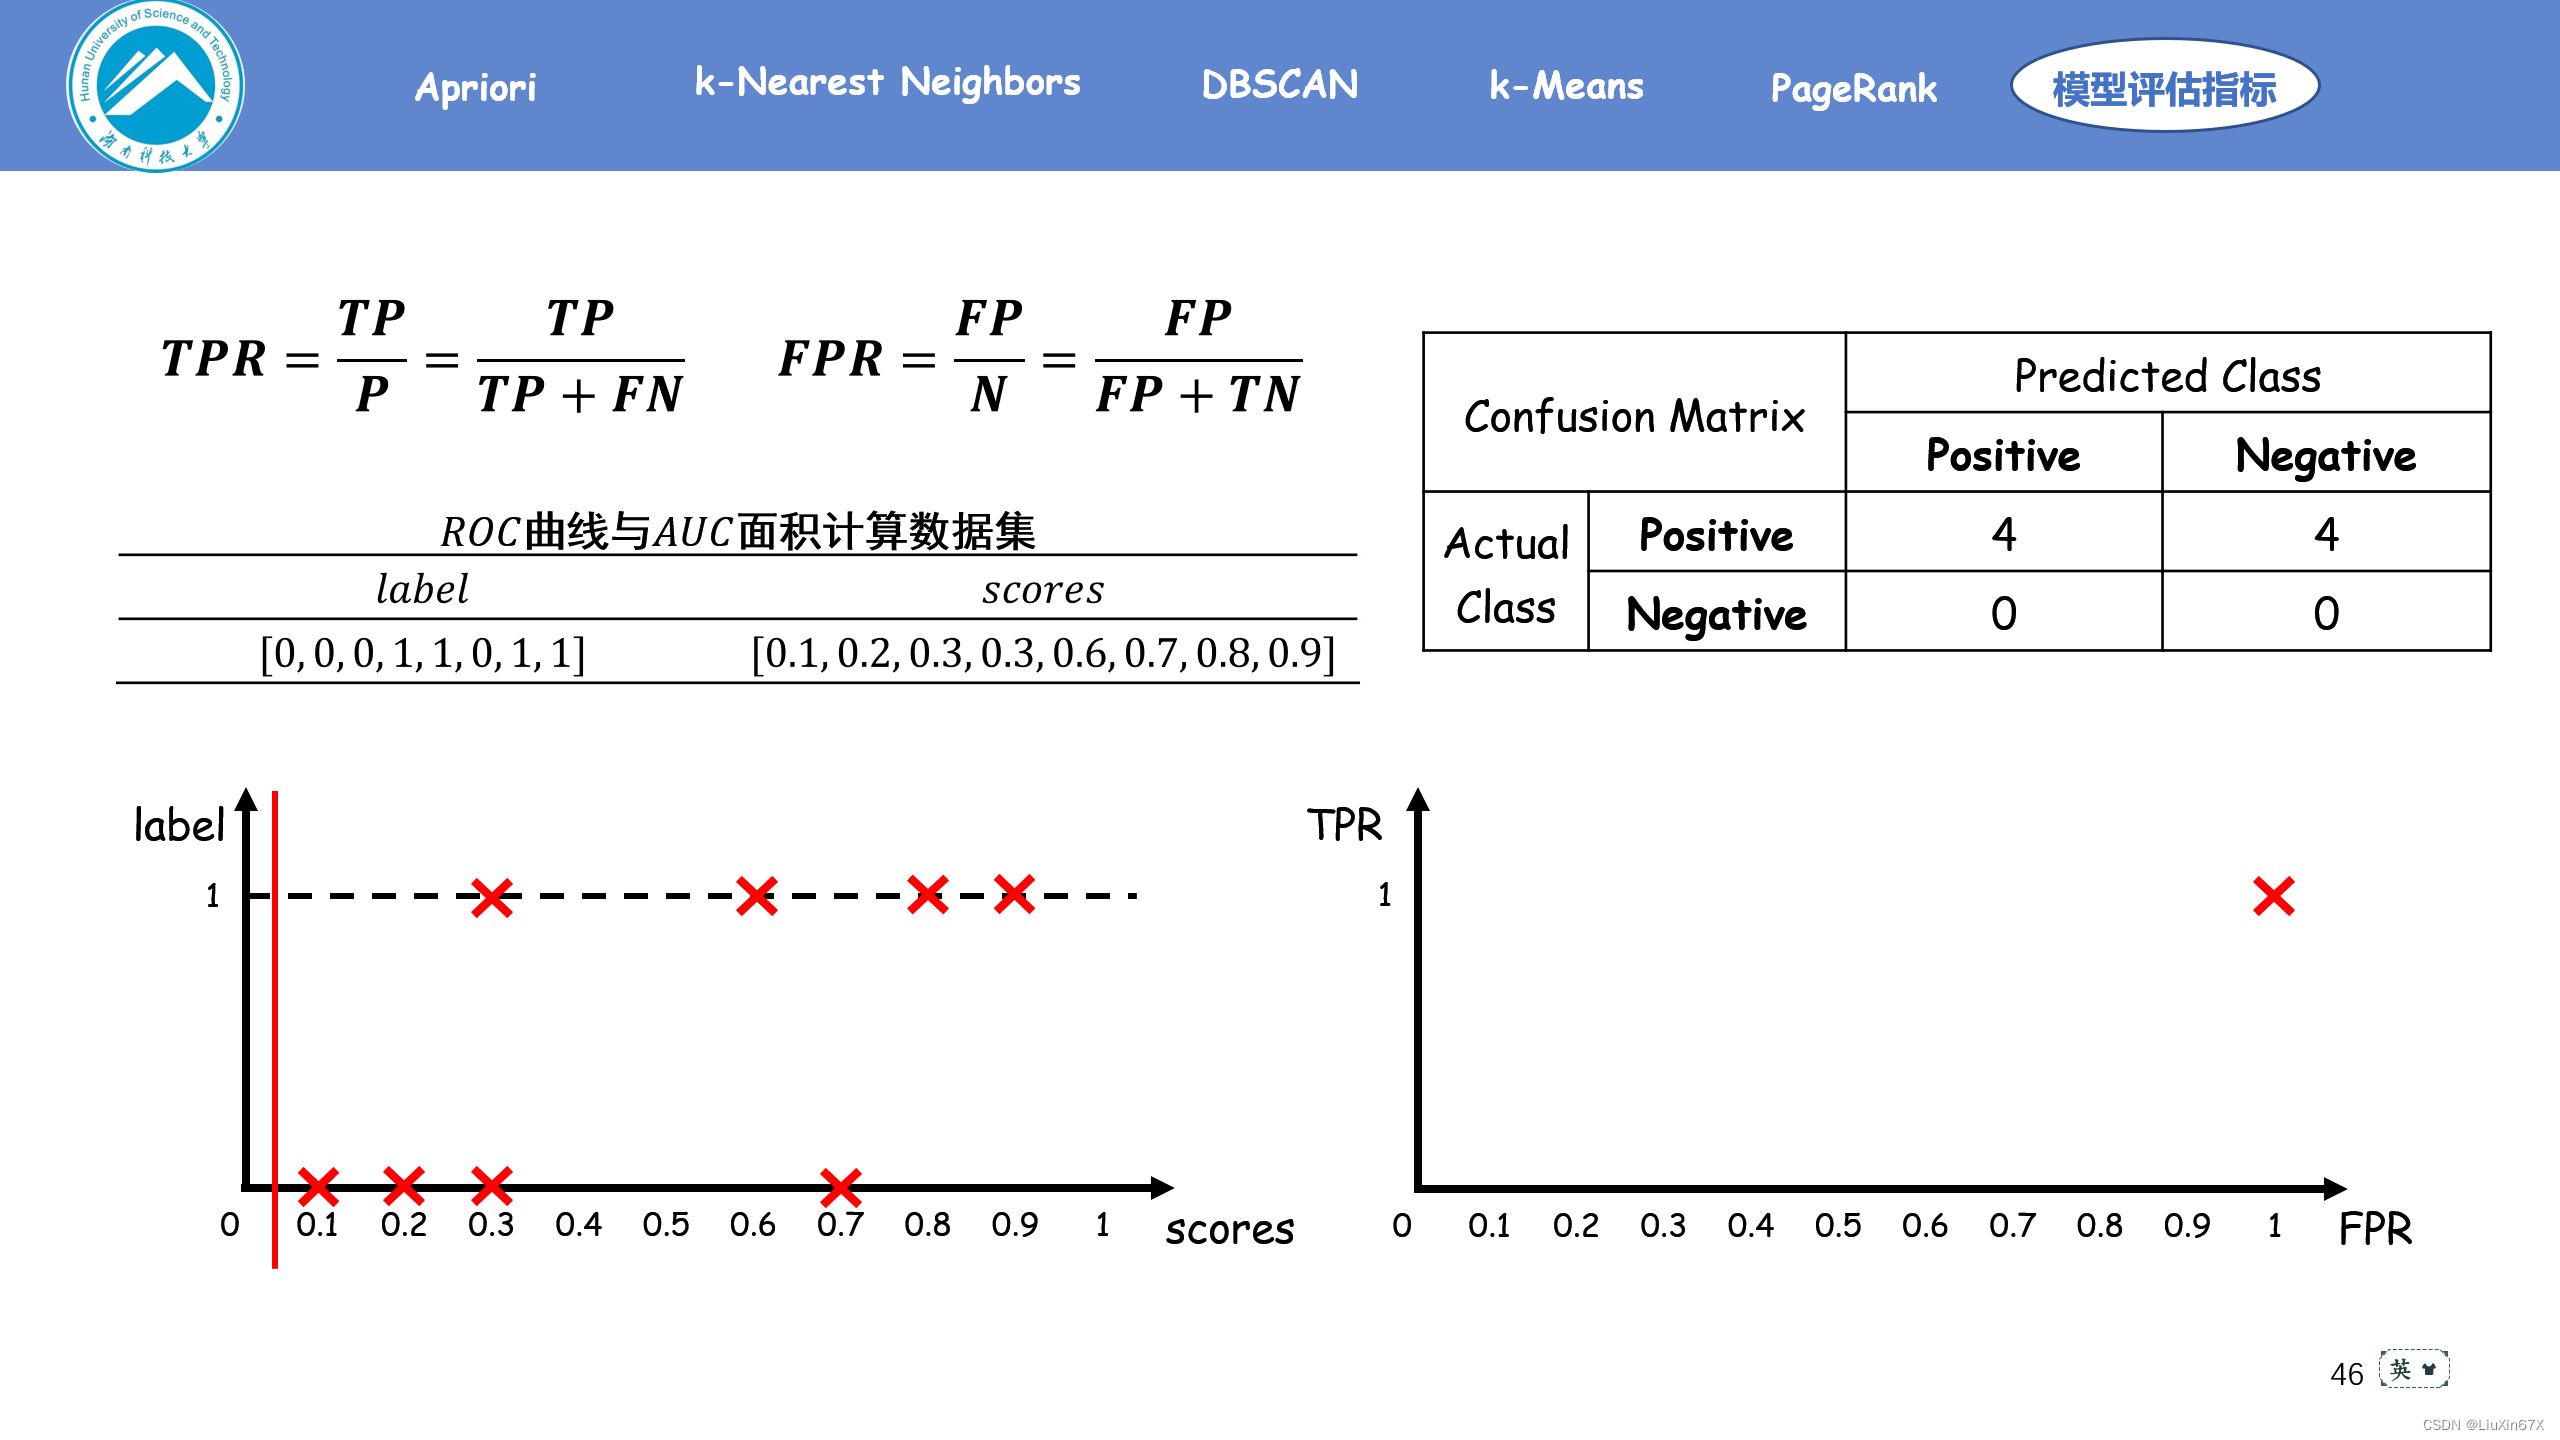
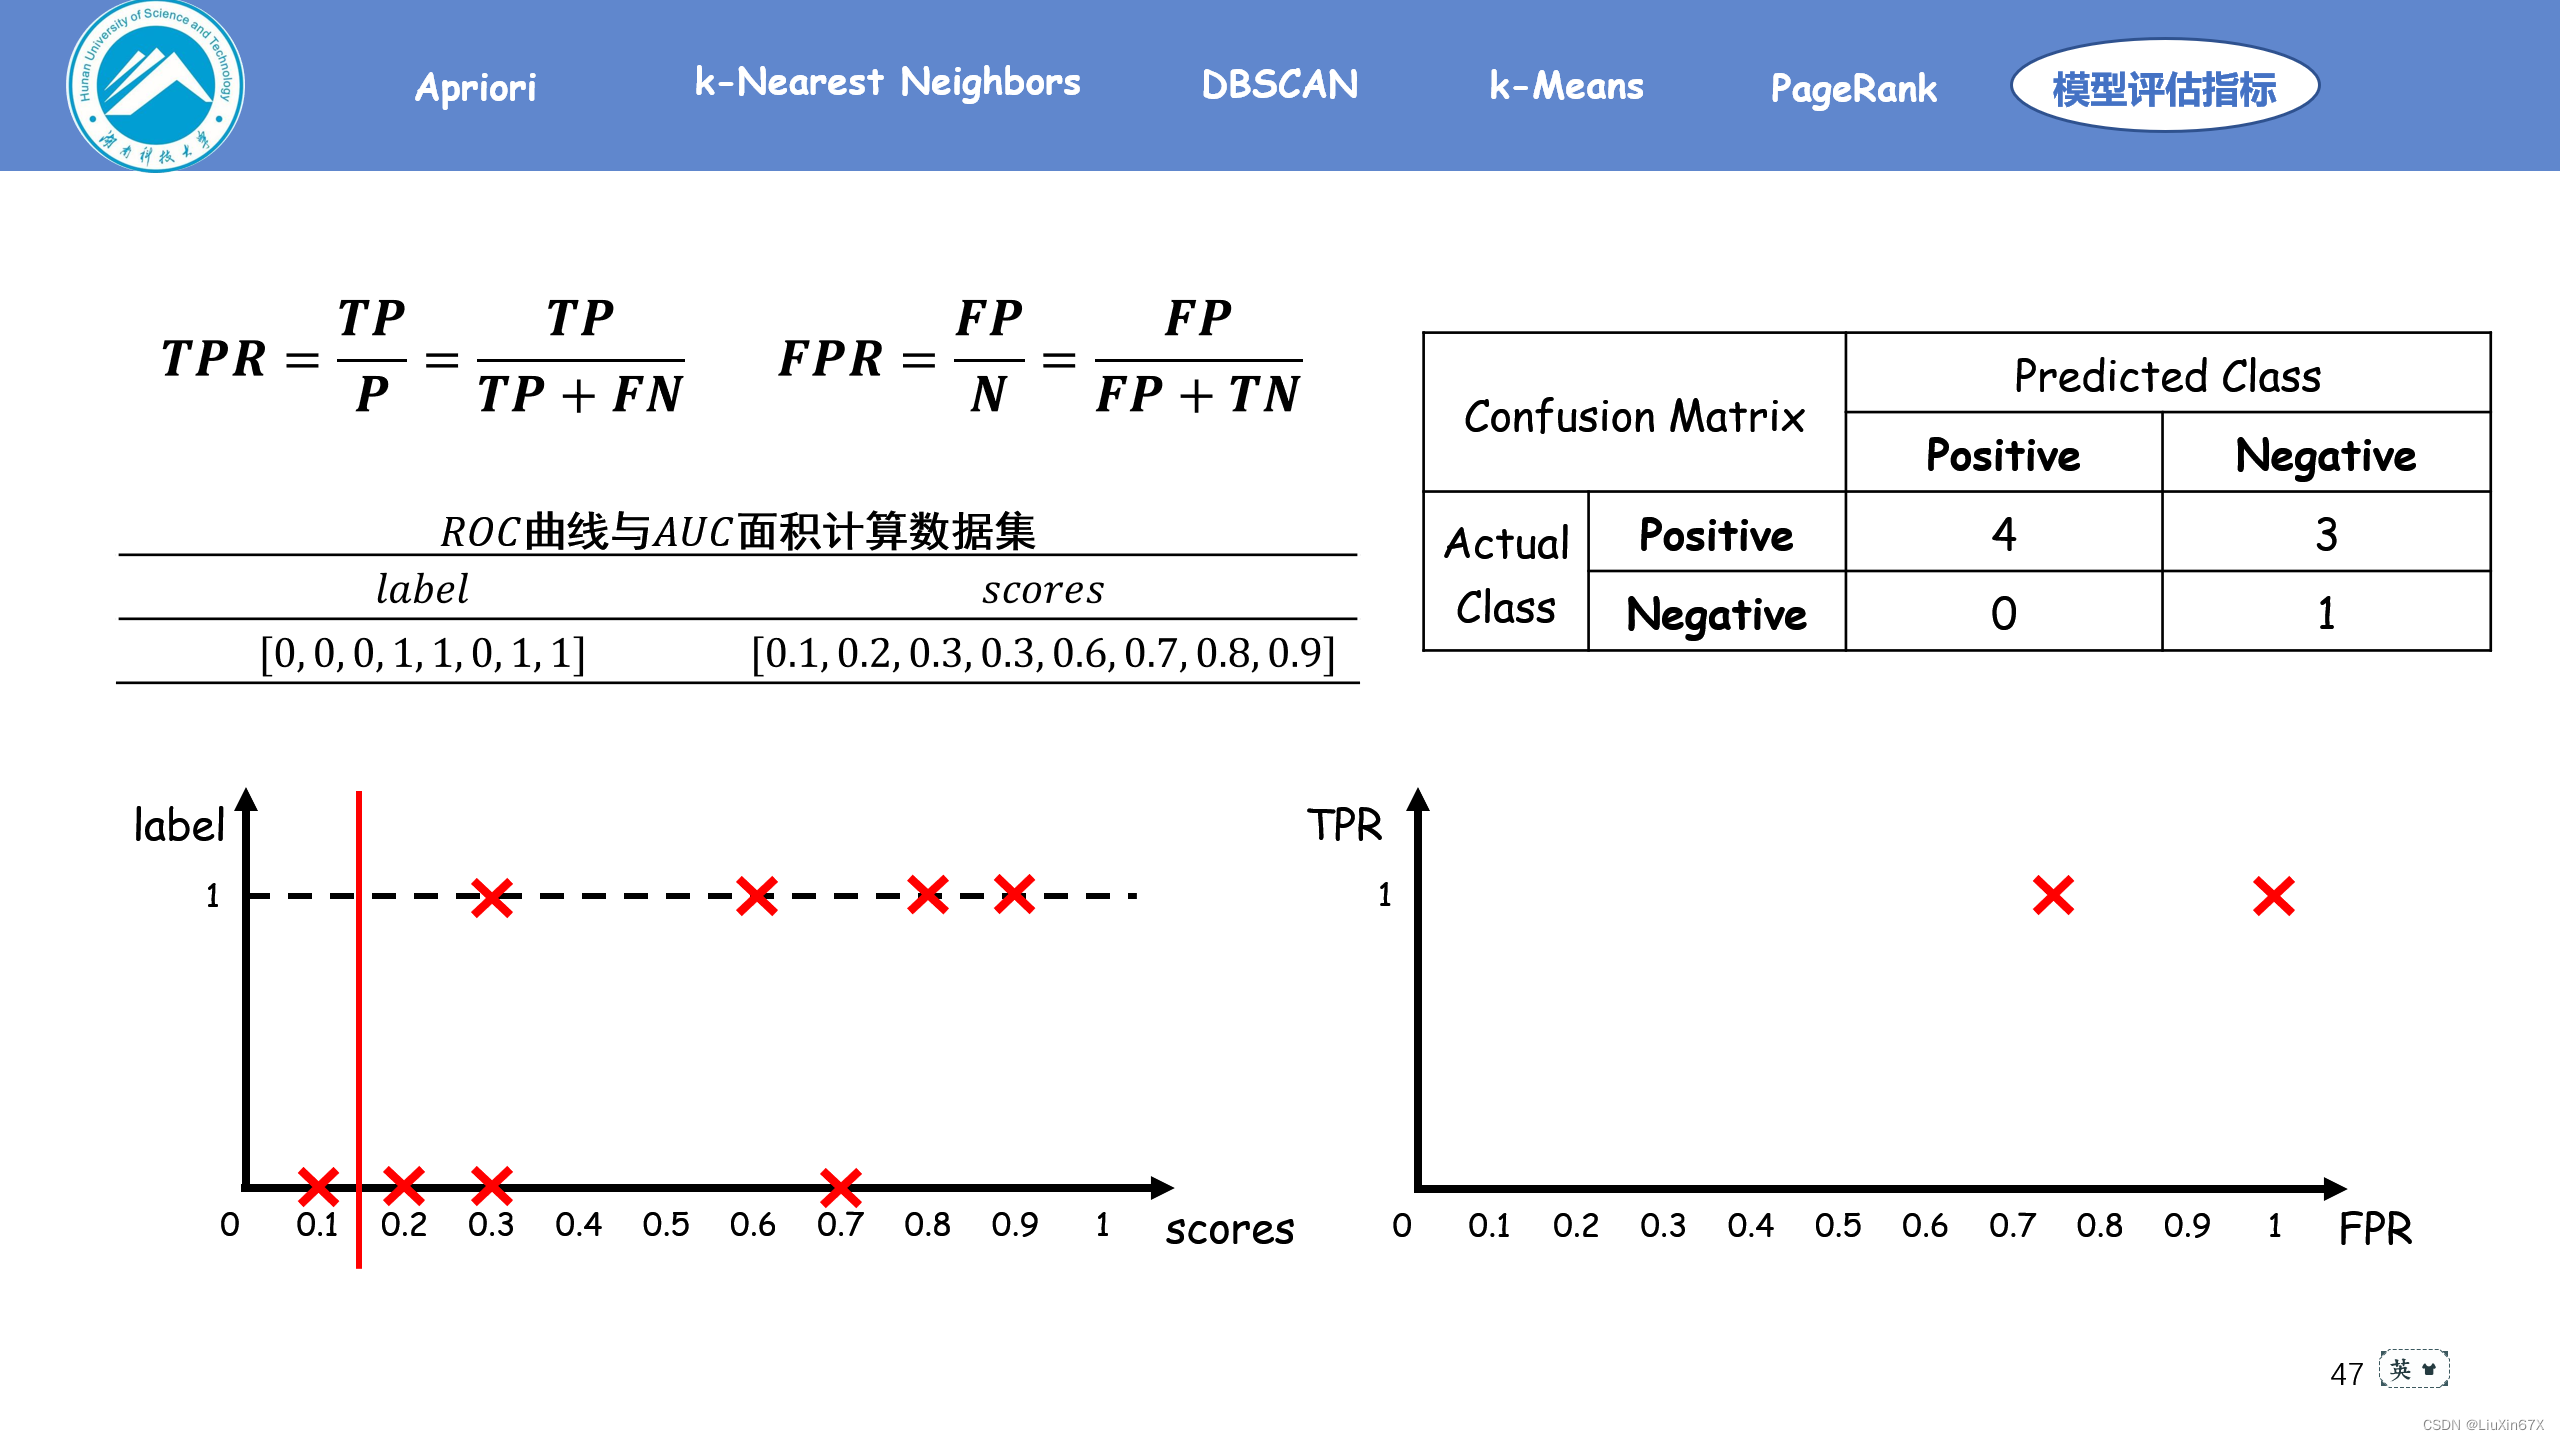
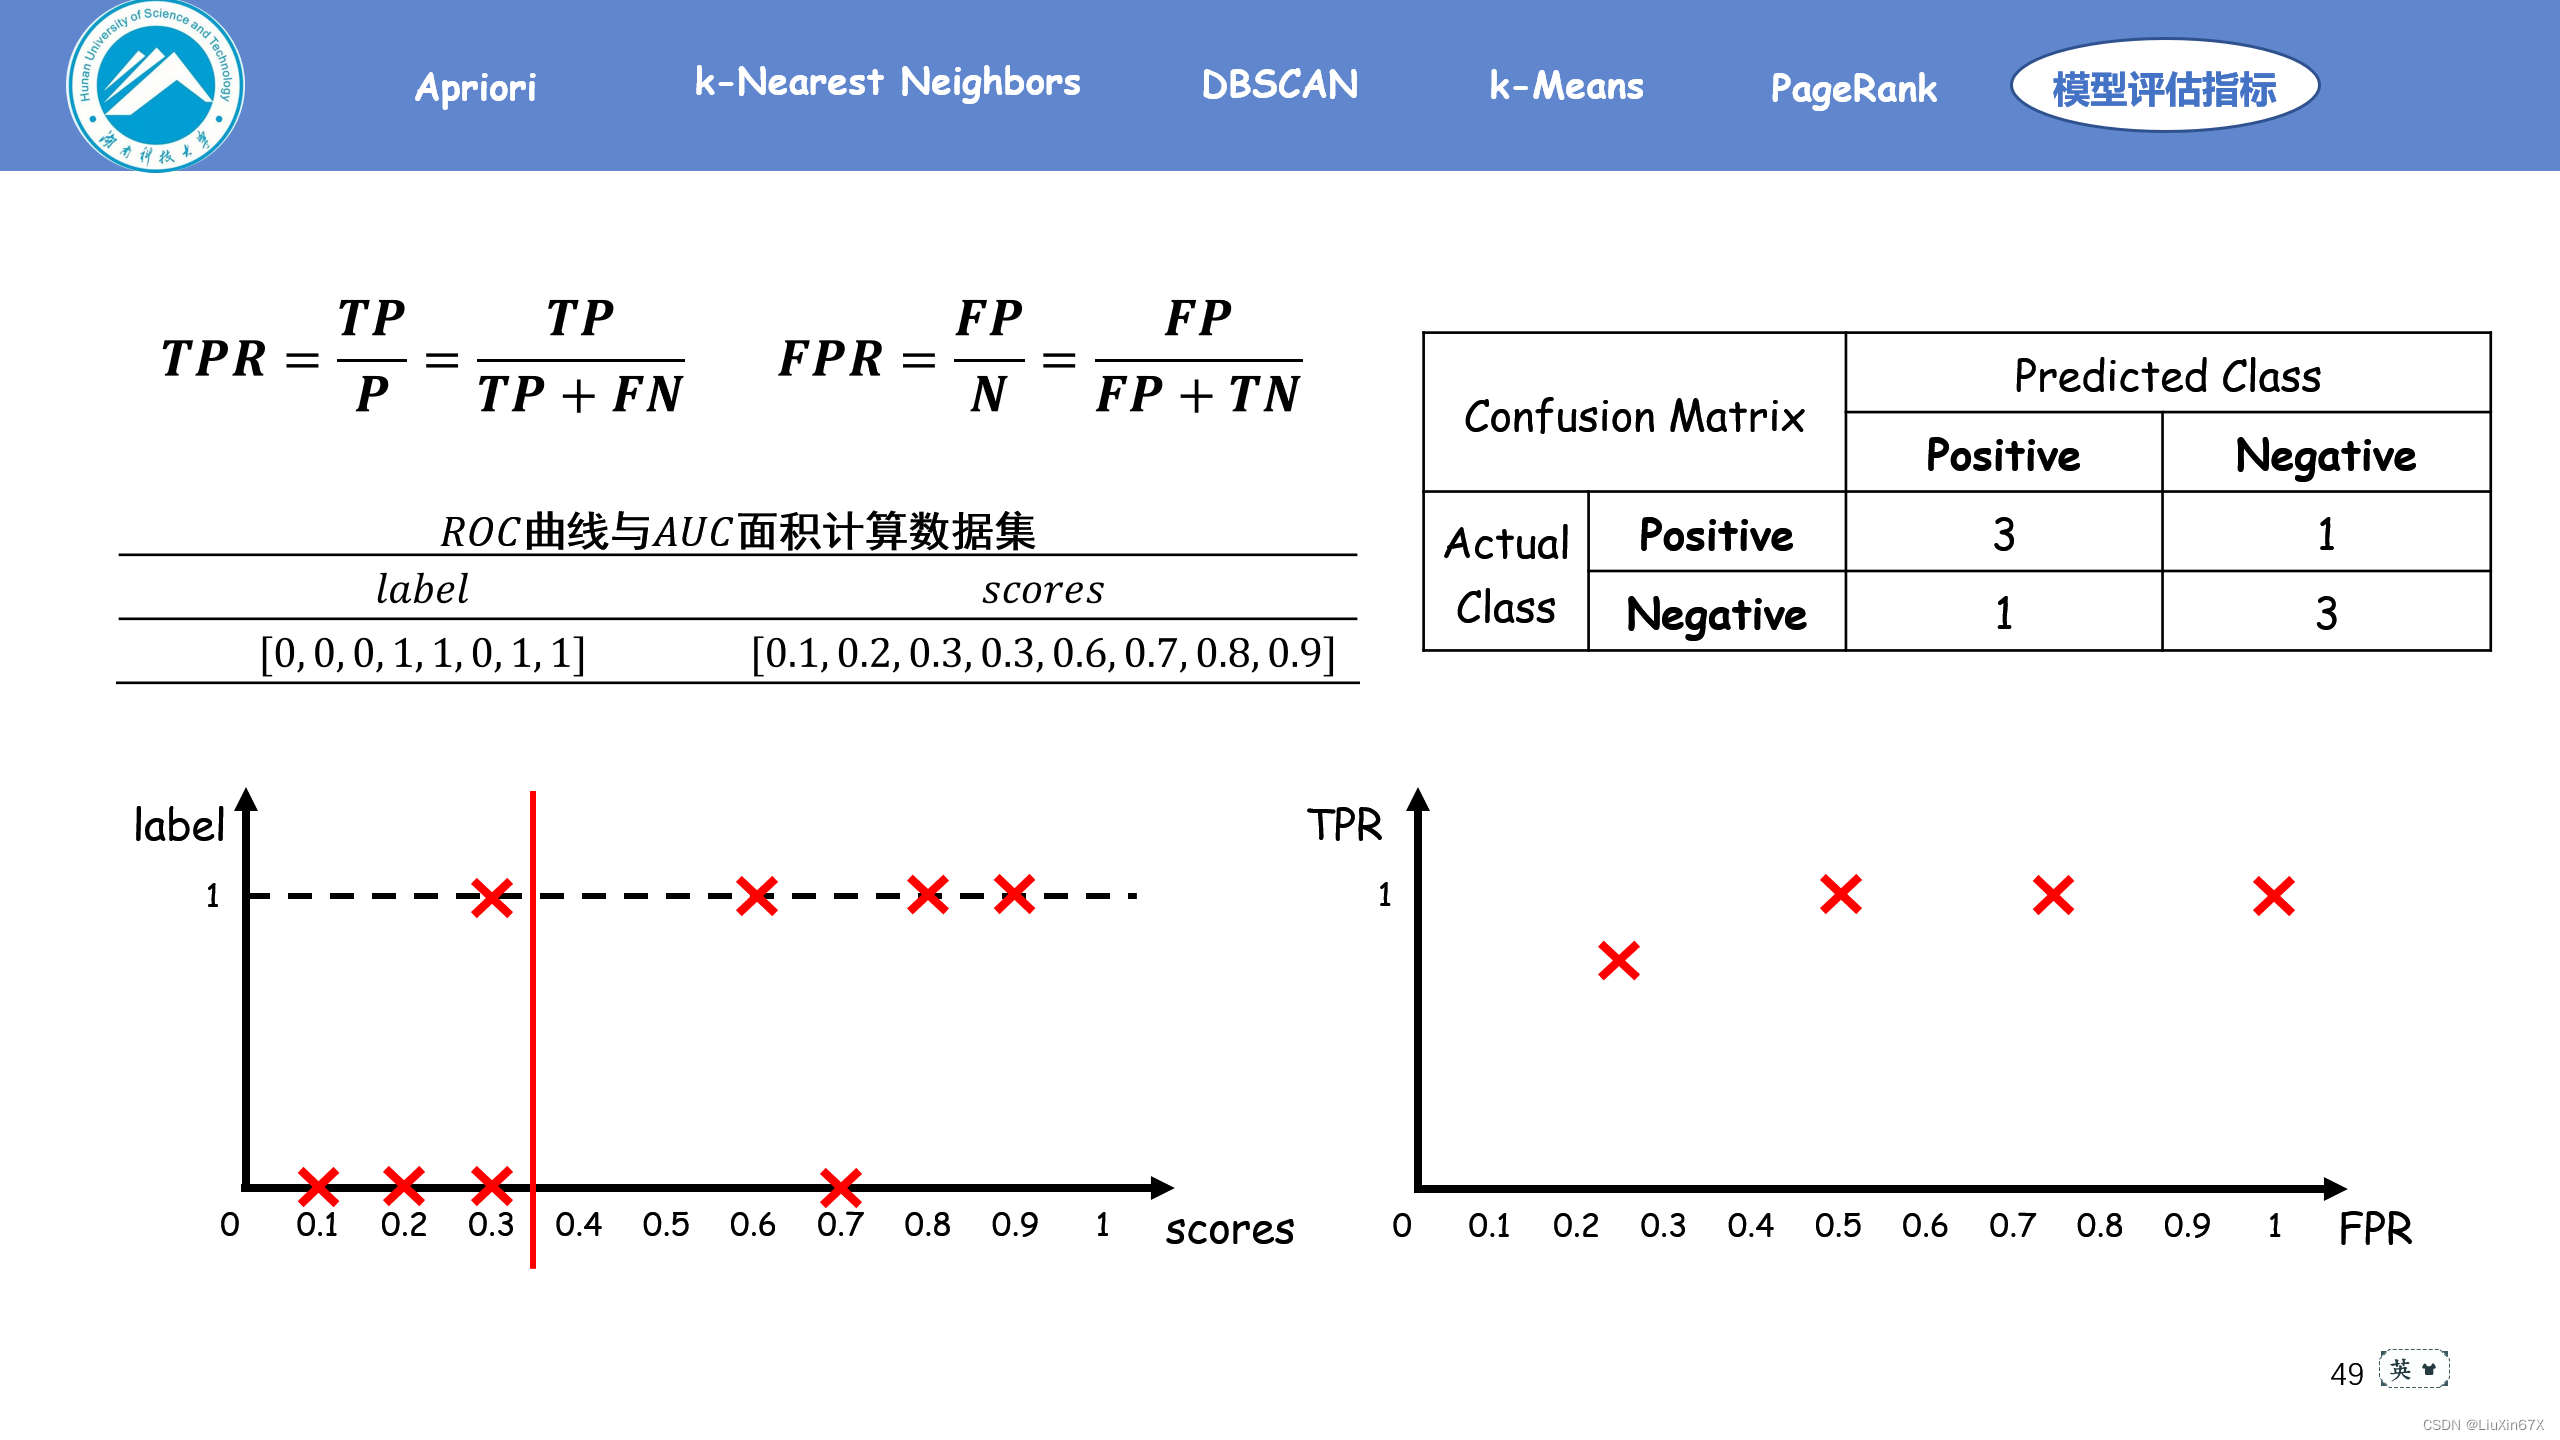
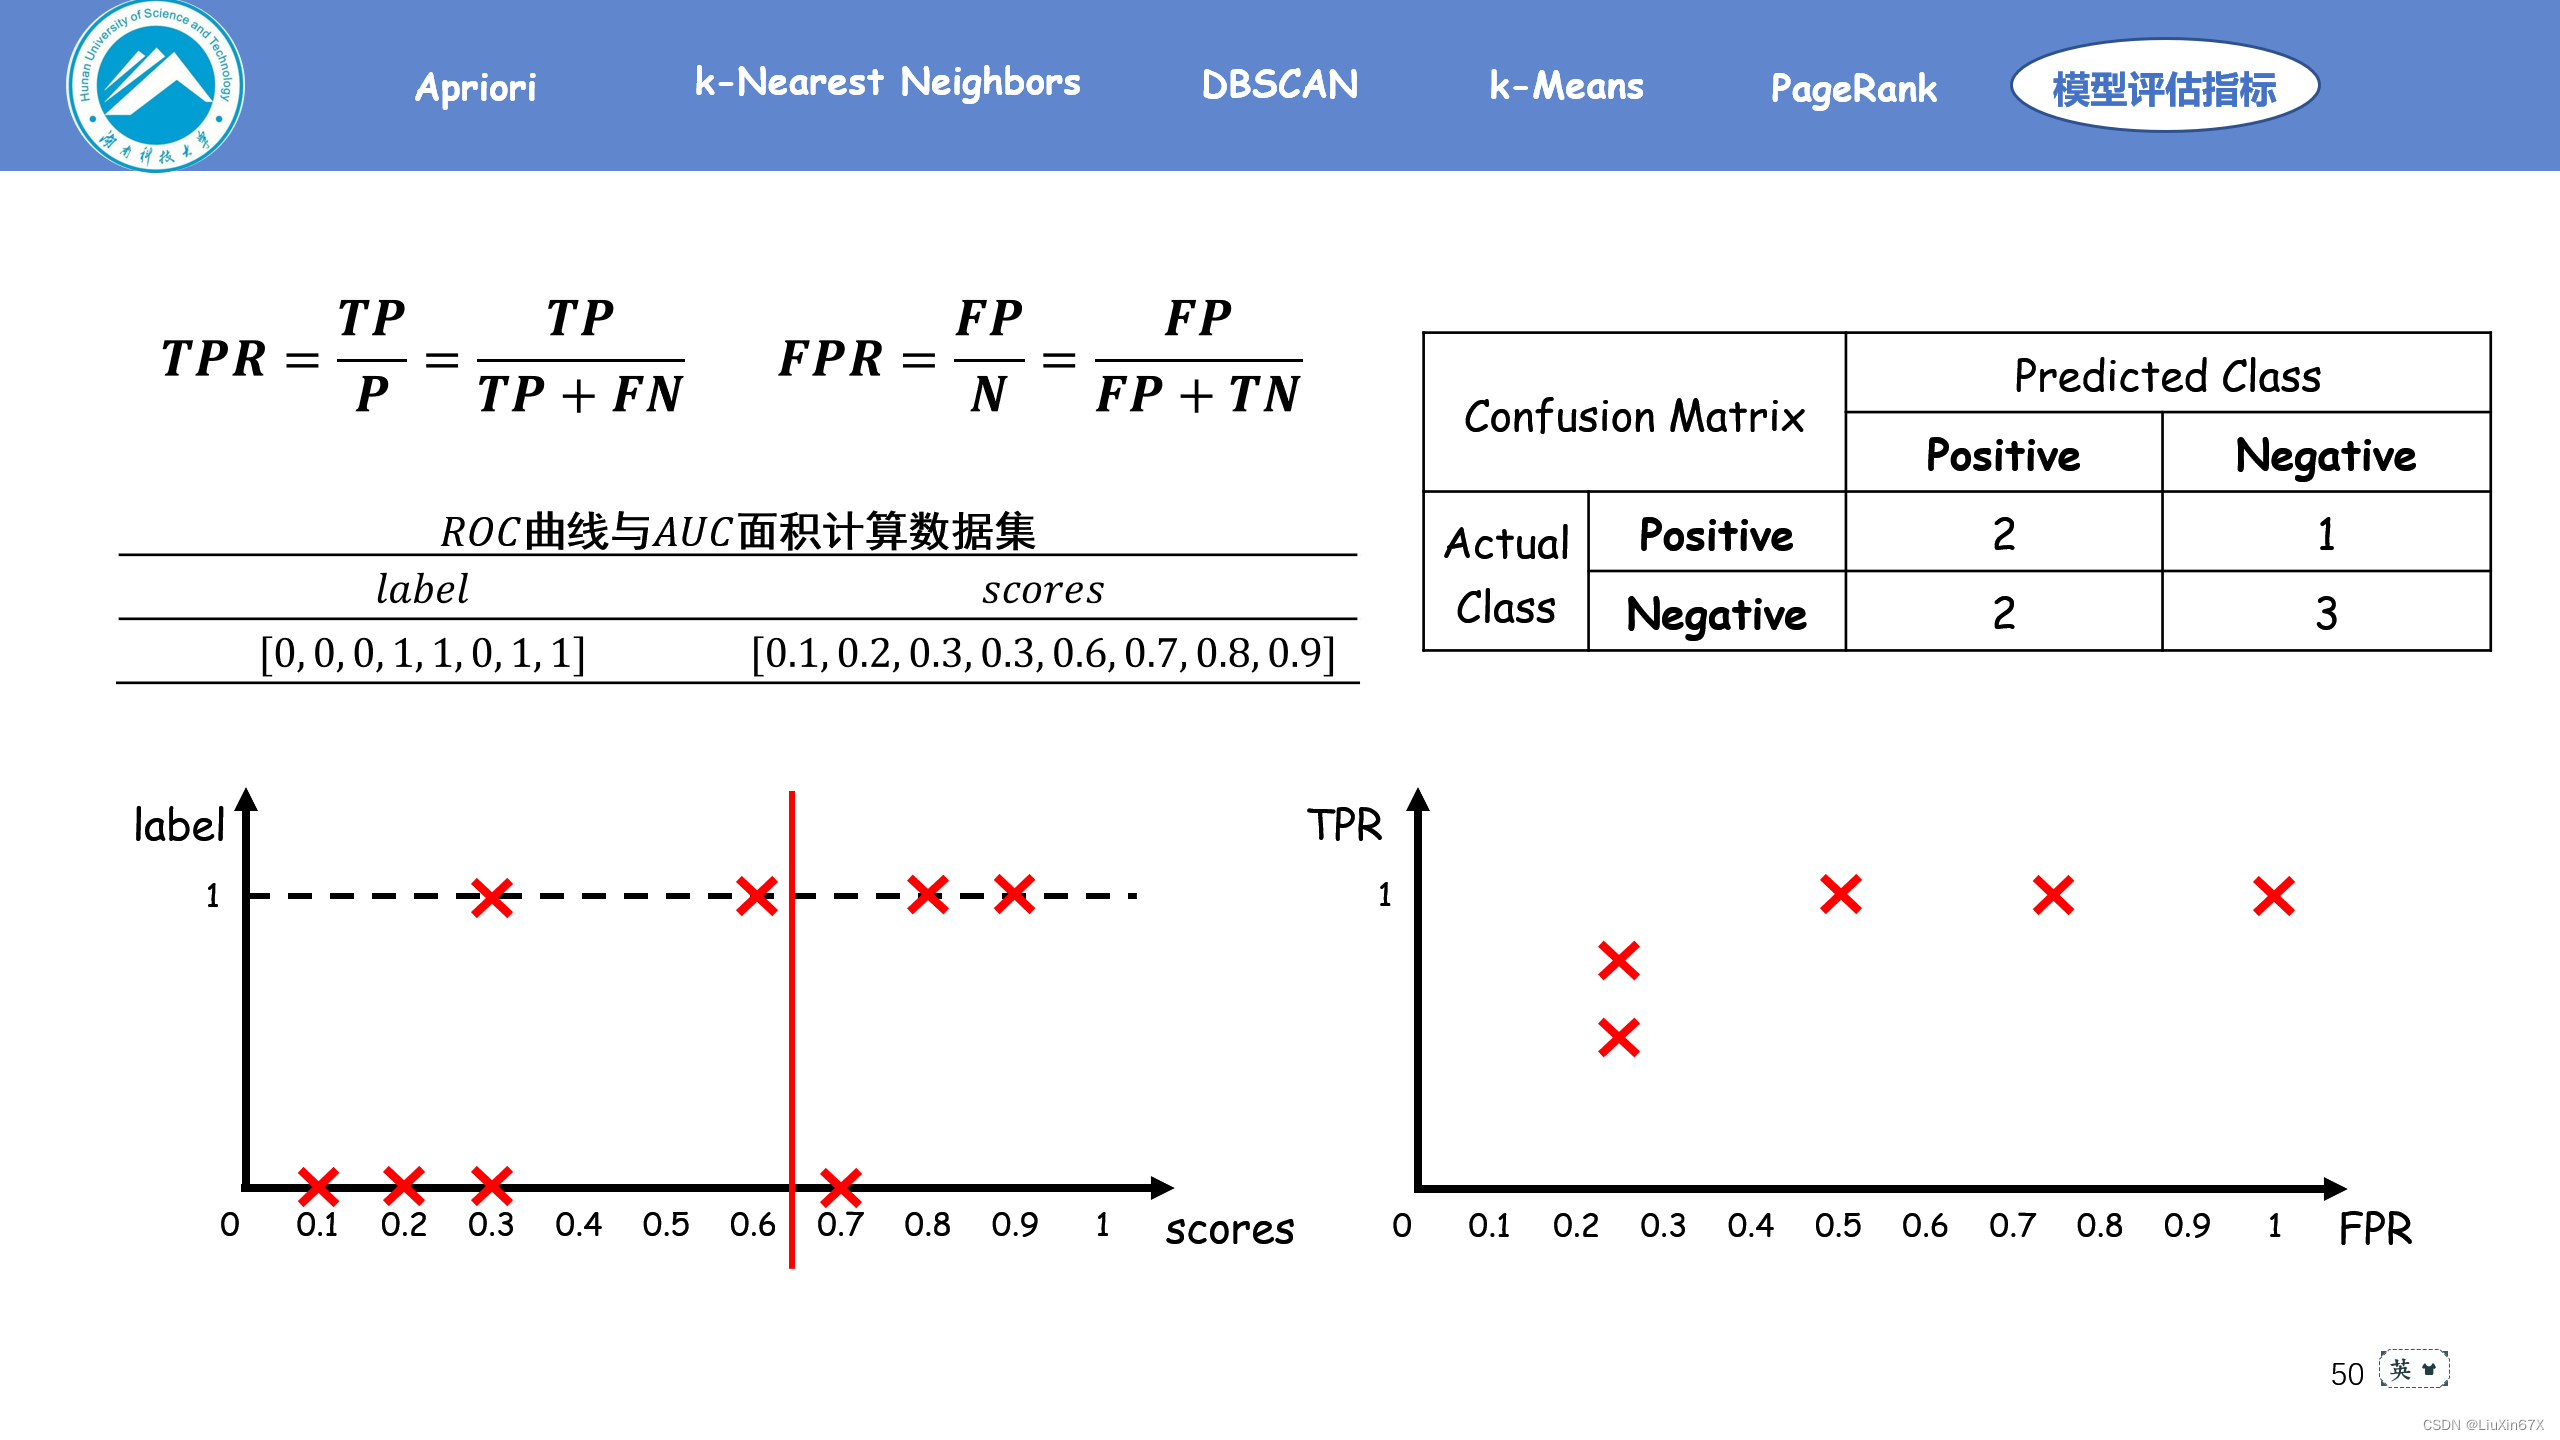
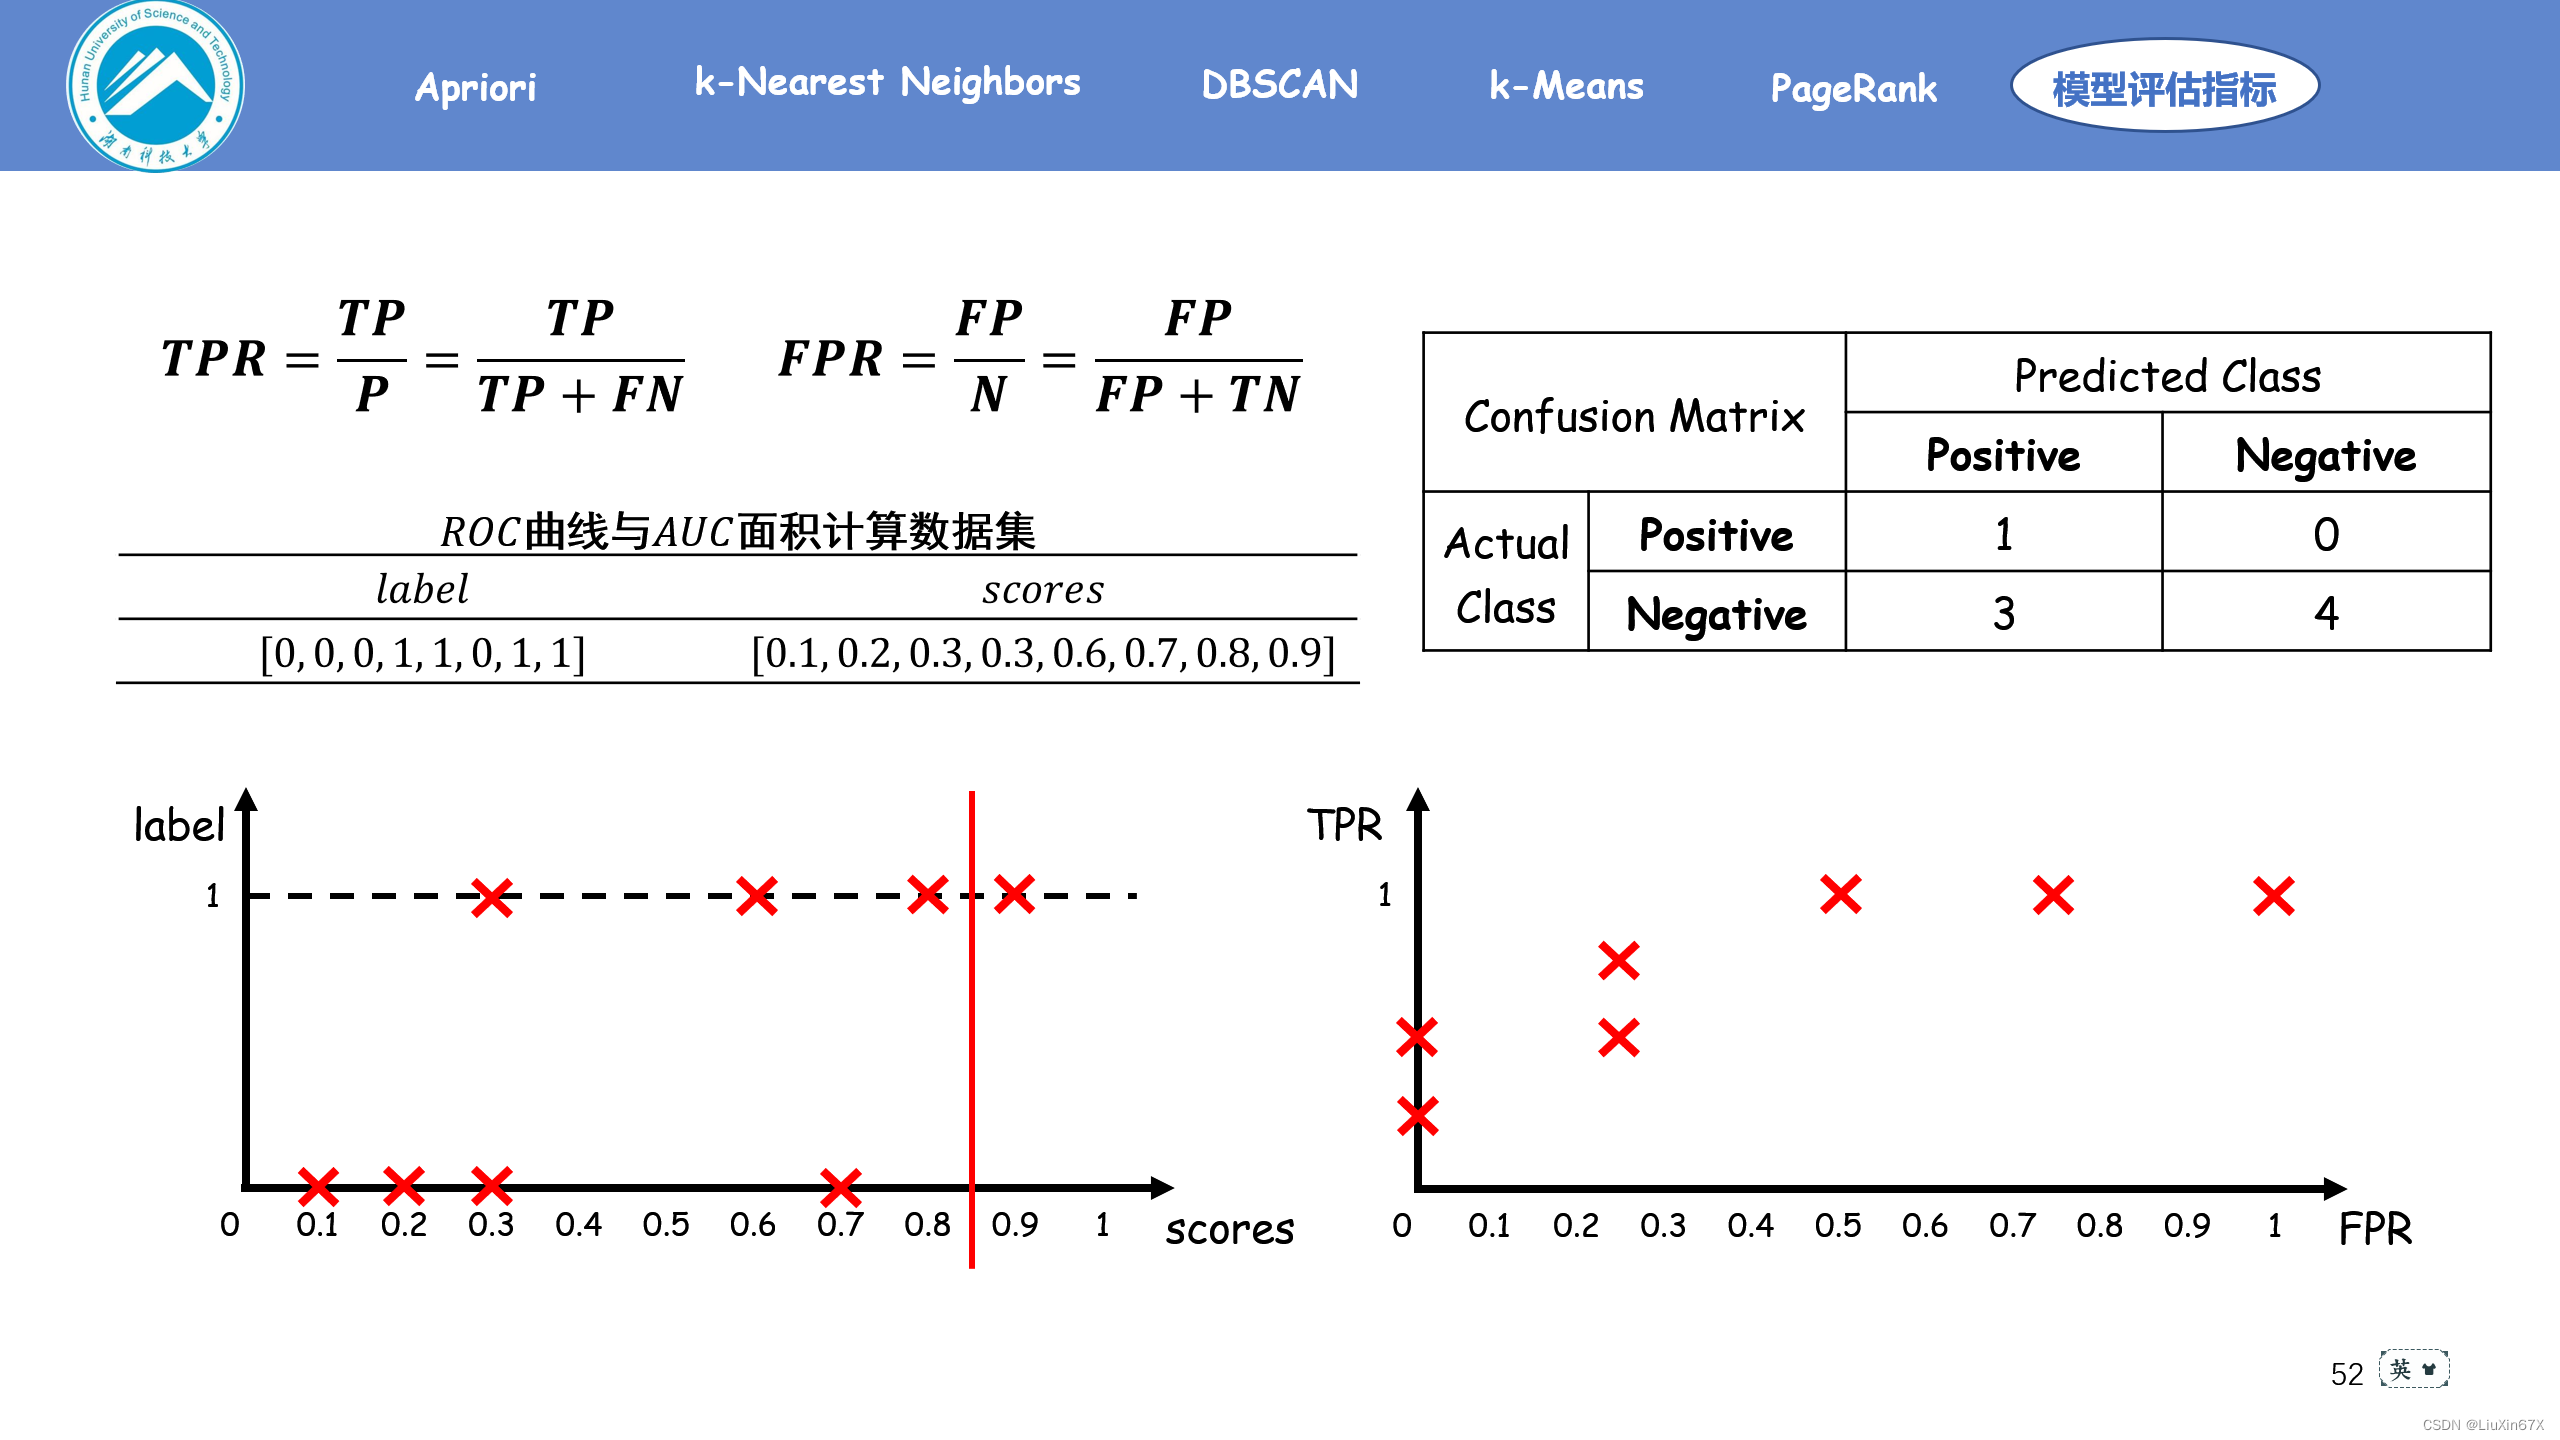
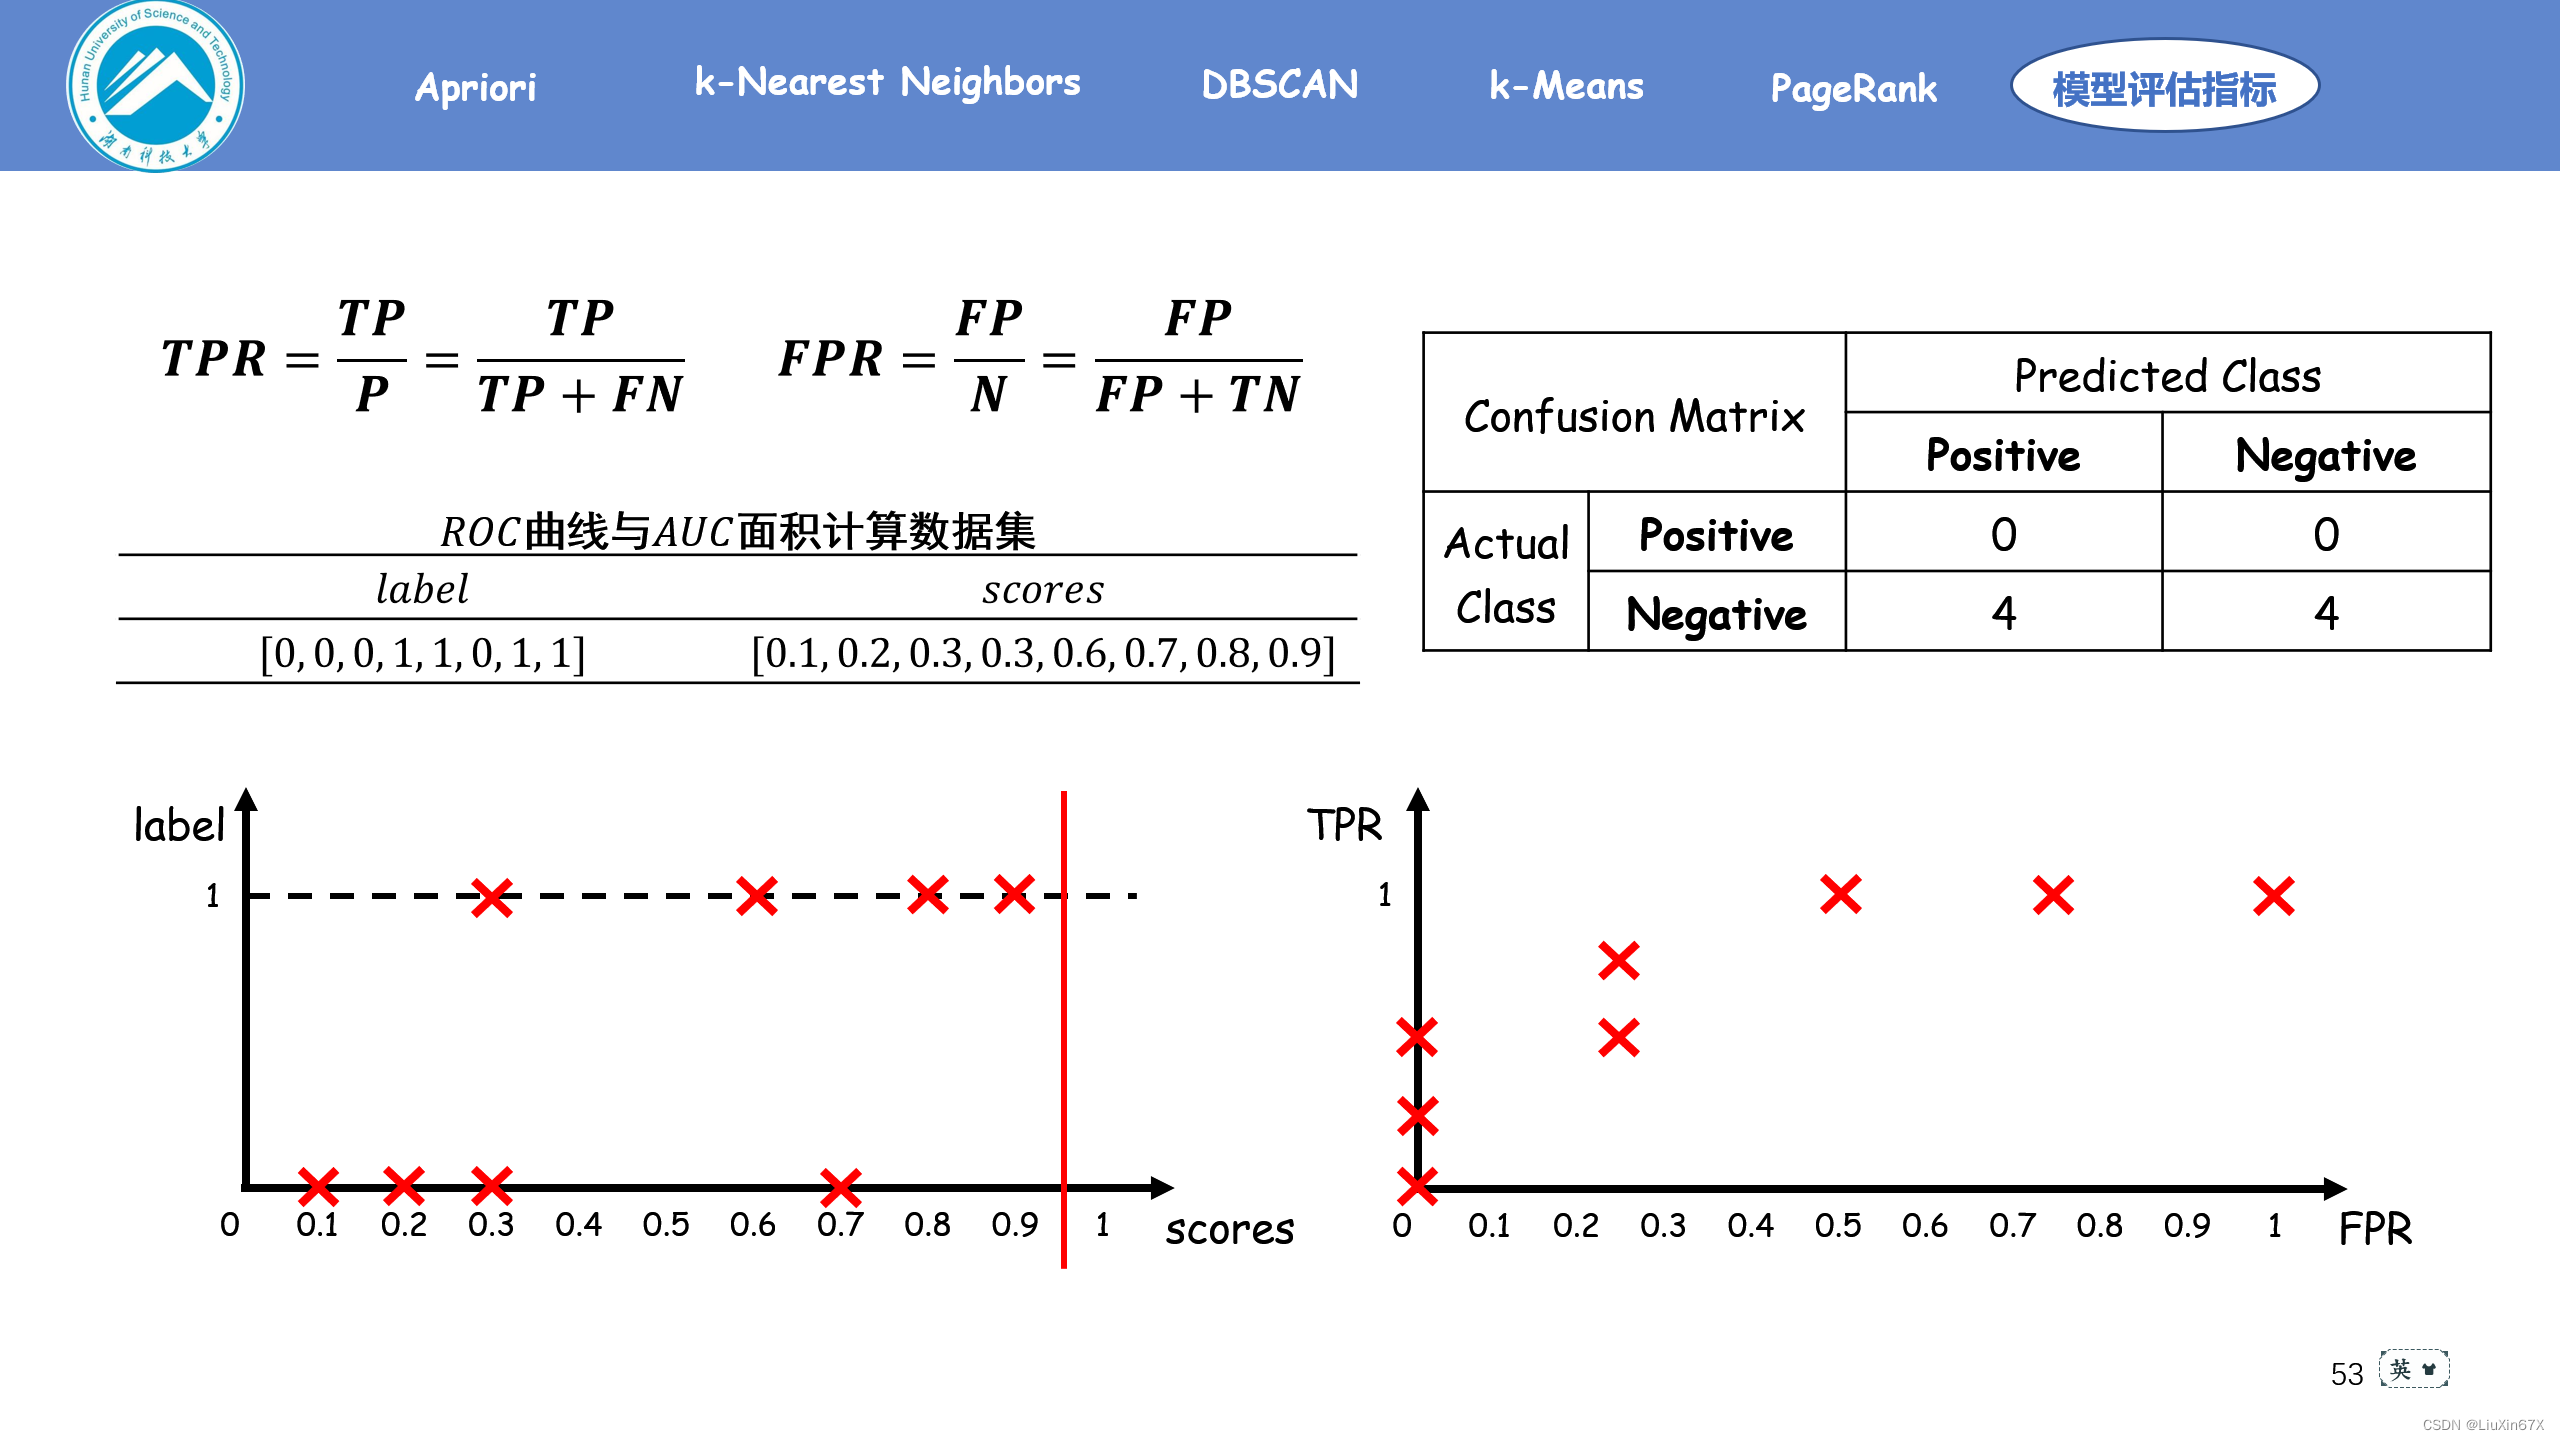
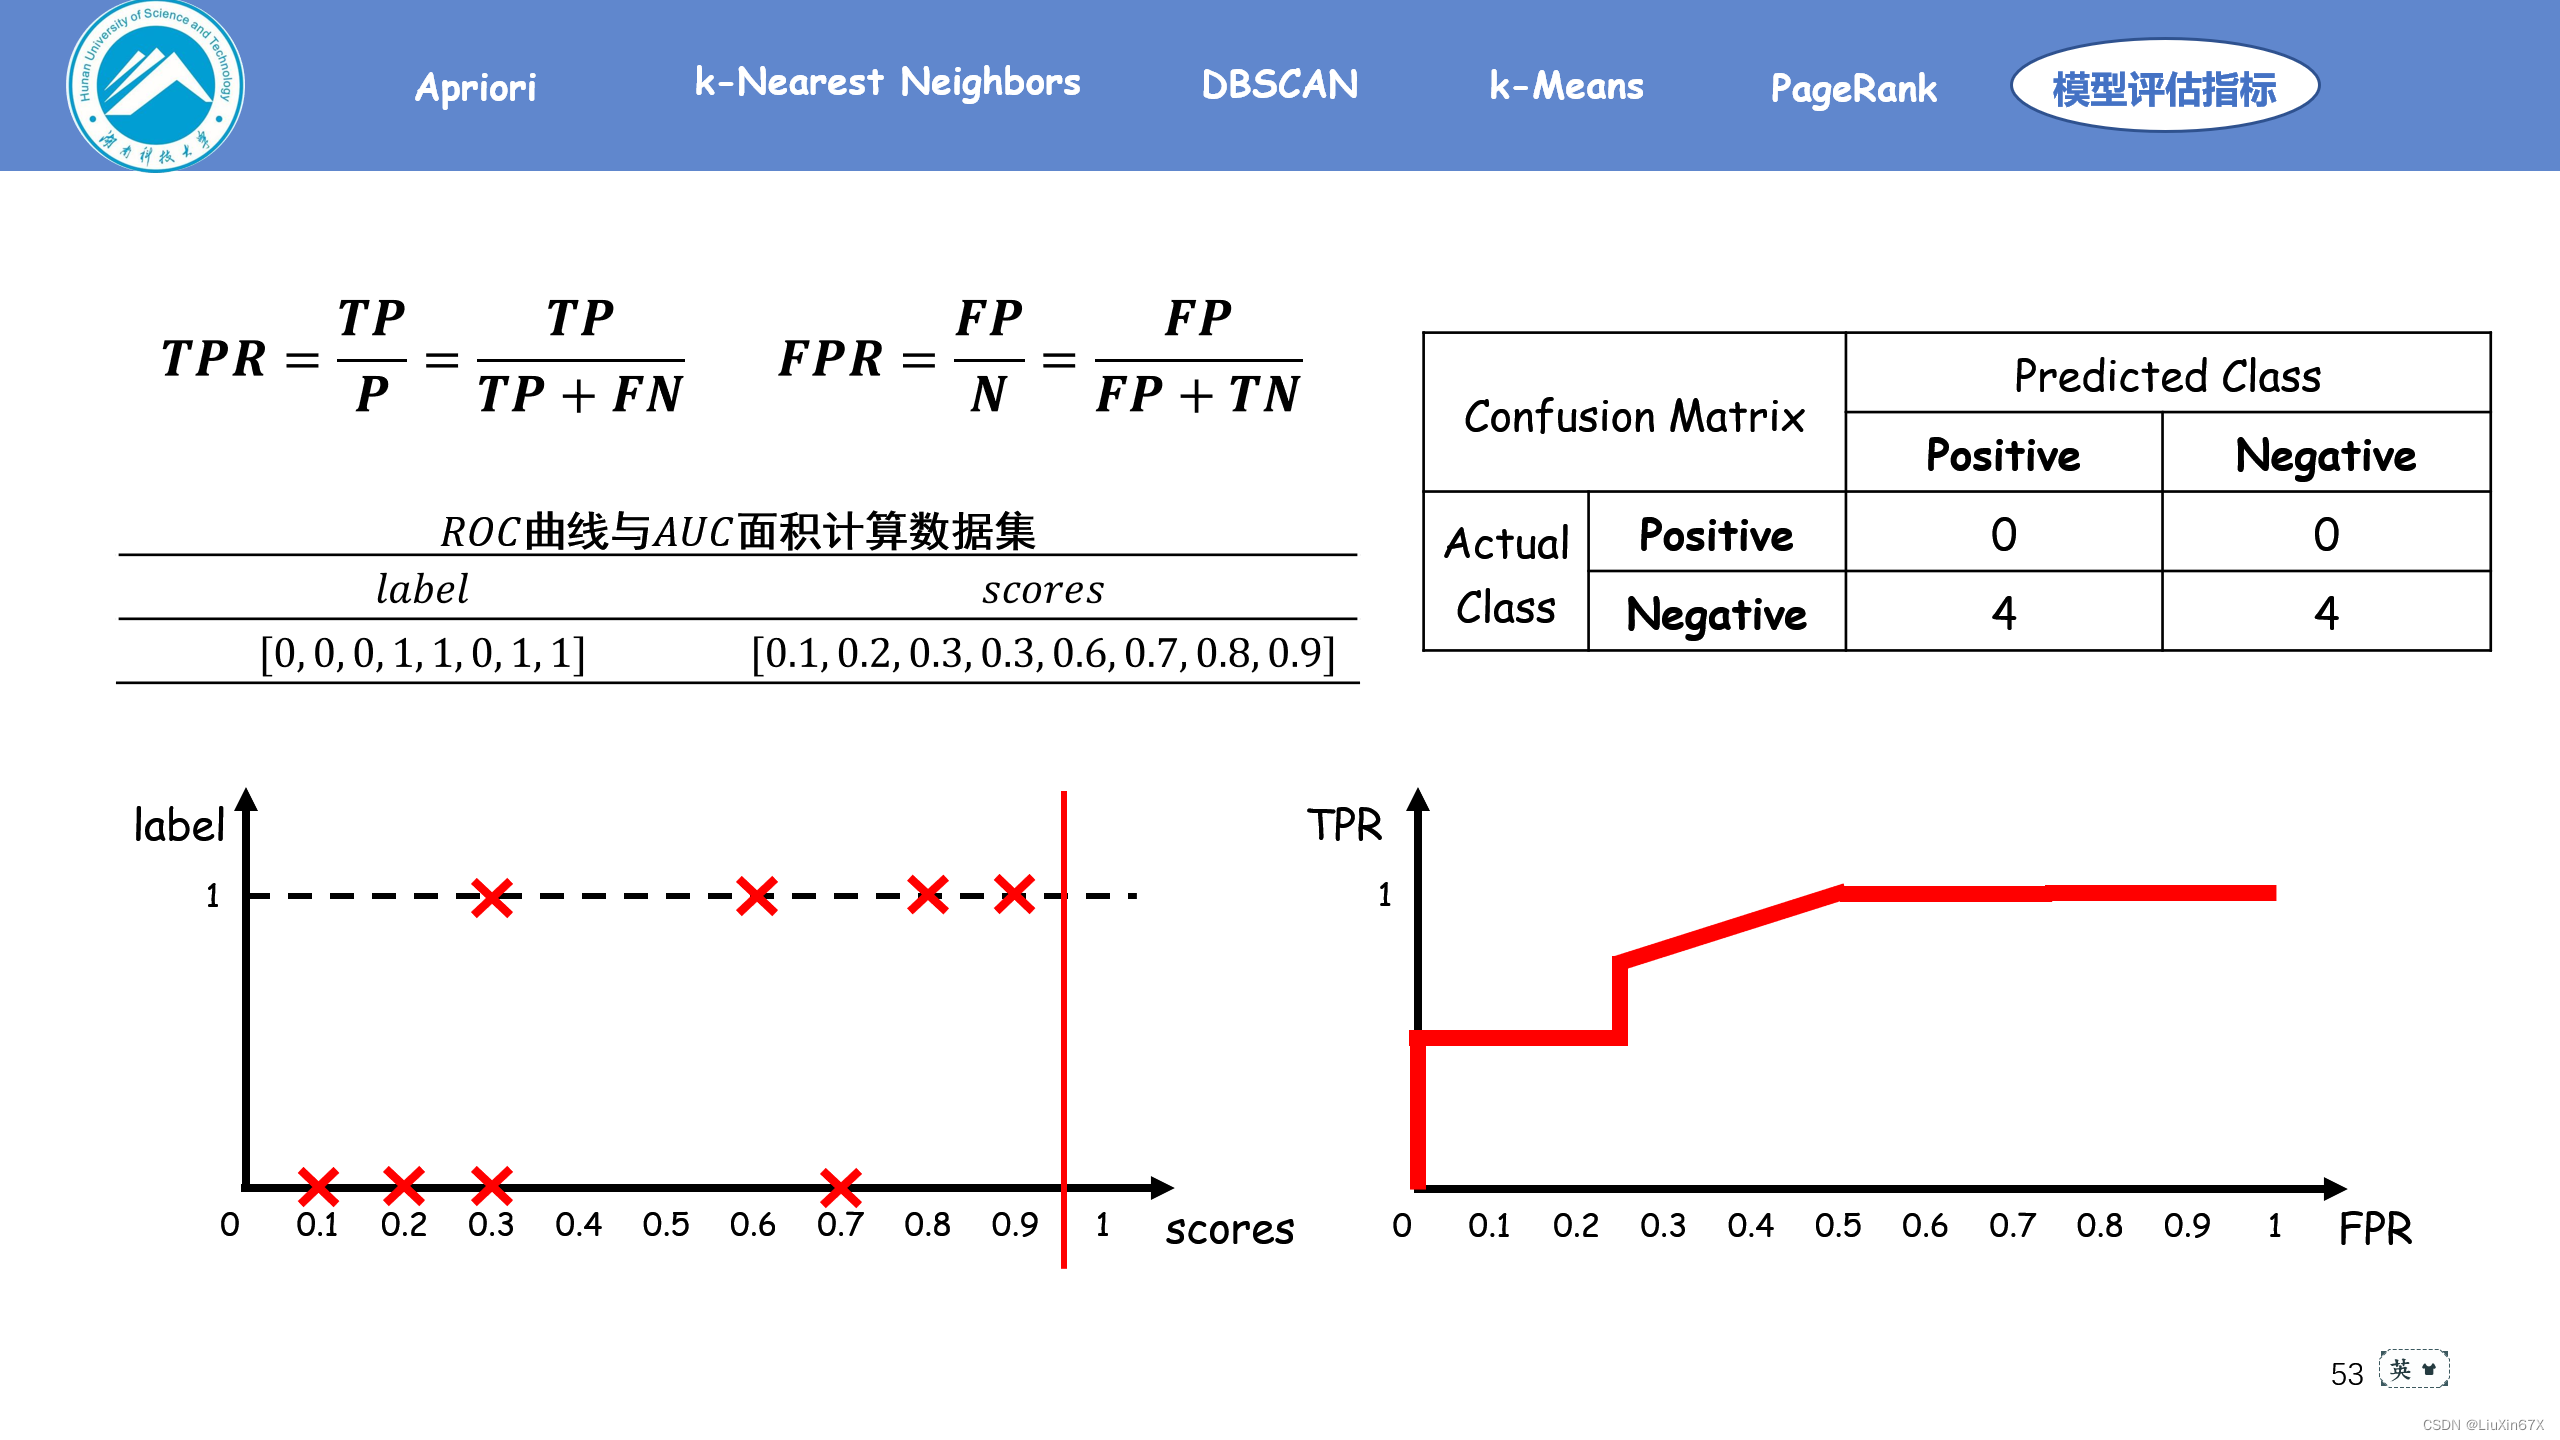
接受者操作特性曲线(receiver operating characteristic curve,简称ROC曲线),又称为感受性曲线(sensitivity curve)。得此名的原因在于曲线上各点反映着相同的感受性,它们都是对同一信号刺激的反应,只不过是在几种不同的判定标准下所得的结果而已。
通俗来说,ROC曲线是一个概率曲线,显示出不同的阈值下TPR与FPR的关系,从本质上将“信号”与“噪声”分开。其中纵轴为TPR ,TPR 越大,预测正类中的实际正类越多;横轴为FPR,FPR越大,预测正类中实际负类越多。
2、原理演示


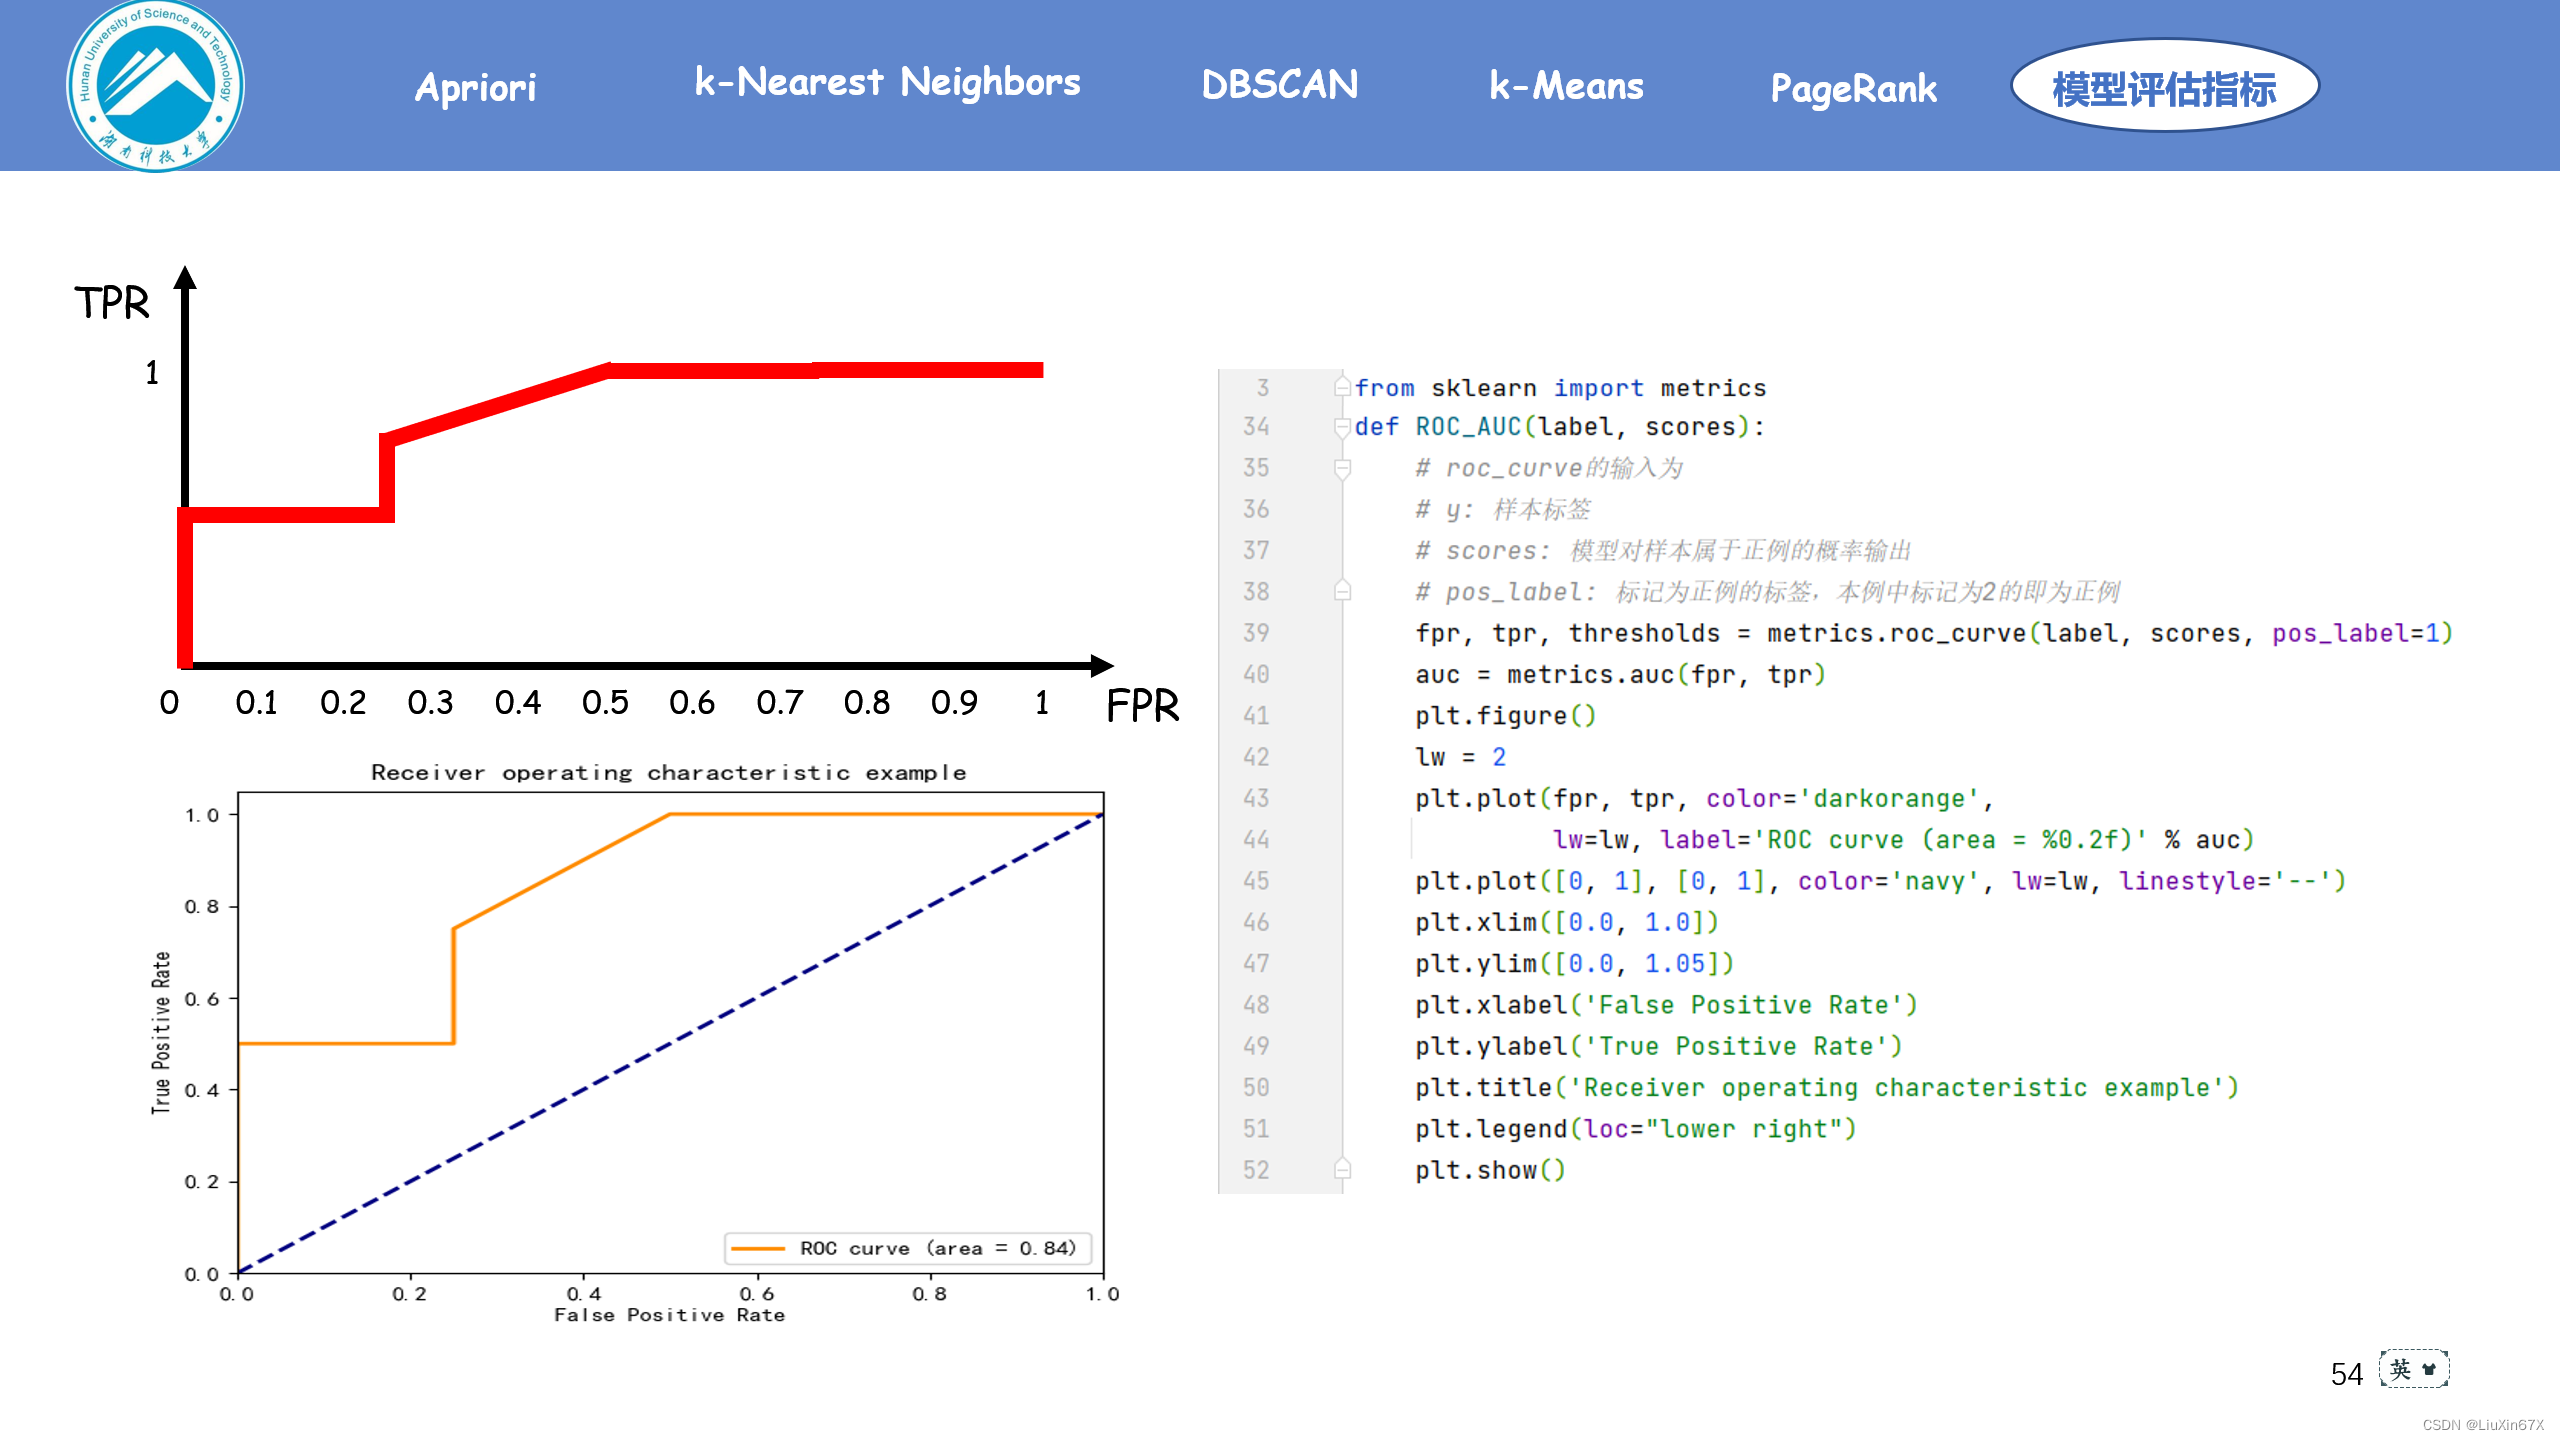
3、关键源码展示
四、AUC面积
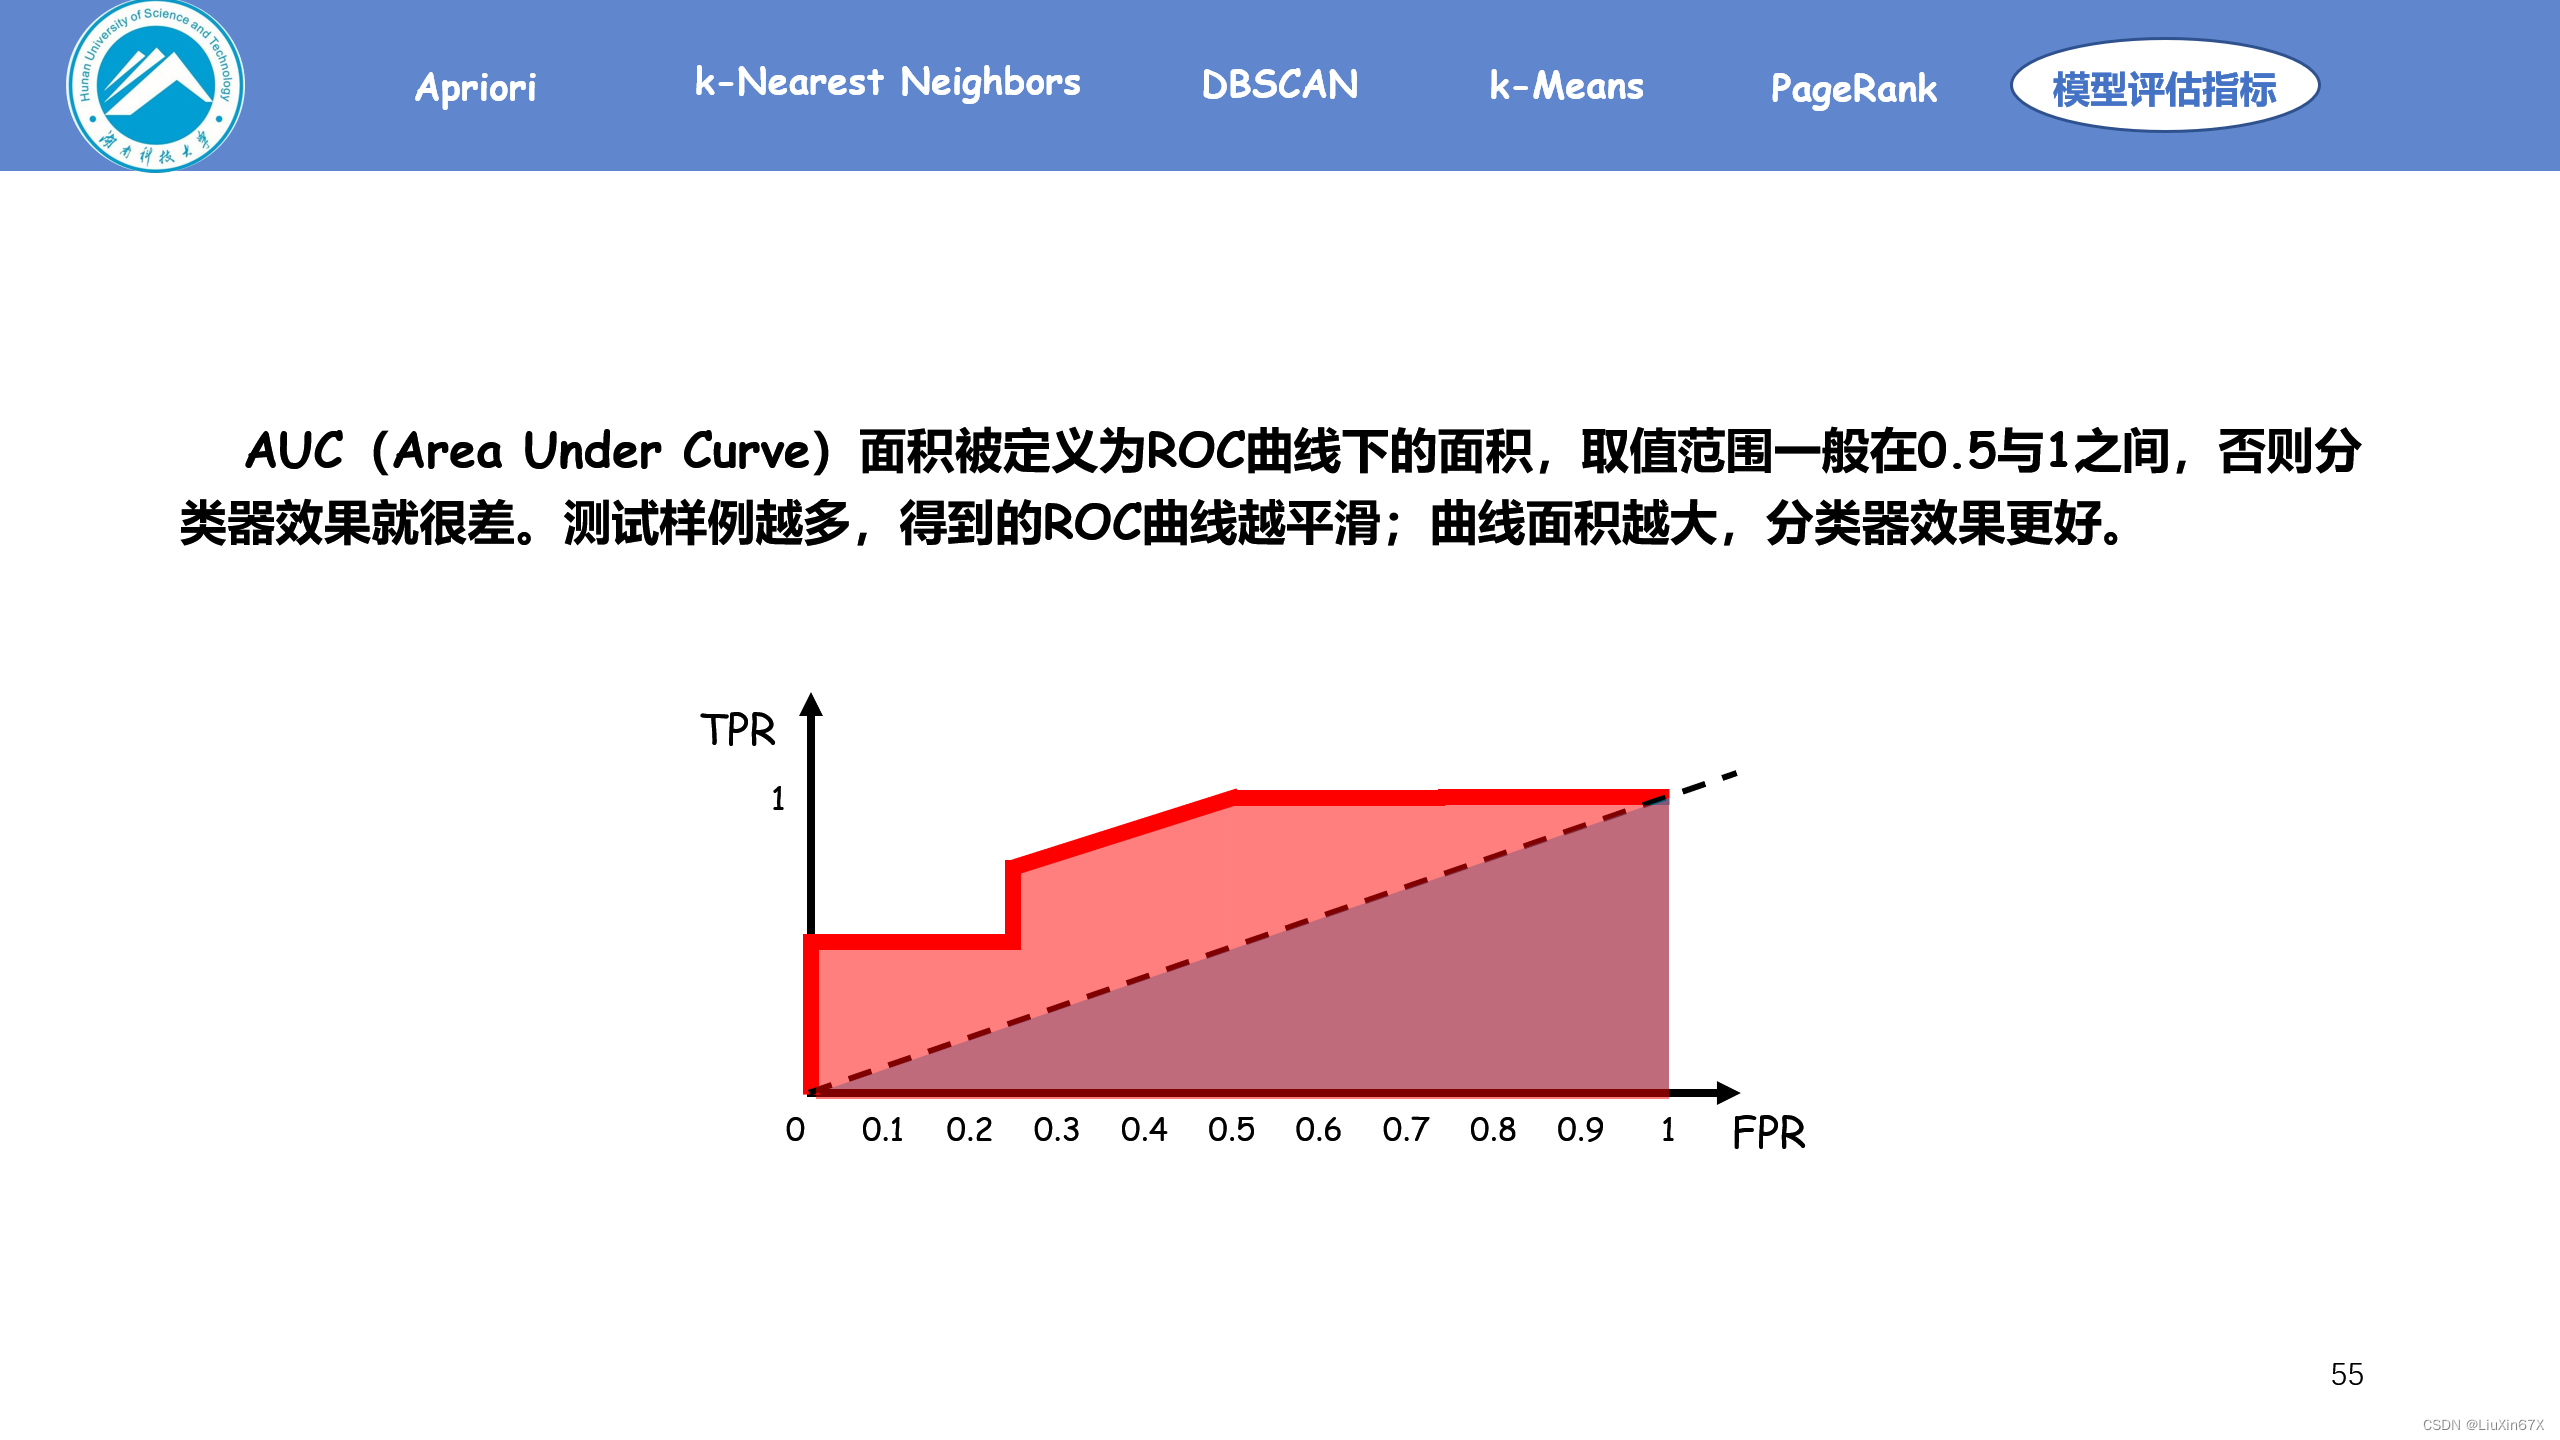
1、基本概念
AUC(Area Under Curve)面积被定义为ROC曲线下的面积,取值范围一般在0.5与1之间,否则分类器效果就很差。测试样例越多,得到的ROC曲线越平滑;曲线面积越大,分类器效果更好。
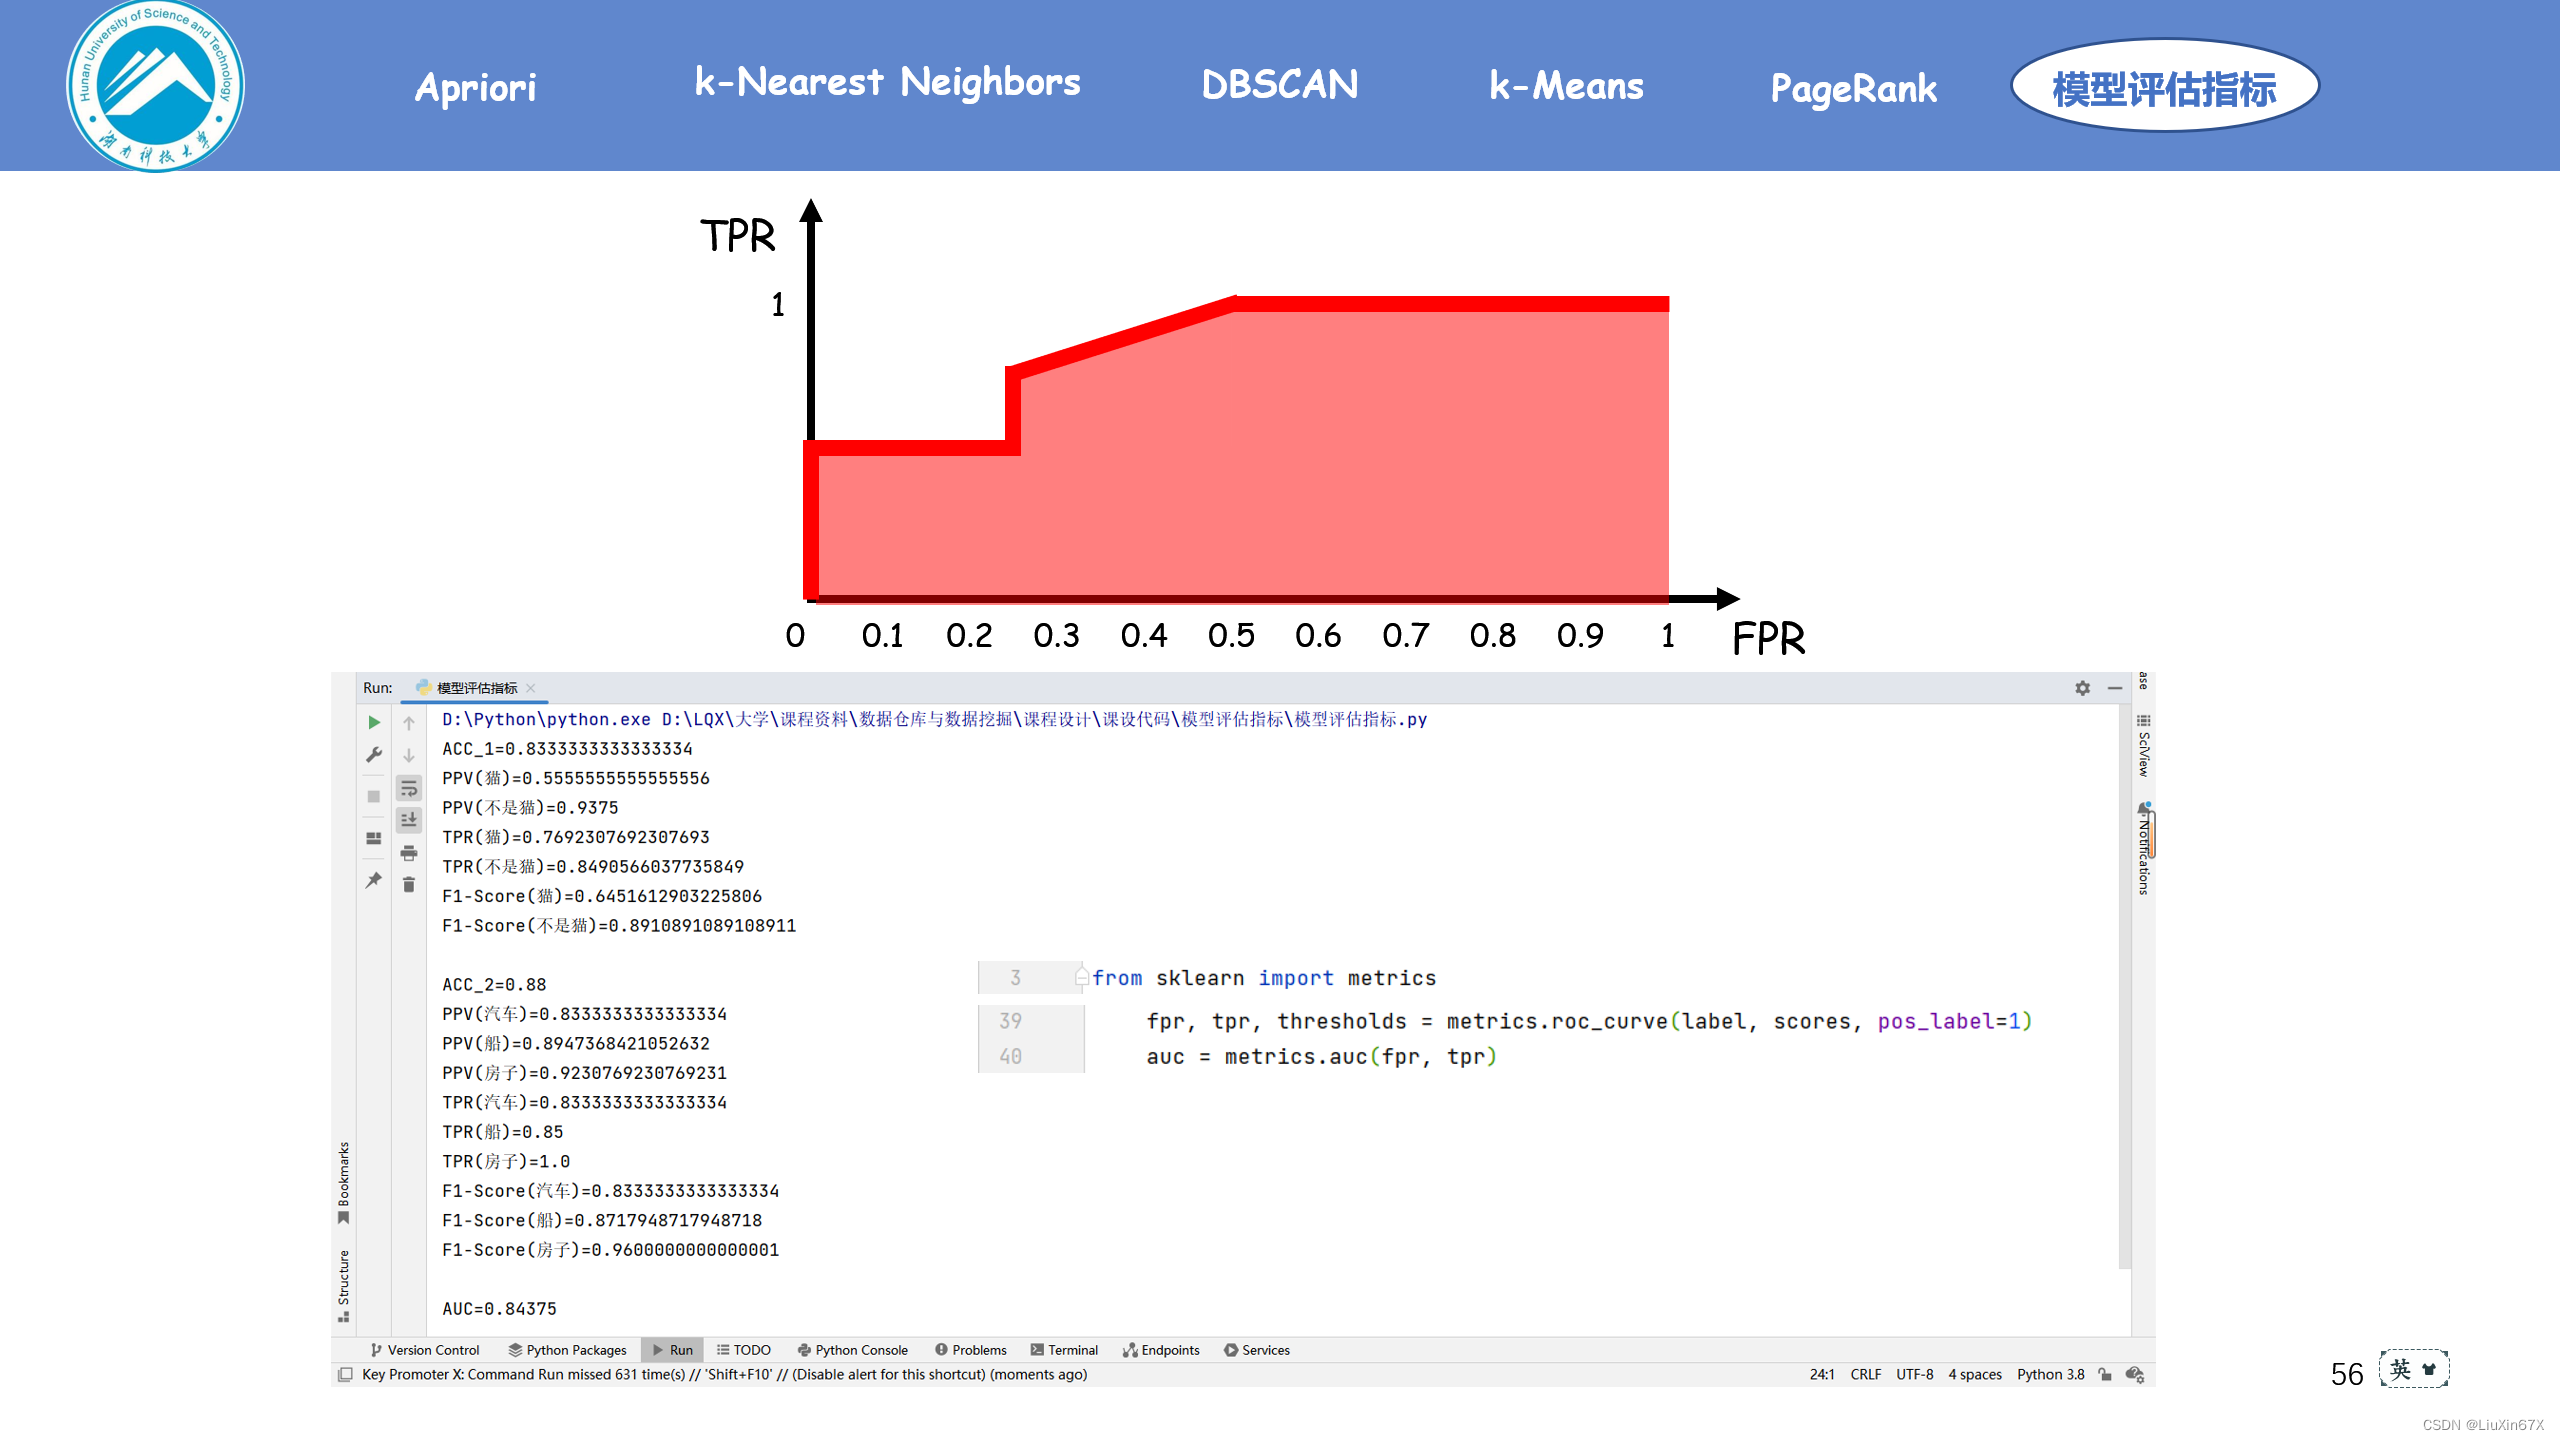
2、关键源码展示
五、完整代码(含数据集)
import numpy as np
import matplotlib.pyplot as plt
from sklearn import metrics
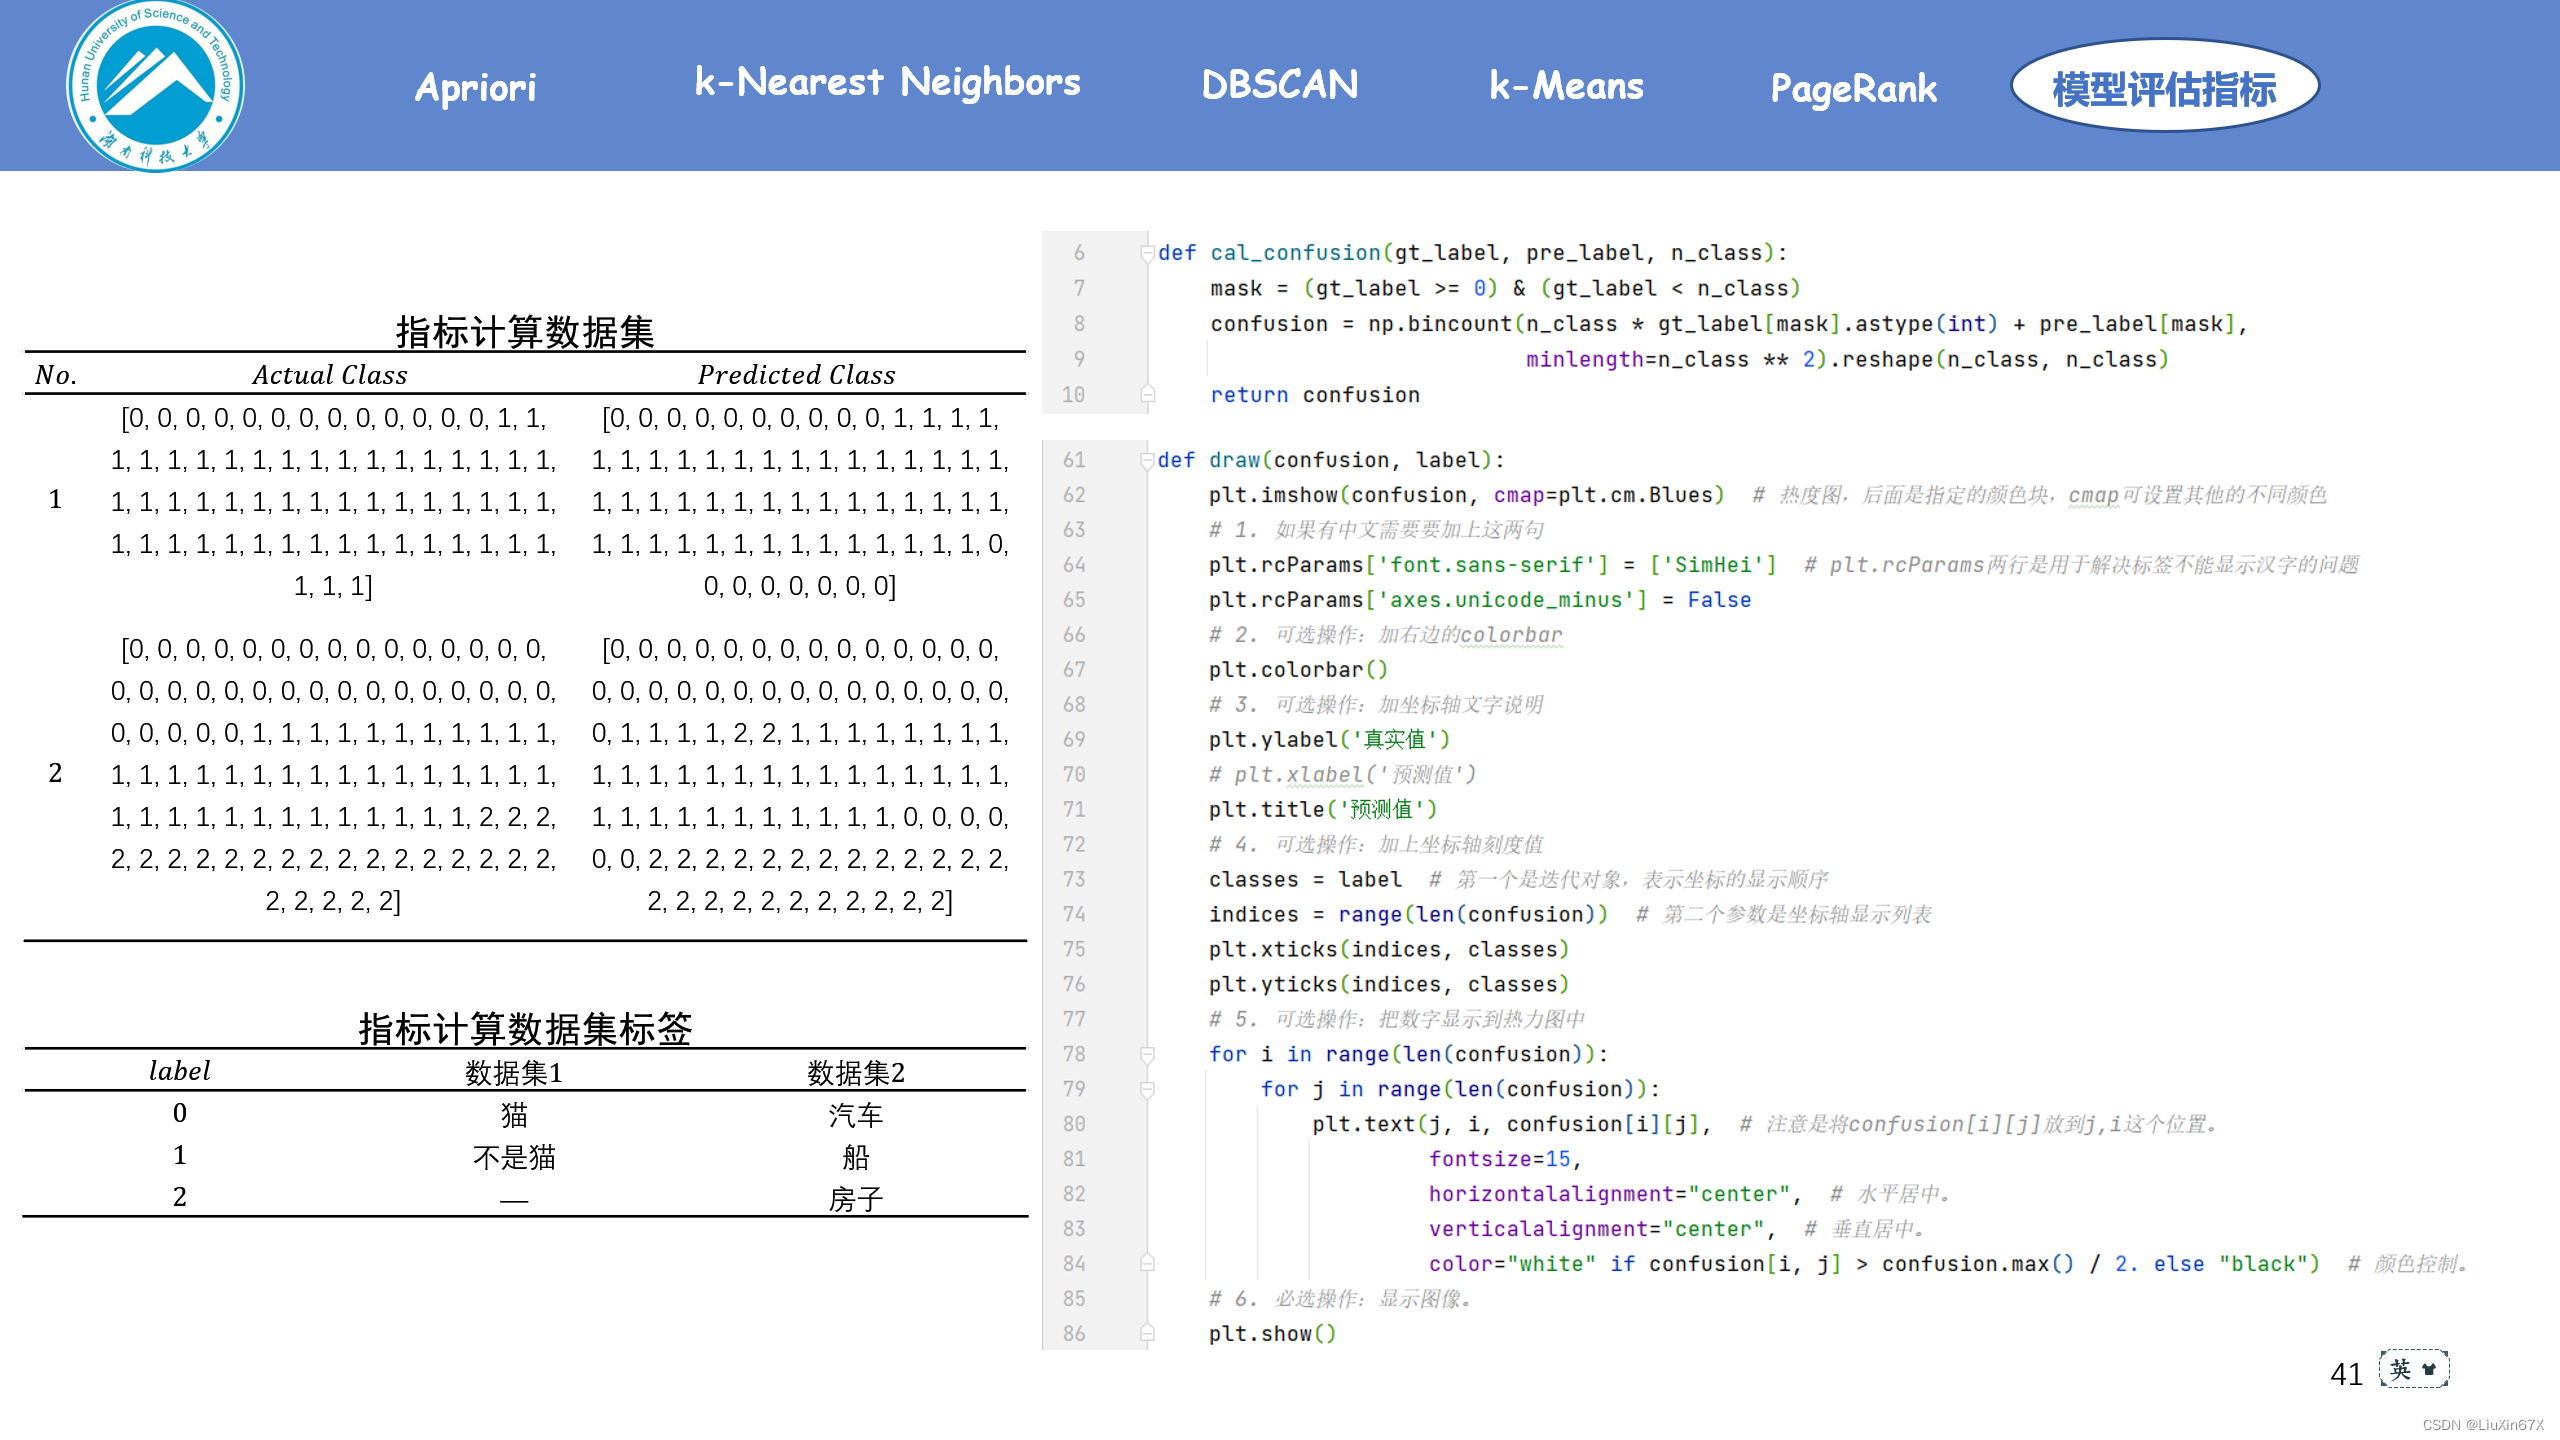
def cal_confusion(gt_label, pre_label, n_class):
mask = (gt_label >= 0) & (gt_label < n_class)
confusion = np.bincount(n_class * gt_label[mask].astype(int) + pre_label[mask],
minlength=n_class ** 2).reshape(n_class, n_class)
return confusion
# 准确率
def ACC(confusion):
return np.diag(confusion).sum() / confusion.sum()
# 精确率
def PPV(confusion, label, l_name):
return np.diag(confusion)[label.index(l_name)] / np.sum(confusion, axis=0)[label.index(l_name)]
# 召回率(灵敏度,真正率)
def TPR(confusion, label, l_name):
return np.diag(confusion)[label.index(l_name)] / np.sum(confusion, axis=1)[label.index(l_name)]
# 假正率
def FTR(confusion, label, l_name):
return np.sum(confusion, axis=0)[label.index(l_name)] - np.diag(confusion)[label.index(l_name)] / (
np.sum(confusion) - np.sum(confusion, axis=1)[label.index(l_name)])
def ROC_AUC(label, scores):
# roc_curve的输入为
# y: 样本标签
# scores: 模型对样本属于正例的概率输出
# pos_label: 标记为正例的标签,本例中标记为2的即为正例
fpr, tpr, thresholds = metrics.roc_curve(label, scores, pos_label=1)
auc = metrics.auc(fpr, tpr)
plt.figure()
lw = 2
plt.plot(fpr, tpr, color='darkorange',
lw=lw, label='ROC curve (area = %0.2f)' % auc)
plt.plot([0, 1], [0, 1], color='navy', lw=lw, linestyle='--')
plt.xlim([0.0, 1.0])
plt.ylim([0.0, 1.05])
plt.xlabel('False Positive Rate')
plt.ylabel('True Positive Rate')
plt.title('Receiver operating characteristic example')
plt.legend(loc="lower right")
plt.show()
return auc
# Fn-Score
def Fn_Score(confusion, label, l_name, n):
return ((1 + pow(n, 2)) * PPV(confusion, label, l_name) * TPR(confusion, label, l_name)) / (
pow(n, 2) * PPV(confusion, label, l_name) + TPR(confusion, label, l_name))
def draw(confusion, label):
plt.imshow(confusion, cmap=plt.cm.Blues) # 热度图,后面是指定的颜色块,cmap可设置其他的不同颜色
# 1. 如果有中文需要要加上这两句
plt.rcParams['font.sans-serif'] = ['SimHei'] # plt.rcParams两行是用于解决标签不能显示汉字的问题
plt.rcParams['axes.unicode_minus'] = False
# 2. 可选操作:加右边的colorbar
plt.colorbar()
# 3. 可选操作:加坐标轴文字说明
plt.ylabel('真实值')
# plt.xlabel('预测值')
plt.title('预测值')
# 4. 可选操作:加上坐标轴刻度值
classes = label # 第一个是迭代对象,表示坐标的显示顺序
indices = range(len(confusion)) # 第二个参数是坐标轴显示列表
plt.xticks(indices, classes)
plt.yticks(indices, classes)
# 5. 可选操作:把数字显示到热力图中
for i in range(len(confusion)):
for j in range(len(confusion)):
plt.text(j, i, confusion[i][j], # 注意是将confusion[i][j]放到j,i这个位置。
fontsize=15,
horizontalalignment="center", # 水平居中。
verticalalignment="center", # 垂直居中。
color="white" if confusion[i, j] > confusion.max() / 2. else "black") # 颜色控制。
# 6. 必选操作:显示图像。
plt.show()
def main():
# 混淆矩阵 √
# 准确率 √
# 精确率 √
# ROC曲线 √
# AUC面积 √
# F1-Score √
gt_label_1 = np.array(
[0, 0, 0, 0, 0, 0, 0, 0, 0, 0, 0,
0, 0, 1, 1, 1, 1, 1, 1, 1, 1, 1,
1, 1, 1, 1, 1, 1, 1, 1, 1, 1, 1,
1, 1, 1, 1, 1, 1, 1, 1, 1, 1, 1,
1, 1, 1, 1, 1, 1, 1, 1, 1, 1, 1,
1, 1, 1, 1, 1, 1, 1, 1, 1, 1, 1])
pre_label_1 = np.array(
[0, 0, 0, 0, 0, 0, 0, 0, 0, 0, 1,
1, 1, 1, 1, 1, 1, 1, 1, 1, 1, 1,
1, 1, 1, 1, 1, 1, 1, 1, 1, 1, 1,
1, 1, 1, 1, 1, 1, 1, 1, 1, 1, 1,
1, 1, 1, 1, 1, 1, 1, 1, 1, 1, 1,
1, 1, 1, 0, 0, 0, 0, 0, 0, 0, 0])
n_class_1 = 2
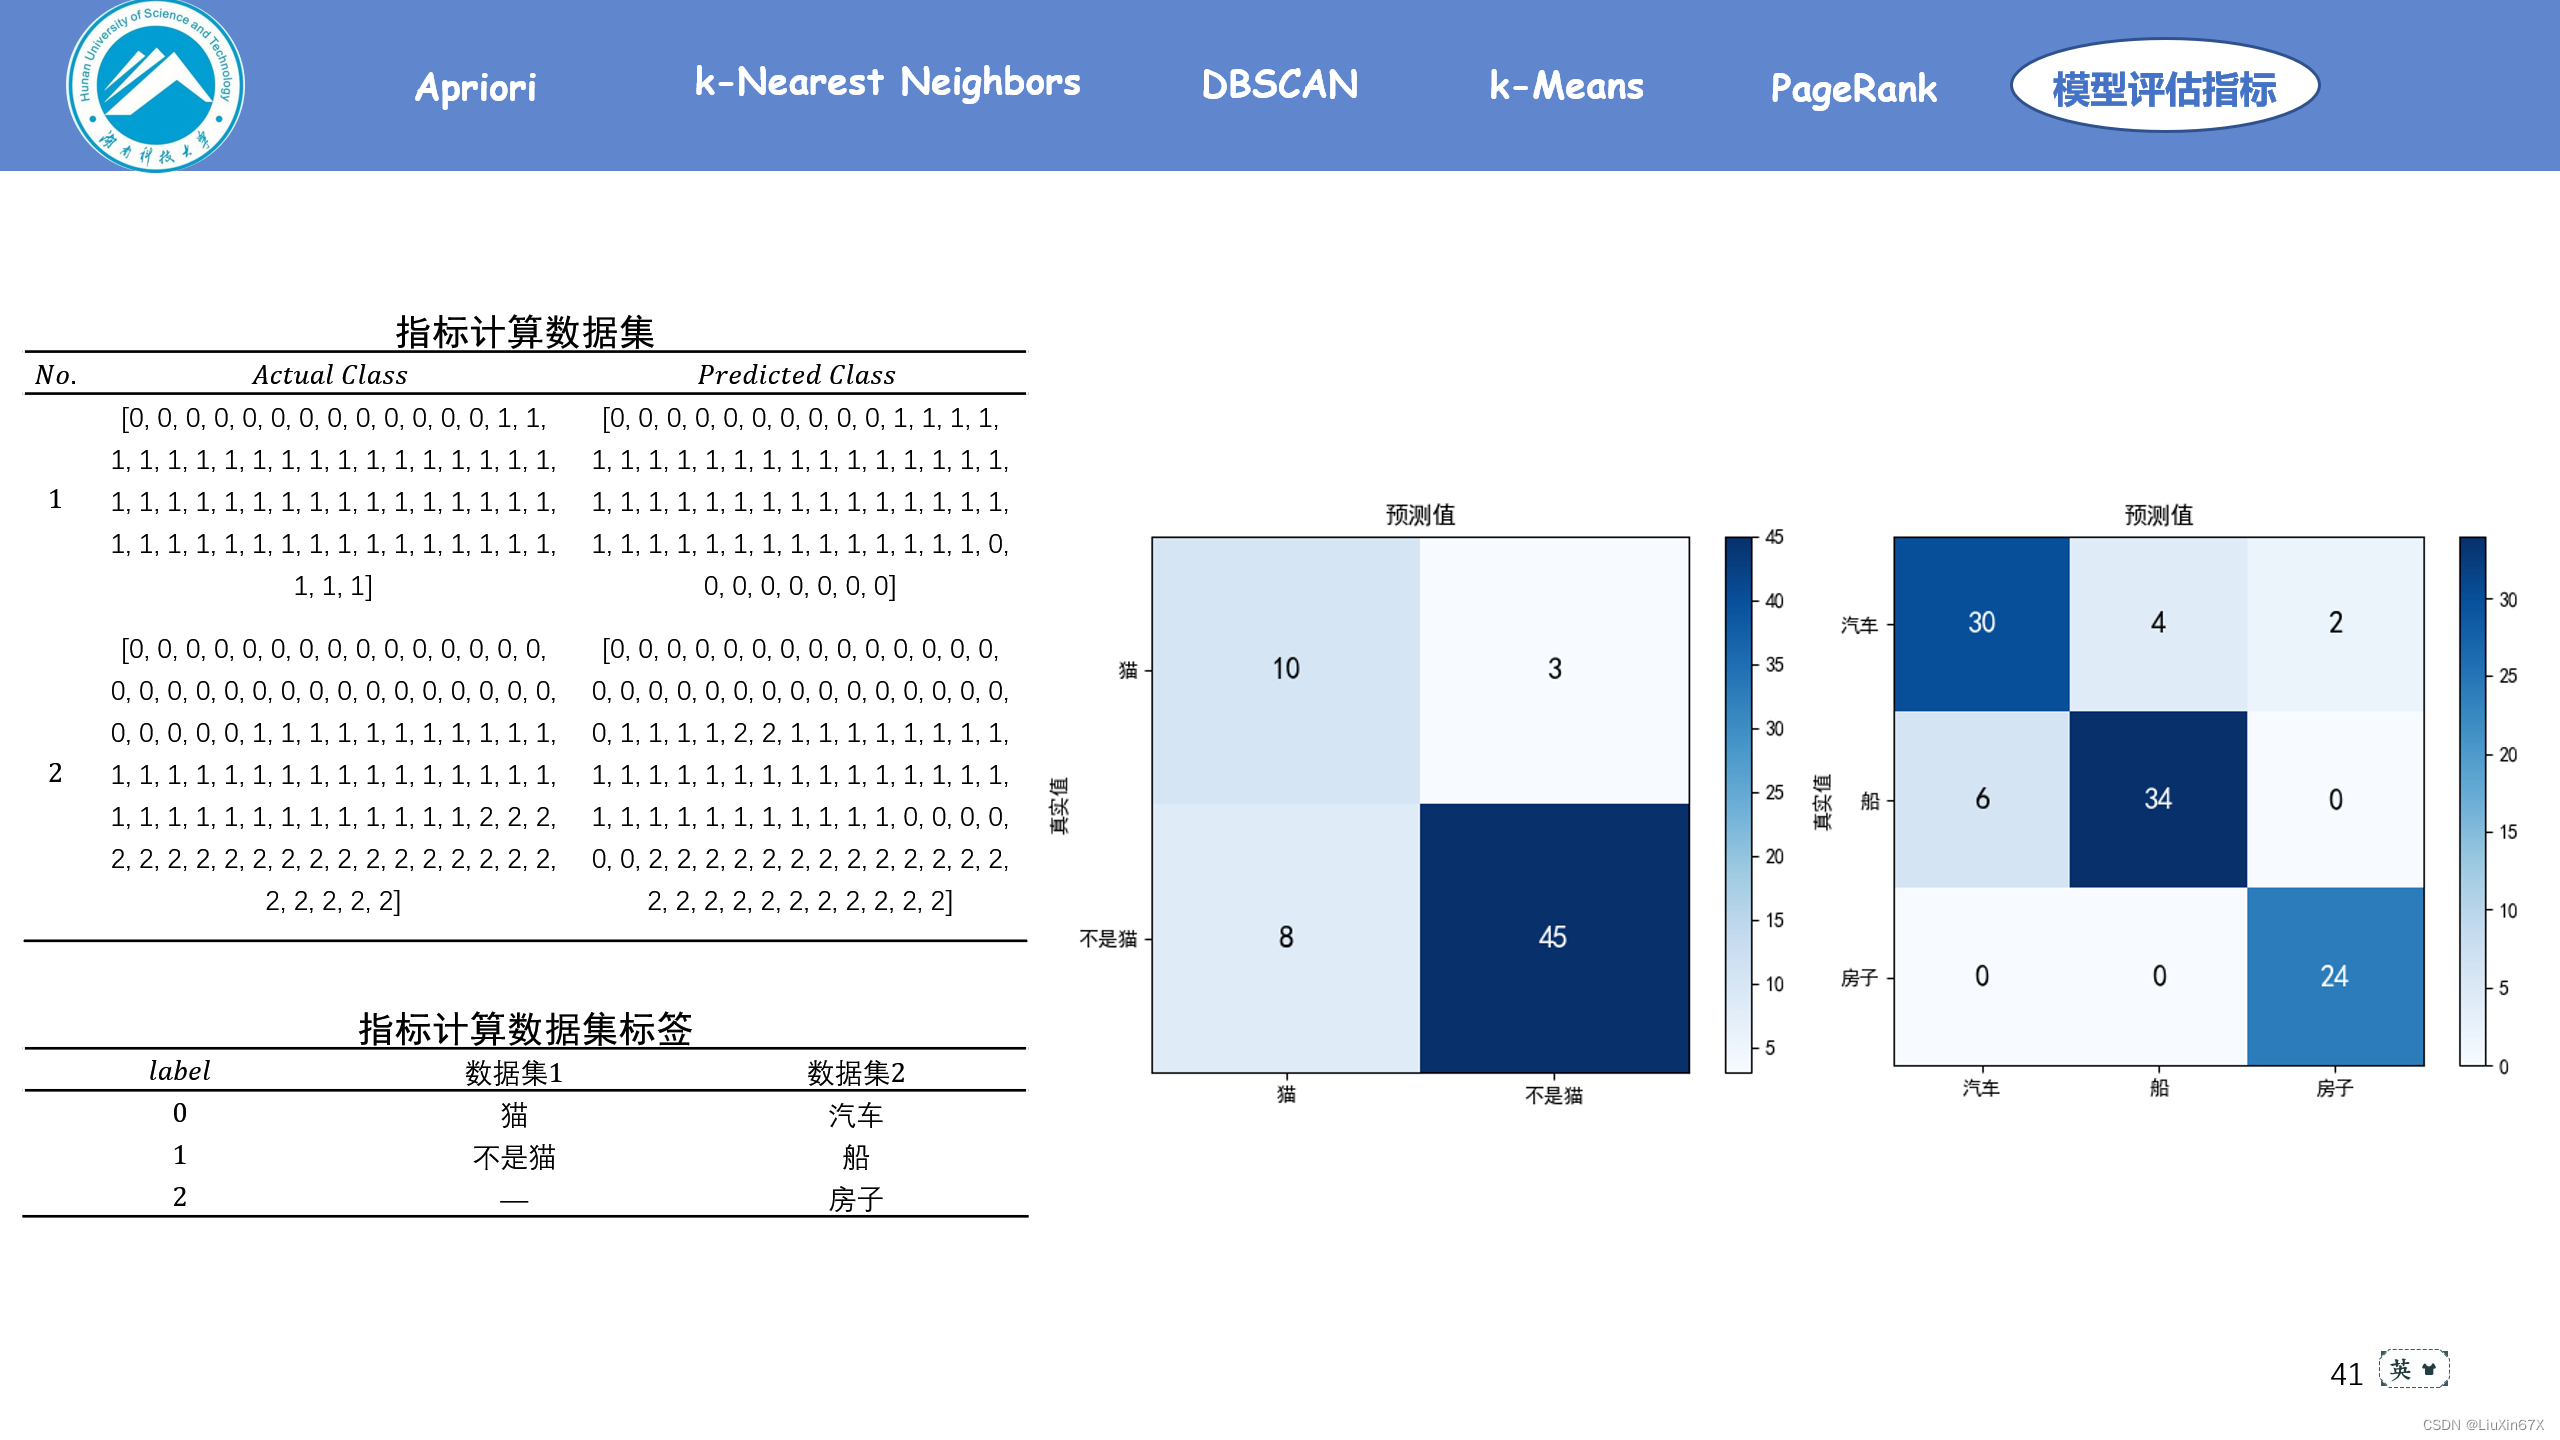
label_1 = ['猫', '不是猫']
res_1 = cal_confusion(gt_label_1, pre_label_1, n_class_1)
# print(res_1)
draw(res_1, label_1)
ACC_1 = ACC(res_1)
print('ACC_1={}'.format(ACC_1))
PPV_1_cat = PPV(res_1, label_1, '猫')
print('PPV(猫)={}'.format(PPV_1_cat))
PPV_1_not_cat = PPV(res_1, label_1, '不是猫')
print('PPV(不是猫)={}'.format(PPV_1_not_cat))
TPR_1_cat = TPR(res_1, label_1, '猫')
print('TPR(猫)={}'.format(TPR_1_cat))
TPR_1_not_cat = TPR(res_1, label_1, '不是猫')
print('TPR(不是猫)={}'.format(TPR_1_not_cat))
F1_Score_1_cat = Fn_Score(res_1, label_1, '猫', 1)
print('F1-Score(猫)={}'.format(F1_Score_1_cat))
F1_Score_1_not_cat = Fn_Score(res_1, label_1, '不是猫', 1)
print('F1-Score(不是猫)={}'.format(F1_Score_1_not_cat))
print()
gt_label_2 = np.array(
[0, 0, 0, 0, 0, 0, 0, 0, 0, 0, 0, 0, 0, 0, 0, 0, 0, 0, 0, 0,
0, 0, 0, 0, 0, 0, 0, 0, 0, 0, 0, 0, 0, 0, 0, 0, 1, 1, 1, 1,
1, 1, 1, 1, 1, 1, 1, 1, 1, 1, 1, 1, 1, 1, 1, 1, 1, 1, 1, 1,
1, 1, 1, 1, 1, 1, 1, 1, 1, 1, 1, 1, 1, 1, 1, 1, 2, 2, 2, 2,
2, 2, 2, 2, 2, 2, 2, 2, 2, 2, 2, 2, 2, 2, 2, 2, 2, 2, 2, 2])
pre_label_2 = np.array(
[0, 0, 0, 0, 0, 0, 0, 0, 0, 0, 0, 0, 0, 0, 0, 0, 0, 0, 0, 0,
0, 0, 0, 0, 0, 0, 0, 0, 0, 0, 1, 1, 1, 1, 2, 2, 1, 1, 1, 1,
1, 1, 1, 1, 1, 1, 1, 1, 1, 1, 1, 1, 1, 1, 1, 1, 1, 1, 1, 1,
1, 1, 1, 1, 1, 1, 1, 1, 1, 1, 0, 0, 0, 0, 0, 0, 2, 2, 2, 2,
2, 2, 2, 2, 2, 2, 2, 2, 2, 2, 2, 2, 2, 2, 2, 2, 2, 2, 2, 2])
n_class_2 = 3
label_2 = ['汽车', '船', '房子']
res_2 = cal_confusion(gt_label_2, pre_label_2, n_class_2)
# print(res_2)
draw(res_2, label_2)
ACC_2 = ACC(res_2)
print('ACC_2={}'.format(ACC_2))
PPV_2_car = PPV(res_2, label_2, '汽车')
print('PPV(汽车)={}'.format(PPV_2_car))
PPV_2_ship = PPV(res_2, label_2, '船')
print('PPV(船)={}'.format(PPV_2_ship))
PPV_2_house = PPV(res_2, label_2, '房子')
print('PPV(房子)={}'.format(PPV_2_house))
TPR_2_car = TPR(res_2, label_2, '汽车')
print('TPR(汽车)={}'.format(TPR_2_car))
TPR_2_ship = TPR(res_2, label_2, '船')
print('TPR(船)={}'.format(TPR_2_ship))
TPR_2_house = TPR(res_2, label_2, '房子')
print('TPR(房子)={}'.format(TPR_2_house))
F1_Score_2_car = Fn_Score(res_2, label_2, '汽车', 1)
print('F1-Score(汽车)={}'.format(F1_Score_2_car))
F1_Score_2_ship = Fn_Score(res_2, label_2, '船', 1)
print('F1-Score(船)={}'.format(F1_Score_2_ship))
F1_Score_2_house = Fn_Score(res_2, label_2, '房子', 1)
print('F1-Score(房子)={}'.format(F1_Score_2_house))
print()
label = np.array([0, 0, 0, 1, 1, 0, 1, 1])
scores = np.array([0.1, 0.2, 0.3, 0.3, 0.6, 0.7, 0.8, 0.9])
AUC = ROC_AUC(label, scores)
print('AUC={}'.format(AUC))
if __name__ == "__main__":
main()


 2575
2575

 被折叠的 条评论
为什么被折叠?
被折叠的 条评论
为什么被折叠?
 到【灌水乐园】发言


