


 本文详细介绍了如何利用crash工具分析由kdump生成的vmcore文件,包括环境准备、内核映像、常用命令如bt、log、dis、mod、sym、ps、vm、task、kmem、struct、rd和p等,以理解内核崩溃原因并进行故障排查。
目录
一、简介
本文主要介绍使用crash工具对kdump生成的vmcore文件进行分析,解析常见的crash命令,前面已讲述两章关于Kdump的内容,读者感兴趣可以点击下面的链接:
2、Kdump配置及使用详细总结(二)
系统产生异常时,触发Kdump机制,启动捕获内核,用以对生产内核下的内存进行收集和转存。
Kdump用于对内存镜像的转储,它不但可以转储内存镜像到本地硬盘,还可以将内存镜像通过NFS,SSH等协议转储到不同机器的设备上。
本文是将生产内核的内存数据转储在/var/crash目录下,下面开始对其进行分析。
分析vmcore的主要目的:
1、明白内核崩溃的大致原因;
2、对内核崩溃的原因做更细致的分析;
crash是一个被广泛应用的内核奔溃转储文件分析工具。crash工具跟gdb很类似,它可以交互的分析运行中的内核,也可以分析由kdump、netdump、diskdump、xendump产生的core dump文件。
二、vmcore分析
2.1 环境及相关文件准备
使用crash工具分析vmcore,需要:
(1)crash工具(crash);
(2)崩溃转储文件(vmcore);
(3)发生崩溃的内核映像文件(vmlinux),包含调试内核所需调试信息;
(4)crash下不同命令分析vmcore文件。
具体操作:
(1)安装crash工具
[root@localhost /]# yum install crash
(2)崩溃转储文件(vmcore)
发生Kdump后在/var/crash下会生成vmcore文件,也可以手动进入Kdump生成vmcore,具体操作可参考本人博客kdump第二篇,具体链接在文章开头。
(3)准备内核映像文件
一般系统在安装后在/boot目录下,也有个内核映像文件,vmlinuxz开头的文件,但是它是压缩过后的,无法完成调试工作。
我们需要一个带内核调试信息的vmlinux镜像,它有两种获取方式:
1、手动编译vmlinux
手动编译就是正常的编译一个Linux内核,不具体介绍了。
需要注意的是,make menuconfig里配置CONFIG_DEBUG_INFO=y。
2、官网下载vmlinux
下载带有完整调试信息的内核映像文件,内核调试信息包kernel-debuginfo有两个:
kernel-debuginfo
kernel-debuginfo-common
对于centos系统,可以在http://debuginfo.centos.org/上下载到各发行版本所需的调试包。
可以通过直接解开这两个包找到vmlinux或者安装这两个包在/lib/debug/lib/modules/3.10.0.x86_64/目录下看到vmlinux内核映像文件:
[root@localhost /]# rpm2cpio xxx.rpm|cpio -idvm //当前目录解开该安装包
(4)crash下不同命令分析vmcore文件
1、进入crash环境
[root@localhost /]# crash /lib/debug/lib/modules/3.10.0.el7.x86_64/vmlinux /var/crash/127.0.0.1-2022-05-06-17\:25\:34/vmcore

GNU gdb (GDB) 7.6
Copyright (C) 2013 Free Software Foundation, Inc.
License GPLv3+: GNU GPL version 3 or later <http://gnu.org/licenses/gpl.html>
This is free software: you are free to change and redistribute it.
There is NO WARRANTY, to the extent permitted by law.  Type "show copying"
and "show warranty" for details.
This GDB was configured as "x86_64-unknown-linux-gnu"...

      KERNEL: /boot/vmlinux
    DUMPFILE: /var/crash/127.0.0.1-2022-05-06-17:25:41/vmcore  [PARTIAL DUMP]
        CPUS: 8
        DATE: Fri May 06 17:25:34 2022
      UPTIME: 00:34:45
LOAD AVERAGE: 3.37, 3.71, 3.38
       TASKS: 1316
    NODENAME: fe0fdb76-b761-11e9-b107-0014101e89e7
     RELEASE: 3.10.0+
     VERSION: #1 SMP Thu Dec 24 16:27:16 CST 2020
     MACHINE: x86_64  (3408 Mhz)
      MEMORY: 31.9 GB
       PANIC: "SysRq : Trigger a crash"
         PID: 1942
     COMMAND: "bash"
        TASK: ffff88068c957300  [THREAD_INFO: ffff88062b8f4000]
         CPU: 2
       STATE: TASK_RUNNING (SYSRQ)
2、bt命令
backtrace打印内核栈回溯信息,bt pid 打印指定进程栈信息。
crash> bt 1942
PID: 1942   TASK: ffff88068c957300  CPU: 2   COMMAND: "bash"
 #0 [ffff88062b8f7b48] machine_kexec at ffffffff81051e9b
 #1 [ffff88062b8f7ba8] crash_kexec at ffffffff810f27e2
 #2 [ffff88062b8f7c78] oops_end at ffffffff81689948
 #3 [ffff88062b8f7ca0] no_context at ffffffff816793f1
 #4 [ffff88062b8f7cf0] __bad_area_nosemaphore at ffffffff81679487
 #5 [ffff88062b8f7d38] bad_area_nosemaphore at ffffffff816795f1
 #6 [ffff88062b8f7d48] __do_page_fault at ffffffff8168c6ce
 #7 [ffff88062b8f7da8] do_page_fault at ffffffff8168c863
 #8 [ffff88062b8f7dd0] page_fault at ffffffff81688b48
    [exception RIP: sysrq_handle_crash+22]
    RIP: ffffffff813baf16  RSP: ffff88062b8f7e80  RFLAGS: 00010046
    RAX: 000000000000000f  RBX: ffffffff81a7b180  RCX: 0000000000000000
    RDX: 0000000000000000  RSI: ffff88086ec8f6c8  RDI: 0000000000000063
    RBP: ffff88062b8f7e80   R8: 0000000000000092   R9: 0000000000000e37
    R10: 0000000000000e36  R11: 0000000000000003  R12: 0000000000000063
    R13: 0000000000000246  R14: 0000000000000004  R15: 0000000000000000
    ORIG_RAX: ffffffffffffffff  CS: 0010  SS: 0018
 #9 [ffff88062b8f7e88] __handle_sysrq at ffffffff813bb6d2
#10 [ffff88062b8f7ec0] write_sysrq_trigger at ffffffff813bbbaf
#11 [ffff88062b8f7ed8] proc_reg_write at ffffffff812494bd
#12 [ffff88062b8f7ef8] vfs_write at ffffffff811dee9d
#13 [ffff88062b8f7f38] sys_write at ffffffff811df93f
#14 [ffff88062b8f7f80] system_call_fastpath at ffffffff81691049
    RIP: 00007fb320bcb500  RSP: 00007ffde533c198  RFLAGS: 00000246
    RAX: 0000000000000001  RBX: ffffffff81691049  RCX: ffffffffffffffff
    RDX: 0000000000000002  RSI: 00007fb3214eb000  RDI: 0000000000000001
    RBP: 00007fb3214eb000   R8: 000000000000000a   R9: 00007fb3214d5740
    R10: 0000000000000001  R11: 0000000000000246  R12: 0000000000000001
    R13: 0000000000000002  R14: 00007fb320e9f400  R15: 0000000000000002
    ORIG_RAX: 0000000000000001  CS: 0033  SS: 002b

解析:
    可以看到最后几步触发了缺页异常,进入crash_kexec的流程,最后调用 machine_kexec()。这通常是一个硬件相关的函数。它会引导启动捕获内核,从而完成 kdump 的过程。
    代码就是走到了sysrq_handle_crash函数首地址+0x22这段命令的时候,触发的缺页异常。

注意:
    这里,对应x86-64汇编,应用层下来的系统调用对应的6个参数存放的寄存器依次对应:rdi、rsi、rdx、rcx、r8、r9。对于多于6个参数的,仍存储在栈上。
3、log命令
打印vmcore所在的系统内核dmesg日志信息
crash> log
[    0.000000] Booting Linux on physical CPU 0x0000000000 [0x411fd070]
[    0.000000] Linux version 4.20.0-rc4-00007-gef78e5e (root@localhost.localdomain) (gcc version 7.3.1 20180425 [linaro-7.3-2018.05 revision d29120a424ecfbc167ef90065c0eeb7f91977701] (Linaro GCC 7.3-2018.05)) #3 SMP PREEMPT Wed Jan 15 07:52:10 PST 2020
[    0.000000] Machine model: linux,dummy-virt
[    0.000000] efi: Getting EFI parameters from FDT:
[    0.000000] efi: UEFI not found.
[    0.000000] cma: Reserved 32 MiB at 0x00000000be000000
[    0.000000] NUMA: No NUMA configuration found
[    0.000000] NUMA: Faking a node at [mem 0x0000000040000000-0x00000000bfffffff]
[    0.000000] NUMA: NODE_DATA [mem 0xbdfea840-0xbdfebfff]
[    0.000000] Zone ranges:
[    0.000000]   DMA32    [mem 0x0000000040000000-0x00000000bfffffff]
[    0.000000]   Normal   empty
[    0.000000] Movable zone start for each node
[    0.000000] Early memory node ranges
[    0.000000]   node   0: [mem 0x0000000040000000-0x00000000bfffffff]
[    0.000000] Initmem setup node 0 [mem 0x0000000040000000-0x00000000bfffffff]
[    0.000000] On node 0 totalpages: 524288
[    0.000000]   DMA32 zone: 8192 pages used for memmap
[    0.000000]   DMA32 zone: 0 pages reserved
[    0.000000]   DMA32 zone: 524288 pages, LIFO batch:63
[    0.000000] psci: probing for conduit method from DT.
[    0.000000] psci: PSCIv0.2 detected in firmware.
[    0.000000] psci: Using standard PSCI v0.2 function IDs
[    0.000000] psci: Trusted OS migration not required
[    0.000000] random: get_random_bytes called from start_kernel+0xa8/0x418 with crng_init=0
[    0.000000] percpu: Embedded 23 pages/cpu @(____ptrval____) s55704 r8192 d30312 u94208
[    0.000000] pcpu-alloc: s55704 r8192 d30312 u94208 alloc=23*4096
[    0.000000] pcpu-alloc: [0] 0 [0] 1
[    0.000000] Detected PIPT I-cache on CPU0
[    0.000000] CPU features: enabling workaround for ARM erratum 832075
[    0.000000] CPU features: enabling workaround for ARM erratum 834220
[    0.000000] CPU features: enabling workaround for EL2 vector hardening
[    0.000000] CPU features: detected: Kernel page table isolation (KPTI)
[    0.000000] Built 1 zonelists, mobility grouping on.  Total pages: 516096
[    0.000000] Policy zone: DMA32
[    0.000000] Kernel command line: rdinit=/linuxrc console=ttyAMA0
[    0.000000] Memory: 2009884K/2097152K available (10876K kernel code, 1414K rwdata, 5100K rodata, 1344K init, 380K bss, 54500K reserved, 32768K cma-reserved)
[    0.000000] SLUB: HWalign=64, Order=0-3, MinObjects=0, CPUs=2, Nodes=1
[    0.000000] rcu: Preemptible hierarchical RCU implementation.
[    0.000000] rcu:     RCU restricting CPUs from NR_CPUS=64 to nr_cpu_ids=2.
[    0.000000]  Tasks RCU enabled.
[    0.000000] rcu: RCU calculated value of scheduler-enlistment delay is 25 jiffies.
[    0.000000] rcu: Adjusting geometry for rcu_fanout_leaf=16, nr_cpu_ids=2
[    0.000000] NR_IRQS: 64, nr_irqs: 64, preallocated irqs: 0
[    0.000000] GICv2m: range[mem 0x08020000-0x08020fff], SPI[80:143]
[    0.000000] arch_timer: cp15 timer(s) running at 62.50MHz (virt).
[    0.000000] clocksource: arch_sys_counter: mask: 0xffffffffffffff max_cycles: 0x1cd42e208c, max_idle_ns: 881590405314 ns
4、dis命令
dis -l (function+offset) 10 反汇编出指令所在代码,10代表打印该指定位置开始的10行信息。
crash> dis -l sysrq_handle_crash+22 10
/home/zhugeyifan/source/jd4000/jd4000_x86/packages/linux_lsp/kernel/linux-3.10.0/drivers/tty/sysrq.c: 138
0xffffffff813baf16 <sysrq_handle_crash+22>:     movb   $0x1,0x0
/home/zhugeyifan/source/jd4000/jd4000_x86/packages/linux_lsp/kernel/linux-3.10.0/drivers/tty/sysrq.c: 139
0xffffffff813baf1e <sysrq_handle_crash+30>:     pop    %rbp
0xffffffff813baf1f <sysrq_handle_crash+31>:     retq
/home/zhugeyifan/source/jd4000/jd4000_x86/packages/linux_lsp/kernel/linux-3.10.0/drivers/tty/sysrq.c: 85
0xffffffff813baf20 <sysrq_handle_loglevel>:     nopl   0x0(%rax,%rax,1) [FTRACE NOP]
0xffffffff813baf25 <sysrq_handle_loglevel+5>:   push   %rbp
/home/zhugeyifan/source/jd4000/jd4000_x86/packages/linux_lsp/kernel/linux-3.10.0/drivers/tty/sysrq.c: 90
0xffffffff813baf26 <sysrq_handle_loglevel+6>:   xor    %eax,%eax
/home/zhugeyifan/source/jd4000/jd4000_x86/packages/linux_lsp/kernel/linux-3.10.0/drivers/tty/sysrq.c: 89
0xffffffff813baf28 <sysrq_handle_loglevel+8>:   movl   $0x7,0x6322be(%rip)        # 0xffffffff819ed1f0 <console_printk>
/home/zhugeyifan/source/jd4000/jd4000_x86/packages/linux_lsp/kernel/linux-3.10.0/drivers/tty/sysrq.c: 85
0xffffffff813baf32 <sysrq_handle_loglevel+18>:  mov    %rsp,%rbp
0xffffffff813baf35 <sysrq_handle_loglevel+21>:  push   %rbx
/home/zhugeyifan/source/jd4000/jd4000_x86/packages/linux_lsp/kernel/linux-3.10.0 -- MORE --  forward: <SPACE>, <ENTER> or j  backward: b or k
/drivers/tty/sysrq.c: 88
0xffffffff813baf36 <sysrq_handle_loglevel+22>:  lea    -0x30(%rdi),%ebx

解析:
    代码位置+函数+函数偏移位置+该位置的汇编指令...
    很容易定义到具体的哪一行代码,更方便我们去分析问题的原因!
5、mod命令
mod 查看当时内核加载的所有内核模块信息
重装加载进改内核模块:
crash> mod -s my_test_lkm /mnt/shared/my_test.ko
     MODULE       NAME                            SIZE  OBJECT FILE
ffffffffc07c7000  my_test                    12740  /mnt/shared/my_test.ko
6、sym命令
“sym 内存地址”转换指定符号为其虚拟地址,显示系统中对应的符号表信息,并且具体到源代码的那一行
如上面bt打印的RIP: ffffffffc07c5024,使用sym转换查看系统符号信息
sym addr 通过虚拟地址,显示symbol和源码位置
crash> sym ffffffffc07c5024
ffffffffc07c5024 (t) my_openat+36 [my_test_lkm] /mnt/hgfs/test_ko/lkm-test05/my_lkm.c: 25

sym symbol 通过symbol,显示虚拟地址和源码位置:
crash> sym vfs_fstat
ffffffff81196f30 (T) vfs_fstat ../debug/kernel-3.8.13/linux-3.8.13-44.1.1.el6uek/fs/stat.c: 59
7、ps命令
ps 打印内核崩溃时,正常的进程信息
带 > 标识代表是活跃的进程,ps pid打印某指定进程的状态信息:
crash> ps 27005
   PID    PPID  CPU       TASK        ST  %MEM     VSZ    RSS  COMM
> 27005   7783   1  ffff997b388ae180  RU   0.2   91732   4124  pickup
>
查看指定进程的进程树,显示进程父子关系(ps -p pid)
crash> ps -p 85151
PID: 0      TASK: ffffffff818b6420  CPU: 0   COMMAND: "swapper/0"
 PID: 1      TASK: ffff881f91dae040  CPU: 28  COMMAND: "init"
  PID: 14544  TASK: ffff881f8d7b05c0  CPU: 11  COMMAND: "init.tfa"
   PID: 85138  TASK: ffff880bab01a400  CPU: 8   COMMAND: "tfactl"
    PID: 85151  TASK: ffff880b7a728380  CPU: 17  COMMAND: "perl"
ps -t [pid]: 显示进程运行时间
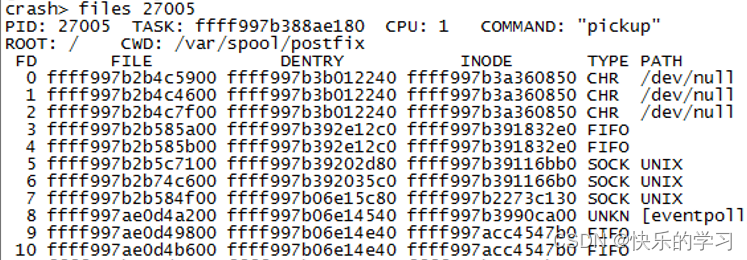
8、files命令
files pid 打印指定进程所打开的文件信息
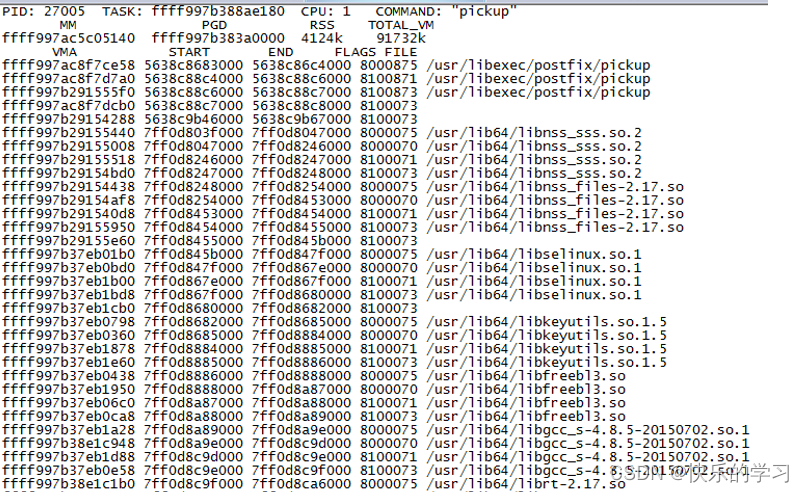
9、vm命令
vm pid 打印某指定进程当时虚拟内存基本信息
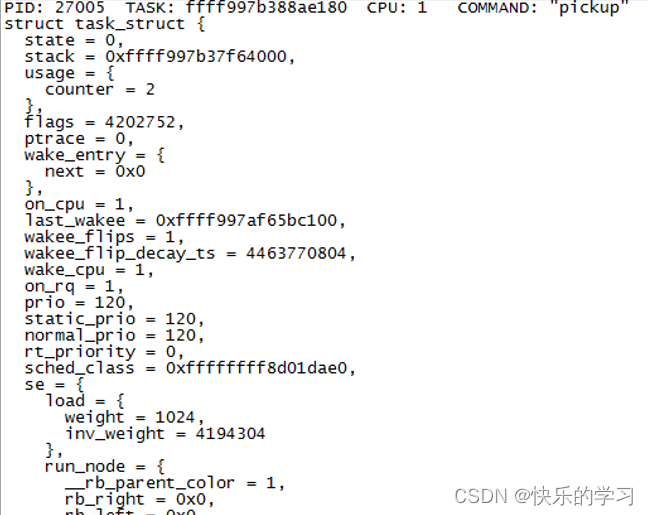
10、task命令
task 查看当前进程或指定进程task_struct和thread_info的信息
11、kmem命令
查看当时系统内存使用信息
kmem [-f|-F|-c|-C|-i|-v|-V|-n|-z|-o|-h] [-p | -m member[,member]]
       [[-s|-S] [slab] [-I slab[,slab]]] [-g [flags]] [[-P] address]]
kmem -i         //查看内存整体使用情况
kmem -s        //查看slab使用情况
kmem [addr]   //搜索地址所属的内存结构
crash> kmem -i
                 PAGES        TOTAL      PERCENTAGE
    TOTAL MEM   511276         2 GB         ----
         FREE   506631       1.9 GB   99% of TOTAL MEM
         USED     4645      18.1 MB    0% of TOTAL MEM
       SHARED      353       1.4 MB    0% of TOTAL MEM
      BUFFERS        0            0    0% of TOTAL MEM
       CACHED      480       1.9 MB    0% of TOTAL MEM
         SLAB     1930       7.5 MB    0% of TOTAL MEM

   TOTAL HUGE        0            0         ----
    HUGE FREE        0            0    0% of TOTAL HUGE

   TOTAL SWAP        0            0         ----
    SWAP USED        0            0    0% of TOTAL SWAP
    SWAP FREE        0            0    0% of TOTAL SWAP

 COMMIT LIMIT   255638     998.6 MB         ----
    COMMITTED      479       1.9 MB    0% of TOTAL LIMIT
crash>
12、struct命令
struct -o [struct]            //显示结构体中成员的偏移
struct [struct] [address]    //显示对应地址结构体的值
[struct] [address]          //简化形式显示对应地址结构体的值
[struct] [address] -xo     //打印结构体定义和大小
[struct].member[address]  //显示某个成员的值
1、查看结构体成员变量,直接struct后面跟结构体名,比如我要看下内核中dentry结构体的定义,可以这样:
crash> struct dentry
struct dentry {
    unsigned int d_flags;
    seqcount_t d_seq;
    struct hlist_bl_node d_hash;
    struct dentry *d_parent;
    struct qstr d_name;
    struct inode *d_inode;
    unsigned char d_iname[32];
    unsigned int d_count;
    spinlock_t d_lock;
    const struct dentry_operations *d_op;
    struct super_block *d_sb;
    long unsigned int d_time;
    void *d_fsdata;
    struct list_head d_lru;
    union {
        struct list_head d_child;
        struct callback_head d_rcu;
    } d_u;
    struct list_head d_subdirs;
    struct hlist_node d_alias;
}
SIZE: 192
2、查看成员变量在结构体中的偏移量,struct加-o选项:
crash> struct dentry -o
struct dentry {
    [0] unsigned int d_flags;
    [4] seqcount_t d_seq;
    [8] struct hlist_bl_node d_hash;
   [24] struct dentry *d_parent;
   [32] struct qstr d_name;
   [48] struct inode *d_inode;
   [56] unsigned char d_iname[32];
   [88] unsigned int d_count;
   [92] spinlock_t d_lock;
   [96] const struct dentry_operations *d_op;
  [104] struct super_block *d_sb;
  [112] long unsigned int d_time;
  [120] void *d_fsdata;
  [128] struct list_head d_lru;
        union {
            struct list_head d_child;
            struct callback_head d_rcu;
  [144] } d_u;
  [160] struct list_head d_subdirs;
  [176] struct hlist_node d_alias;
}
SIZE: 192

crash> struct dentry.d_inode
struct dentry {
   [48] struct inode *d_inode;
}
3、查看内存中指定结构体的值,struct后跟指针地址
crash> struct dentry ffff881fbdc02c80
struct dentry {
  d_flags = 136,
  d_seq = {
    sequence = 4
  },
  d_hash = {
    next = 0x0,
    pprev = 0xffffc900031bd8a0
  },
  d_parent = 0xffff881fbdc02ec0,
  d_name = {
    {
      {
        hash = 1819047278,
        len = 4
      },
      hash_len = 18998916462
    },
    name = 0xffff881fbdc02cb8 "null"
  },
注:如果要查看二阶指针的值,可以通过rd命令需要先获取一级指针的值,然后再用struct 结构体名 + addr获取具体的值
13、rd命令
读取内存内容
rd [addr] [len]                  //查看指定地址,长度为len的内存
rd -S [addr][len]               //尝试将地址转换为对应的符号
rd [addr] -e [addr]            //查看指定内存区域内容
crash> rd ffff0000085dc0d0 32
ffff0000085dc0d0:  a8c17bfd39000020 d503201fd65f03c0    ..9.{...._.. ..
ffff0000085dc0e0:  910003fda9bf7bfd 97ec827fd50342ff   .{.......B......
ffff0000085dc0f0:  d65f03c0a8c17bfd 910003fda9bd7bfd   .{...._..{......
ffff0000085dc100:  b0005d73a90153f3 aa0103f4911b2262   .S..s]..b"......
ffff0000085dc110:  f90017a1f9400041 910083a2d2800001   A.@.............
ffff0000085dc120:  37f8018097f909a2 f10bfc7ff94013a3   .......7..@.....
ffff0000085dc130:  b000656154000228 f940128491018021   (..Tae..!.....@.
ffff0000085dc140:  b940402252800000 1100044279000083   ...R"@@....yB...
ffff0000085dc150:  911b2273b9004022 f9400261f94017a2   "@..s"....@.a.@.
ffff0000085dc160:  b50000c1ca010041 a8c37bfda94153f3   A........SA..{..
ffff0000085dc170:  128002a0d65f03c0 97ebee0b17fffff7   .._.............
ffff0000085dc180:  910003fda9be7bfd aa0003f4a90153f3   .{.......S......
ffff0000085dc190:  940b05adf9400013 97ec5fb991012260   ..@.....`"..._..
ffff0000085dc1a0:  97edbddd91052260 940b05c5aa1403e0   `"..............
ffff0000085dc1b0:  97f0ec85aa1303e0 a8c27bfda94153f3   .........SA..{..
ffff0000085dc1c0:  d503201fd65f03c0 52800021a9bf7bfd   .._.. ...{..!..R
下面将通过struct file**fd的地址,获取fd指针数组中各个file结构体成员地址(二阶指针存放的是file指针的地址,所以可以通过rd获取一级指针的地址;二阶指针+8,则指向下一个file结构体指针):
14、p命令
p命令可以用来打印出表达式或者变量的值
crash> p jiffies
jiffies = $7 = 4314305182
crash>
crash> p old_close_func
old_close_func = $5 = (close_t) 0xffffffff811ffd60 <SyS_close>
crash> p SyS_close
SyS_close = $6 =
 {long (long)} 0xffffffff811ffd60 <SyS_close>
crash> sym SyS_close
ffffffff811ffd60 (T) SyS_close /usr/src/debug/kernel-3.10.0-693.el7/linux-3.10.0.el7.x86_64/fs/open.c: 1113
15、查看某个命令使用方法及使用示例
使用help+某个命令,可以查看这个命令的使用方法及使用示例:
比如我们想看struct命令如何使用,可以执行 help struct命令:
crash> help struct

NAME
  struct - structure contents

SYNOPSIS
  struct struct_name[.member[,member]][-o][-l offset][-rfuxdp][address | symbol]
         [count | -c count]

DESCRIPTION
  This command displays either a structure definition, or a formatted display
  of the contents of a structure at a specified address.  When no address is
  specified, the structure definition is shown along with the structure size.
  A structure member may be appended to the structure name in order to limit
  the scope of the data displayed to that particular member; when no address
  is specified, the member's offset and definition are shown.

    struct_name  name of a C-code structure used by the kernel.
        .member  name of a structure member; to display multiple members of a
                 structure, use a comma-separated list of members.
             -o  show member offsets when displaying structure definitions;
                 if used with an address or symbol argument, each member will
                 be preceded by its virtual address.
      -l offset  if the address argument is a pointer to a structure member that
                 is contained by the target data structure, typically a pointer
                 to an embedded list_head, the offset to the embedded member may
                 be entered in either of the following manners:
                   1. in "structure.member" format.
                   2. a number of bytes.
             -r  raw dump of structure data.
             -f  address argument is a dumpfile offset.
             -u  address argument is a user virtual address in the current
                 context.
             -x  override default output format with hexadecimal format.
             -d  override default output format with decimal format.
             -p  if a structure member is a pointer value, show the member's
                 data type on the output line; and on the subsequent line(s),
                 dereference the pointer, display the pointer target's symbol
                 value in brackets if appropriate, and if possible, display the
                 target data; requires an address argument.
        address  hexadecimal address of a structure; if the address points
                 to an embedded list_head structure contained within the
                 target data structure, then the "-l" option must be used.
         symbol  symbolic reference to the address of a structure.
          count  count of structures to dump from an array of structures;
                 if used, this must be the last argument entered.
       -c count  "-c" is only required if "count" is not the last argument
                 entered or if a negative number is entered; if a negative
                 value is entered, the (positive) "count" structures that
                 lead up to and include the target structure will be displayed.

  Structure data, sizes, and member offsets are shown in the current output
  radix unless the -x or -d option is specified.


 1133
1133

 被折叠的 条评论
为什么被折叠?
被折叠的 条评论
为什么被折叠?
 到【灌水乐园】发言


