


循环神经网络(RNN)具有记忆功能,适合解决连续序列的问题,善于从具有一定顺序意义的样本与样本间学习规律。
实例:使用RNN网络拟合回声信号序列,使用一串随机的模拟数据作为原始信号,让RNN网络来拟合其对应的回声信号。
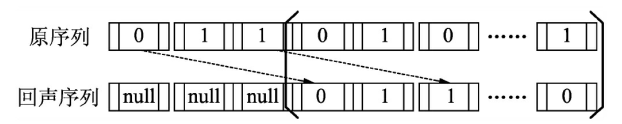
样本数据为一串随机的由0、1组成的数字,将其当成发射出去的一串信号。当碰到阻挡被反弹回来时,会收到原始信号的回音。
如果步长为3,那么输入和输出的序列如图:
import numpy as np
import tensorflow as tf
import matplotlib.pyplot as plt

num_epochs = 5
total_series_length = 50000
truncated_backprop_length = 15
state_size = 4  # RNN 状态
num_classes = 2
echo_step = 3
batch_size = 5
num_batches = total_series_length//batch_size//truncated_backprop_length
样本生成:取50000个序列样本数据,每个测试数据截取15个序列,回声序列的步长为3,最小批次为5。
# 生成样本
def generateData():
    x = np.array(np.random.choice(2, total_series_length, p=[0.5, 0.5]))
    y = np.roll(x, echo_step) # 向右循环移位【1111000】---【0001111】
    y[0: echo_step] = 0   # 赋值为0

    x = x.reshape((batch_size, -1)) # (5, 10000)
    y = y.reshape((batch_size, -1))
    return (x, y)
定义占位符
batchX_placeholder = tf.placeholder(tf.float32, [batch_size, truncated_backprop_length])
batchY_placeholder = tf.placeholder(tf.int32, [batch_size, truncated_backprop_length])
init_state = tf.placeholder(tf.float32, [batch_size, state_size])

inputs_series = tf.unstack(batchX_placeholder, axis=1) #
labels_series = tf.unstack(batchY_placeholder, axis=1)
定义网络
current_state = init_state
predictions_series = []
losses = []
for current_input, labels in zip(inputs_series, labels_series):
    current_input = tf.reshape(current_input, [batch_size, 1])
    input_and_state_concatenated = tf.concat([current_input, current_state], 1)
    next_state = tf.contrib.layers.fully_connected(input_and_state_concatenated, state_size, activation_fn=tf.tanh)
    current_state = next_state
    logits = tf.contrib.layers.fully_connected(next_state, num_classes, activation_fn=None)
    loss = tf.nn.sparse_softmax_cross_entropy_with_logits(labels=labels, logits=logits)
    losses.append(loss)
    predictions = tf.nn.softmax(logits)
    predictions_series.append(predictions)

total_loss = tf.reduce_mean(losses)
train_step = tf.train.AdagradOptimizer(0.3).minimize(total_loss)
训练模型与可视化
def plot(loss_list, predictions_series, batchX, batchY):
    plt.subplot(2, 3, 1)
    plt.cla()
    plt.plot(loss_list)

    for batch_series_idx in range(batch_size):
        one_hot_output_series = np.array(predictions_series)[:, batch_series_idx, :]
        single_output_series = np.array([(1 if out[0] < 0.5 else 0) for out in one_hot_output_series])

        plt.subplot(2, 3, batch_series_idx + 2)
        plt.cla()
        plt.axis([0, truncated_backprop_length, 0, 2])
        left_offset = range(truncated_backprop_length)
        left_offset2 = range(echo_step,truncated_backprop_length+echo_step)

        label1 = "past values"
        label2 = "True echo values"
        label3 = "Predictions"
        plt.plot(left_offset2, batchX[batch_series_idx, :]*0.2+1.5, "o--b", label=label1)
        plt.plot(left_offset, batchY[batch_series_idx, :]*0.2+0.8,"x--b", label=label2)
        plt.plot(left_offset,  single_output_series*0.2+0.1 , "o--y", label=label3)

    plt.legend(loc='best')
    plt.draw()
    plt.pause(0.0001)

with tf.Session() as sess:
    sess.run(tf.global_variables_initializer())
    plt.ion()
    plt.figure()
    plt.show()
    loss_list = []

    for epoch_idx in range(num_epochs):
        x,y = generateData()
        _current_state = np.zeros((batch_size, state_size))

        print("New data, epoch", epoch_idx)

        for batch_idx in range(num_batches):#50000/ 5 /15=分成多少段
            start_idx = batch_idx * truncated_backprop_length
            end_idx = start_idx + truncated_backprop_length

            batchX = x[:,start_idx:end_idx]
            batchY = y[:,start_idx:end_idx]

            _total_loss, _train_step, _current_state, _predictions_series = sess.run(
                [total_loss, train_step, current_state, predictions_series],
                feed_dict={
                    batchX_placeholder:batchX,
                    batchY_placeholder:batchY,
                    init_state:_current_state
                })

            loss_list.append(_total_loss)

            if batch_idx%100 == 0:
                print("Step",batch_idx, "Loss", _total_loss)
                plot(loss_list, _predictions_series, batchX, batchY)

plt.ioff()
plt.show() 


 3063
3063


 被折叠的 条评论
为什么被折叠?
被折叠的 条评论
为什么被折叠?
 到【灌水乐园】发言


