


1、DCGM介绍
在前面给大家介绍了K8S环境下如何调度GPU,在显卡的实际应用中,监控是不可缺少的一环。通过监控,我们能更直观的了解到显卡的使用情况和各项监控指标。英伟达提供了DCGM (NVIDIA Data Center GPU Manager) 工具用于管理和监控集群环境中的N卡。

在K8S环境下,DCGM已经集成到dcgm-exporter中。dcgm-exporter可以将显卡相关监控指标以http接口的方式暴露给Prometheus。

2、dcgm-exporter安装
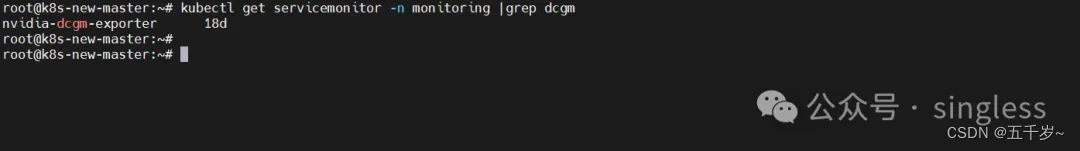
dcgm-exporter安装需要使用到servicemonitor。因此在安装前,我们需要先创建servicemonitor资源。如集群中已创建,则可忽略。
kubectl apply -f https://raw.githubusercontent.com/coreos/prometheus-operator/main/example/prometheus-operator-crd/monitoring.coreos.com_servicemonitors.yaml再使用helm安装dcgm-exporter
helm repo add gpu-helm-charts   https://nvidia.github.io/dcgm-exporter/helm-charts
helm repo update
helm install --generate-name gpu-helm-charts/dcgm-exporter -n monitoring
安装完成后检查相应的资源是否创建并启动
kubectl get all -n monitoring -owide|grep dcgm安装dcgm-exporter后,会起一个daemonset,默认会在每个node上起一个pod。如果node上没有相应的gpu资源,则pod会启动失败。同时会起一个svc,暴露9400端口,也就是dcgm-exporter暴露GPU监控指标的端口

同时会创建一个servicemonitor,用于告诉prometheus如何获取dcgm-exporter的数据
此时,我们已能够通过9400端口查看到GPU的监控指标

3、查看监控
登录Grafana,可以查看到显卡的使用情况及温度功耗等信息

4、参考资料
[1] https://developer.nvidia.com/dcgm
[2] https://github.com/NVIDIA/dcgm-exporter


 644
644


 被折叠的 条评论
为什么被折叠?
被折叠的 条评论
为什么被折叠?
 到【灌水乐园】发言


