


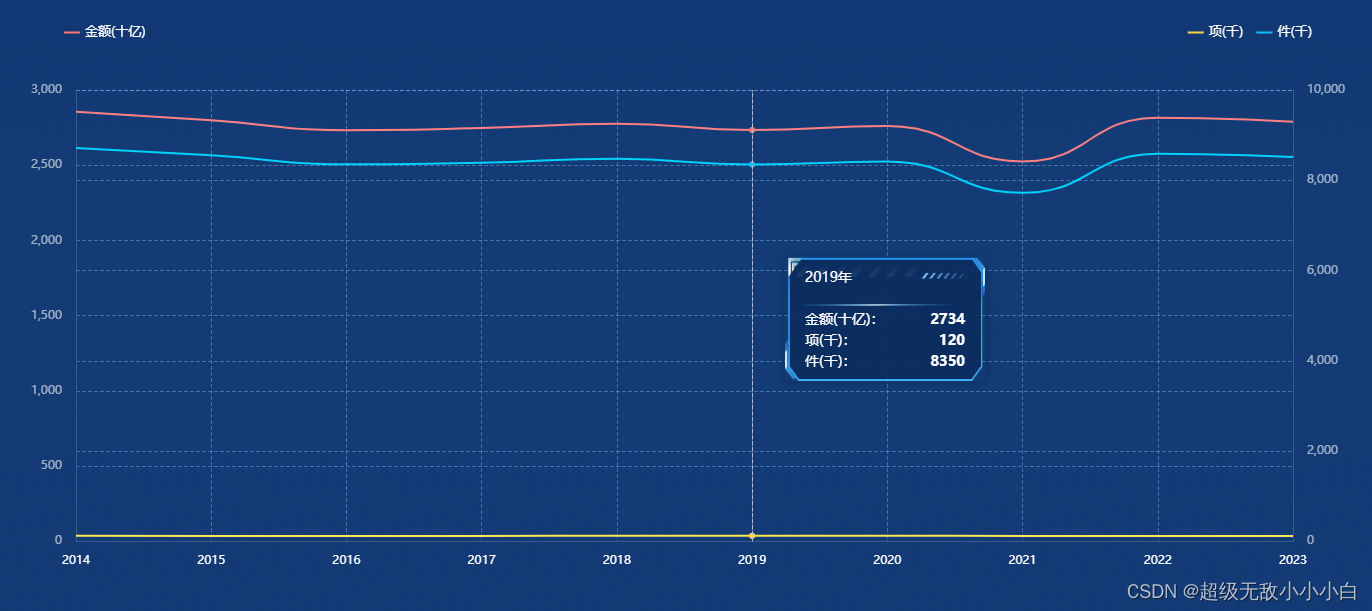
该示例有如下几个特点:
①实现tooltip自定义样式(echarts 实现tooltip提示框样式自定义-CSDN博客)
②legend左右区分展示
③双y轴折线展示
代码如下:
this.options = {
  grid: {
    left: "3%",
    right: "3%",
    top: "12%",
    bottom: "5%",
    containLabel: true,
  },
  tooltip: {
    show: true,
    trigger: "axis",
    textStyle: {
      align: "left",
    },
    className: "custom-tooltip-box",
    formatter: function (params) {
      return `<div class='custom-tooltip-style'>
        <span>${params[0].name}年</span></br>
        <div class="span">
          <span>${params[0].seriesName}:</span>
          <span>${params[0].value}</span>
        </div>
        <div class="span">
          <span>${params[1].seriesName}:</span>
          <span>${params[1].value}</span>
        </div>
        <div class="span">
          <span>${params[2].seriesName}:</span>
          <span>${params[2].value}</span>
        </div>
      </div>`;
    },
  },
  legend: [
    {
      show: true,
      align: "left",
      left: "5%",
      textStyle: {
        color: "#ffffff",
        fontSize: "13",
      },
      itemWidth: 16,
      itemHeight: 2,
      itemGap: 13,
      icon: "rect",
      data: ["金额(十亿)"],
    },
    {
      show: true,
      align: "left",
      right: "5%",
      textStyle: {
        color: "#ffffff",
        fontSize: "13",
      },
      itemWidth: 16,
      itemHeight: 2,
      itemGap: 13,
      icon: "rect",
      data: ["项(千)", "件(千)"],
    },
  ],
  xAxis: [
    {
      type: "category",
      boundaryGap: false,
      axisLine: {
        show: true,
        lineStyle: {
          color: "#355d8d",
        },
      },
      splitLine: {
        show: true,
        lineStyle: {
          type: "dashed",
          color: "#87C2FF66",
        },
      },
      axisTick: {
        show: false,
      },
      axisLabel: {
        show: true,
        margin: 14,
        fontSize: 12,
        textStyle: {
          color: "#fff", //X轴文字颜色
        },
      },
      data: this.yearList.x,
    },
  ],
  yAxis: [
    {
      type: "value",
      // name: "金额(十亿)",
      min: 0,
      // max: 200,
      nameTextStyle: {
        color: "#FFFFFF99",
      },
      axisLine: {
        show: true,
        lineStyle: {
          color: "#355d8d",
        },
      },
      splitLine: {
        show: true,
        lineStyle: {
          type: "dashed",
          color: "#87C2FF66",
        },
      },
      axisLabel: {
        margin: 14,
        formatter: "{value}",
        textStyle: {
          color: "#FFFFFF99",
        },
      },
    },
    {
      type: "value",
      // name: "项(千)",
      min: 0,
      // max: 200,
      nameTextStyle: {
        color: "#FFFFFF99",
      },
      axisLine: {
        show: true,
        lineStyle: {
          color: "#355d8d",
        },
      },
      splitLine: {
        show: true,
        lineStyle: {
          type: "dashed",
          color: "#87C2FF66",
        },
      },
      axisLabel: {
        margin: 14,
        formatter: "{value}",
        textStyle: {
          color: "#FFFFFF99",
        },
      },
    }
  ],
  series: [
    {
      name: "金额(十亿)",
      type: "line",
      // stack: "总量",
      symbol: "circle",
      showSymbol: false,
      smooth: true,
      // symbolSize: 8,
      itemStyle: {
        normal: {
          color: "#FF7474",
          lineStyle: {
            color: "#FF7474",
            width: 2,
          },
        },
      },
      markPoint: {
        itemStyle: {
          normal: {
            color: "pink",
          },
        },
      },
      yAxisIndex: 0,
      data: this.yearList.money,
    },
    {
      name: "项(千)",
      type: "line",
      // stack: "总量",
      symbol: "circle",
      showSymbol: false,
      smooth: true,
      // symbolSize: 8,
      itemStyle: {
        normal: {
          color: "#FFD029",
          lineStyle: {
            color: "#FFD029",
            width: 2,
          },
        },
      },
      yAxisIndex: 1,
      data: this.yearList.item,
    },
    {
      name: "件(千)",
      type: "line",
      // stack: "总量",
      symbol: "circle",
      showSymbol: false,
      smooth: true,
      // symbolSize: 8,
      itemStyle: {
        normal: {
          color: "#00C2FF",
          lineStyle: {
            color: "#00C2FF",
            width: 2,
          },
        },
      },
      yAxisIndex: 1,
      data: this.yearList.num,
    },
  ],
}
效果图如下:
该示例中的属性可在官网中查阅,若有其他疑问可私信留言互相交流学习~


 882
882


 被折叠的 条评论
为什么被折叠?
被折叠的 条评论
为什么被折叠?
 到【灌水乐园】发言


