


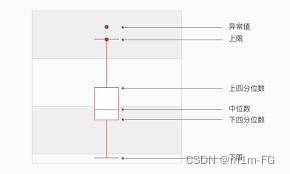
箱型图介绍:
首先,df长这样:

一、最简单的箱型图(boxplot)
import seaborn as sns
sns.boxplot(data = df, x = "age")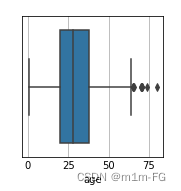
二、两个变量的箱型图
import seaborn as sns
sns.boxplot(data=df, x="age", y="class") 
三、hue
import seaborn as sns
sns.boxplot(data=df, x="age", y="class", hue="adult_male") 
hue:将每个箱型图按照hue再分类
四、dodge
import seaborn as sns
sns.boxplot(data=df, x="fare", y="deck", hue="deck", dodge=False)
dodge:为false的时候,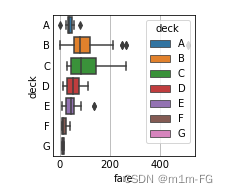
dodge:为true的时候,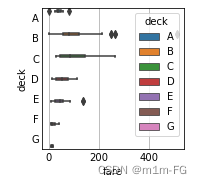
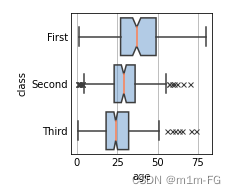
五、样式
import seaborn as sns
sns.boxplot(
    data=df, x="age", y="class",
    notch=True,   #notch 凹槽,即中位数处是否有凹槽
    medianprops={"color": "coral"},   #中位数线的颜色
    showcaps=True,     #设置上下限的那个杠
    flierprops={"marker": "x"},   #离群值的符号
    boxprops={"facecolor": (.4, .6, .8, .5)},  #箱子的颜色
)
六、样式
import seaborn as sns
import matplotlib.pyplot as plt

fig = plt.figure(1,(10,5),dpi = 250)
ax = plt.subplot(111)
plt.sca(ax)

sns.boxplot(data = taxi_data, x = "hour", y = "duration", ax = ax)
#ax是画纸,要指定把boxplot画在plt画的这张ax上(plt.sca(ax)),不然有可能出现plt画一张纸,boxplot画另一张纸

plt.ylim(0,3000)
plt.show() 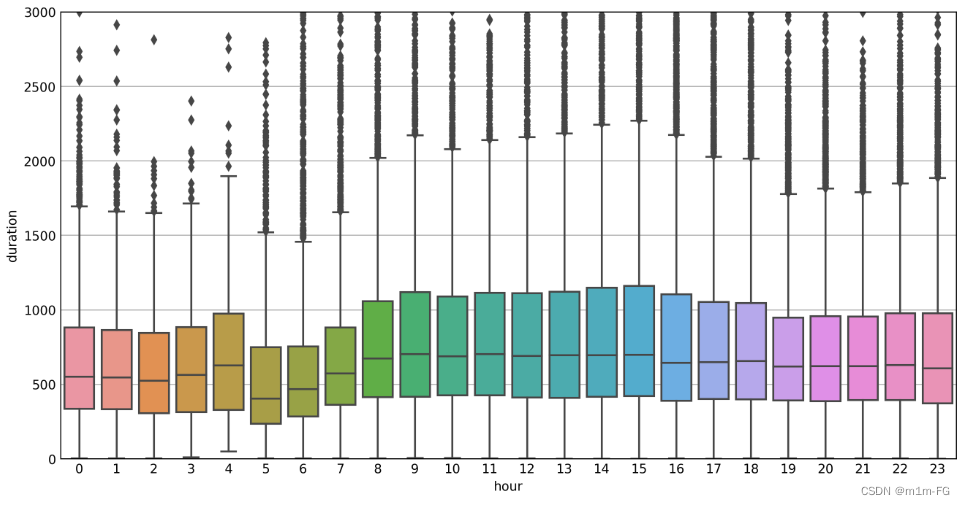


 1570
1570


 被折叠的 条评论
为什么被折叠?
被折叠的 条评论
为什么被折叠?
 到【灌水乐园】发言


