


一、箱线图定义
箱形图(Box plot),又称盒须图、盒式图、盒状图或箱线图,是一种用作显示一组数据分布情况的统计图。箱形图于1977年由美国著名统计学家约翰·图基(John Tukey)发明[1]。它能显示出一组数据的最大值、最小值、中位数、及上下四分位数,甚至还可以显示出数据的均值。箱线图结构如图1所示:
 图1 箱线图图解
二、Matplotlib与Seaborn简介
Matplotlib 是一个非常强大的 Python 画图工具,我们可以使用该工具将很多数据通过图表的形式更直观的呈现出来。Seaborn 是一个用 Python 制作统计图形的库。它建立在Matplotlib之上,并与pandas数据结构紧密集成 [2]。二者在Python中的安装方式如下:
pip install matplotlib
pip install seaborn
三、绘制箱线图的样例数据
在绘制箱线图时,我们需要准备好绘图数据。个人认为:“数据是核心,python只不过是工具”。在许多场景中,将原始数据处理为python绘图接口能够识别的数据才是难点,其过程如图2:

图2 绘图流程
本文着重于使用Python绘图工具绘制箱线图,不过多赘述数据处理。绘制箱线图的样例数据如表1所示:
表1 样例数据
| Method | AUROC | AUPRC |
|---|---|---|
| model1 | 0.959656 | 0.947956 |
| model1 | 0.973125 | 0.966463 |
| model1 | 0.973869 | 0.973025 |
| model1 | 0.960883 | 0.949658 |
| model1 | 0.970358 | 0.966043 |
| model2 | 0.959226 | 0.95617 |
| model2 | 0.97225 | 0.97231 |
| model2 | 0.970147 | 0.966797 |
| model2 | 0.96788 | 0.970985 |
| model2 | 0.974425 | 0.976376 |
四、Python绘制箱线图
4.1 Matplotlib绘制箱线图
(1)代码:
"""导入所需的python工具包"""
import matplotlib.pyplot as plt

if __name__ == "__main__":
    """数据准备"""
    model1_AUROC = [0.959656, 0.973125, 0.973869, 0.960883, 0.970358]
    model1_AUPRC = [0.947956, 0.966463, 0.973025, 0.949658, 0.966043]
    model2_AUROC = [0.959226, 0.97225, 0.970147, 0.96788, 0.974425]
    model2_AUPRC = [0.95617, 0.97231, 0.966797, 0.970985, 0.976376]

    AUROC_Data = [model1_AUROC, model2_AUROC]
    AUPRC_Data = [model1_AUPRC, model2_AUPRC]
    """创建包含两个子图的画布"""
    fig, axs = plt.subplots(nrows=1, ncols=2, figsize=(10, 4))
    # AUROC
    widths = 0.4
    axs[0].boxplot(x = AUROC_Data, whis=2, showmeans=True, widths=widths,
                   patch_artist=True,
                   boxprops = {'facecolor': 'cyan','linewidth': 2},
                   capprops={'linewidth': 2})

    axs[0].set_title('BoxPlot | AUROC')
    axs[0].set_xticks([i + 1 for i in range(2)],labels = ["model1", "model2"])
    axs[0].yaxis.grid(True)
    # AUPRC
    axs[1].boxplot(x=AUPRC_Data, whis=2, showmeans=True, widths=widths,
                      patch_artist = True,
                   boxprops={'facecolor': 'lightblue', 'linewidth': 2},
                   capprops={'linewidth': 2}
                          )
    axs[1].set_title('BoxPlot | AUPRC')
    axs[1].set_xticks([i + 1 for i in range(2)], labels=["model1", "model2"])
    axs[1].yaxis.grid(True)
    fig.show()
(2)代码输出:
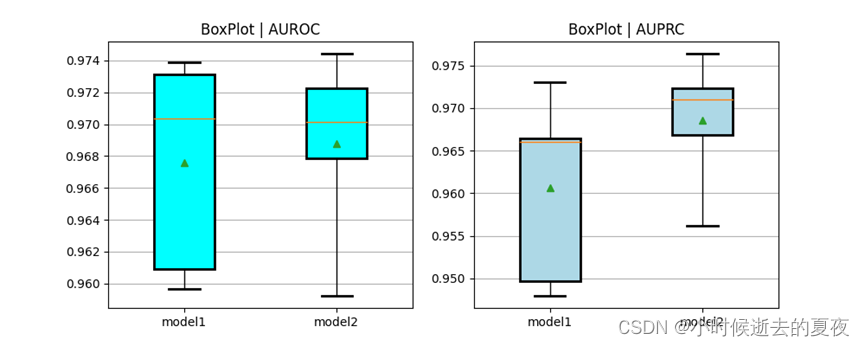
图3 Matplotlib绘制箱线图
(3)matplotlib.pyplot.boxplot具体参数解析:
可参考:matplotlib.pyplot.boxplot
4.2 Seaborn绘制箱线图
(1)代码:
"""导入所需的python工具包"""
import matplotlib.pyplot as plt
import seaborn as sns
import pandas as pd
"""绘图数据准备"""
sampleData = dict(
    Method = ["model1" for _ in range(5)] + ["model2" for _ in range(5)],
    AUROC = [0.959656,0.973125,0.973869,0.960883,0.970358,0.959226,0.97225,0.970147,0.96788,0.974425],
    AUPRC = [0.947956,0.966463,0.973025,0.949658,0.966043,0.95617,0.97231,0.966797,0.970985,0.976376]
)
if __name__ == "__main__":
    """数据格式转换为DataFrame格式"""
    sampleData = pd.DataFrame(sampleData)
    print(sampleData)
    """创建包含两个子图的画布"""
    sns.set_style("whitegrid")
    fig, axs = plt.subplots(nrows=1, ncols=2, figsize=(10, 4))
    #AUROC
    sns.boxplot(data=sampleData, x = "Method", y="AUROC",
                showmeans=True, width=0.4, ax=axs[0],
                whis=2, linewidth=2, palette=sns.set_palette("Set2"))
    axs[0].set_title('BoxPlot | AUROC')
    axs[0].set_ylabel("")
    axs[0].set_xlabel("")

    #AUPRC
    sns.boxplot(data=sampleData, x = "Method", y="AUPRC",
                showmeans=True, width=0.4, ax=axs[1],
                whis=2, linewidth=2, palette=sns.set_palette("Set2"))
    axs[1].set_title('BoxPlot | AUPRC')
    axs[1].set_ylabel("")
    axs[1].set_xlabel("")
    fig.show()
(2)代码输出:
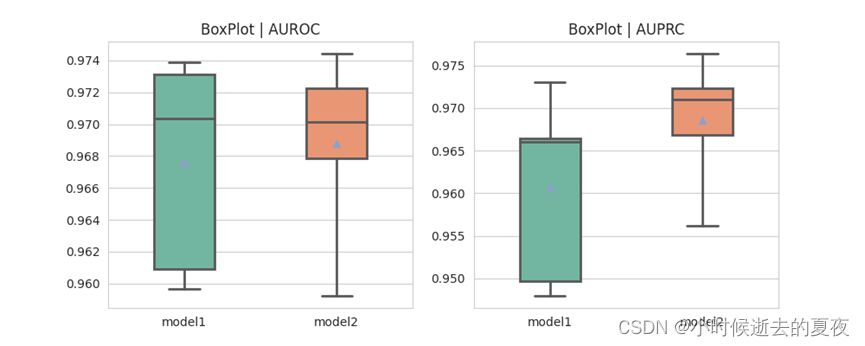
图4 Seaborn绘制箱线图
(3)seaborn.boxplot具体参数解析:
可参考:seaborn.boxplot
可以观察到,二者所绘制的箱线图是一致的。
五、参考文献
[1]https://baike.baidu.com/item/%E7%AE%B1%E5%BD%A2%E5%9B%BE/10671164?fr=ge_ala.
[2] https://www.runoob.com/matplotlib/matplotlib-tutorial.html.
[3] https://seaborn.pydata.org/tutorial.html.


 2996
2996

 被折叠的 条评论
为什么被折叠?
被折叠的 条评论
为什么被折叠?
 到【灌水乐园】发言


