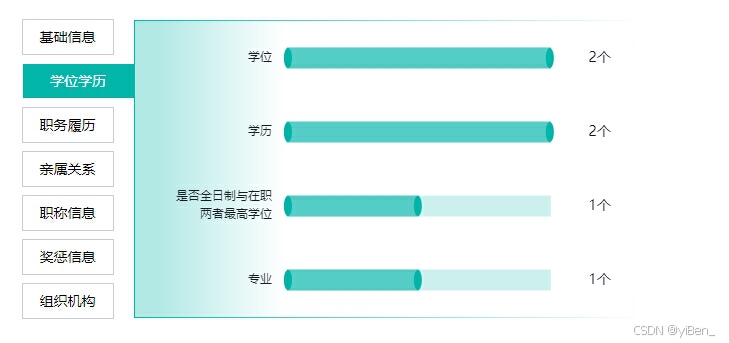
echarts 3d柱状图水平 ,利用象形图 左+主体+右 ,设置rgba颜色
象形图设置
{
type: "pictorialBar",
data: data,
barCategoryGap: "100%",
symbolOffset: [0, -10],
symbol: "path://M0 0 L32 0 L32 128 L0 128 Z",
z: 2,
itemStyle: {
color: "rgba(2, 182, 169, .6)",
},
barWidth: 21,
},
{
show: true,
type: "pictorialBar",
barCategoryGap: "100%",
symbolSize: [8, 20],
symbolOffset: [3, 0],
symbol: (value) => {
if (value) return "circle";
else return "none";
},
z: 1,
itemStyle: {
color: "rgba(2, 182, 169, 1)",
},
symbolPosition: "end",
data: data,
},
{
show: true,
type: "pictorialBar",
symbol: (value) => {
if (value) return "circle";
else return "none";
},
symbolSize: [8, 20],
symbolOffset: [-3, 0],
barCategoryGap: "100%",
z: 1,
itemStyle: {
color: "rgba(2, 182, 169, 1)",
},
data: data,
},
示例代码
const echartsOption = () => {
myChart.value.setOption({
title: {
text: "",
x: "center",
y: "center",
textStyle: {
fontSize: 14,
color: "#4E5969",
},
},
grid: {
left: "3%",
right: "0%",
top: "0%",
bottom: "0%",
containLabel: true,
},
tooltip: {
show: true,
trigger: "axis",
axisPointer: {
type: "none",
},
formatter: function (parms) {
if (parms[0].value == "0.01") {
return parms[0].name + ":" + "0" + "个";
} else {
return parms[0].name + ":" + parms[0].value + "个";
}
},
},
xAxis: {
type: "value",
axisLabel: {
show: false,
},
axisLine: {
show: false,
},
splitLine: {
show: false,
},
},
yAxis: [
{
type: "category",
inverse: true,
axisTick: {
show: false,
},
axisLine: {
show: false,
lineStyle: {
fontSize: 14,
color: "#1D2129",
},
},
splitLine: {
show: false,
},
data: rightdata.value,
axisLabel: {
color: "#1D2129",
fontSize: 14,
margin: 15,
formatter: function (params) {
var str = "";
var paramsLen = params.length;
var len = 8;
var rowNumber = Math.ceil(paramsLen / len);
if (paramsLen > len) {
for (var i = 0; i < rowNumber; i++) {
var temp = "";
var start = i * len;
var end = start + len;
if (i == rowNumber - 1) {
temp = params.substring(start, paramsLen);
} else {
temp = params.substring(start, end) + "\n";
}
str += temp;
}
} else {
str = params;
}
return "{a|" + `${str}` + "}";
},
rich: {
a: {
height: 18,
},
},
},
},
{
inverse: true,
data: echartsData,
axisLabel: {
margin: 60,
color: "#1D2129",
fontSize: "14",
align: "right",
formatter: (value) => {
return value == "0.01" ? "0" + "个" : value + "个";
},
rich: {
name: {
backgroundColor: "none",
fontSize: 14,
},
},
},
axisLine: {
show: false,
},
axisTick: {
show: false,
},
splitLine: {
show: false,
},
},
],
series: [
{
type: "bar",
barWidth: 21,
showBackground: true,
data: data,
backgroundStyle: {
color: "rgba(2, 182, 169, .2)",
},
itemStyle: {
color: "rgba(255, 255, 255, 0)",
},
},
{
type: "pictorialBar",
data: data,
barCategoryGap: "100%",
symbolOffset: [0, -10],
symbol: "path://M0 0 L32 0 L32 128 L0 128 Z",
z: 2,
itemStyle: {
color: "rgba(2, 182, 169, .6)",
},
barWidth: 21,
},
{
show: true,
type: "pictorialBar",
barCategoryGap: "100%",
symbolSize: [8, 20],
symbolOffset: [3, 0],
symbol: (value) => {
if (value) return "circle";
else return "none";
},
z: 1,
itemStyle: {
color: "rgba(2, 182, 169, 1)",
},
symbolPosition: "end",
data: data,
},
{
show: true,
type: "pictorialBar",
symbol: (value) => {
if (value) return "circle";
else return "none";
},
symbolSize: [8, 20],
symbolOffset: [-3, 0],
barCategoryGap: "100%",
z: 1,
itemStyle: {
color: "rgba(2, 182, 169, 1)",
},
data: data,
},
],
});
};


 1183
1183

 被折叠的 条评论
为什么被折叠?
被折叠的 条评论
为什么被折叠?
 到【灌水乐园】发言


