


一、首先去官网找到适合自己的图例,地址如下:
Echarts官网直达
二、本次使用的图例是:
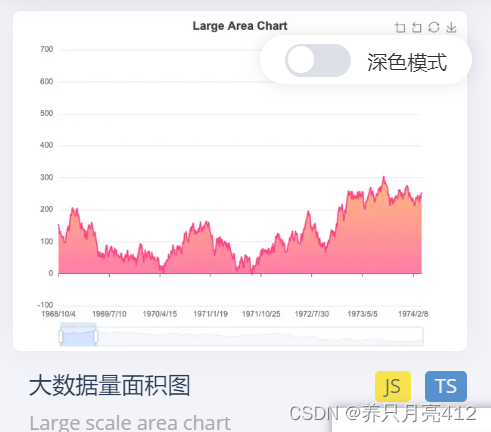
三、vue文件
<template>
  <div>
    <div class="title">
   <h1>此处是我的Title标题</h1>
    </div>
    //宽高自定义图表的大小
    <div
      id="myChart1"
      :style="{width: '1200px', height: '500px'}">
    </div>
  </div>
</template>
<script>
import {getKpiValueTrend} from "../../api/user";   //此处是我调用api接口的导入文件
import * as echarts from 'echarts';  //引入文件

var myChart;

export default {
  name: "", //此处为Vue文件名,也可直接注释掉
  data() {
    return {
      // 向后台查询数据list的字段,即为后台所要接收到的数据
      time: {
        bgaName:"PSA001"
        kpiName:"Output",
      },
      // 定义图表,各种参数
      msg: "柱状图",
      kpiValue:[],//接收y轴数据的数组
      inputDate:[],//接收x轴日期数据的数组
      //图标名称
      // title:"XXXXXXXX",
    };
  },
  mounted: function () {
  //调用api接口获取后台数据
    getKpiValueTrend(this.time)
      .then((res) => {
        for(var i = 0 ; i < res.data.length;i++){
            this.inputDate.push(res.data[i].inputDate);
            // console.log("类型类型"+ typeof inputDate)
            this.kpiValue.push(res.data[i].kpiValue)
            // console.log("我成功了"+ this.kpiValue)
        }
      }),
    this.drawLine(); //按照默认值绘制图表
  },
  watch:{
    kpiValue:{
      //对于深层对象的属性,watch不可达,因此对数组监控需要将数组先清空,再添加数据
      handler: function () {
        this.drawLine();
      },
      deep: true,
    }
  },
  methods: {
    drawLine() {
    //此方法解决日期自动补零的问题,即:2023-01-02这种形式
    //但因为是直接从后台数据库查询的日期形式就是自动补零的,所以此方法没有用到
      function add0(m){
        return m<10?'0'+m:m
      }
	//此方法应该为解决数据不渲染的问题(太久远了 忘记了)
      if (myChart != null && myChart != "" && myChart != undefined) {
        myChart.dispose();//销毁
      }
      // 此处数据为一整年数据 也是没用到 因为后台查询到的y轴数据无法和x轴日期一一对应
      let base = +new Date(2023, 0, 0);
      let oneDay = 24 * 3600 * 1000;
      let date = [];
      let data = [Math.random() * 300];
      for (let i = 1; i < 367; i++) {
        var now = new Date((base += oneDay));
        date.push([now.getFullYear(),add0( now.getMonth() + 1),add0( now.getDate())].join('-'));
        data.push(Math.round((Math.random() - 0.5) * 20 + data[i - 1]));
      }

      // 1、基于准备好的dom,初始化echarts实例
      myChart = this.$echarts.init(document.getElementById("myChart1"));
      //2、构造图表数据
      let options = {
        // title: {
        //   text: this.title,
        //   left: "center",
        // },
        //图标示例标签
        legend: {
          left: "right",
        },
        tooltip: {
          trigger:'axis',//坐标轴触发,主要在柱状图、折线图会使用类目轴的图表
          // axisPointer:{
          //   //坐标指示器,坐标轴触发有效
          //   type:'shadow'//默认为直线,可选line/shadow
          // }
          position: function (pt) {
            return [pt[0], '10%'];
          }
        },
        toolbox: {
          feature: {
            saveAsImage: {}  //是否可保存为图片 那个右上角小图标
          }
        },
        xAxis: {
          type: 'category',
          boundaryGap: false,
          data: this.inputDate, //x轴数据
        },
        yAxis:{
          type: 'value',
          boundaryGap: false,
          // max: 2550,
          // min: 0, //设置y轴最大值最小值
        },
        dataZoom: [
          {
            type: 'inside',
            start: 0,
            end: 10
          },
          {
            start: 0,
            end: 10
          }
        ],
        series: [
          {
            data: this.kpiValue,//y轴数据
            type: 'line',
            symbol: 'none',
            sampling: 'lttb',
            itemStyle: {
              color: 'rgb(255, 70, 131)'
            },
            areaStyle: {
              color: new echarts.graphic.LinearGradient(0, 0, 0, 1, [
                {
                  offset: 0,
                  color: 'rgb(255, 158, 68)'
                },
                {
                  offset: 1,
                  color: 'rgb(255, 70, 131)'
                }
              ])
            },
          }
        ]
      };
      // 3、绘制图表
      myChart.setOption(options);
    },
  },
};
</script>
<style scoped>
#myChart1{
  /*margin-top:;*/
  border: 2px solid #E1000F;
  margin-top: 20px;
  margin-left: 80px;
}
</style>
四、user文件(api文件)
// 测试数据
export function getKpiValueTrend(data) {
  return request({
    url:'/TESTlist',
    method:'post',
    data
  })
}
五、后台
1)实体类
@Data
@TableName("moskpi")
public class MosKpi {
    @TableId(type = IdType.AUTO)
    private Integer id;
    //kpiName
    private String kpiName;
    //录入日期
    @JsonFormat(pattern = "yyyy-MM-dd",timezone = "GMT+8")
    private Date inputDate;
    //bga  Name
    private String bgaName;
    //kpi 的值
    private String kpiValue;
    public MosKpi(Integer id, String kpiName, Date inputDate, String bgaName, String kpiValue) {
        this.id = id;
        this.kpiName = kpiName;
        this.inputDate = inputDate;
        this.bgaName = bgaName;
        this.kpiValue = kpiValue;
    }

    public MosKpi() {
    }
}
2)Mapper文件
    <!-- 测试版趋势图数据-->
    <select id="selectMosKpiList" resultType="com.dragon.mos.pojo.MosKpi">
        select
        *
        from
        moskpi
        <where>
            bga_name = #{bgaName} and kpi_name = #{kpiName} and YEAR(input_date) = YEAR(NOW())
        </where>
        ORDER BY input_date ASC;
    </select>
mapper文件
@Mapper
public interface MosKpiMapper extends BaseMapper<MosKpi> {
 //测试版趋势图查询当年数据
    List<MosKpi> selectMosKpiList(String bgaName,String kpiName);
}
3)service文件
public interface MosKpiService {
   //测试版当年数据
    List<MosKpi> selectMosKpiList(MosKpi mosKpi);
}
实现类
@Service
public class MosKpiServiceImpl implements MosKpiService {
    @Autowired
    MosKpiMapper mosKpiMapper;
//    测试版查询当年数据
    @Override
    public List<MosKpi> selectMosKpiList(MosKpi mosKpi) {
        return mosKpiMapper.selectMosKpiList(mosKpi.getBgaName(),mosKpi.getKpiName());
    }
    }
4)Controller文件
//    此方法是解决传到前台的数据和echarts图表中的x轴不能一一对应  查询日期和value值
    @RequestMapping("/api/TESTlist")
    public List<MosKpi> selectMosKpiList(@RequestBody MosKpi mosKpi){
        return mosKpiService.selectMosKpiList(mosKpi);
    }
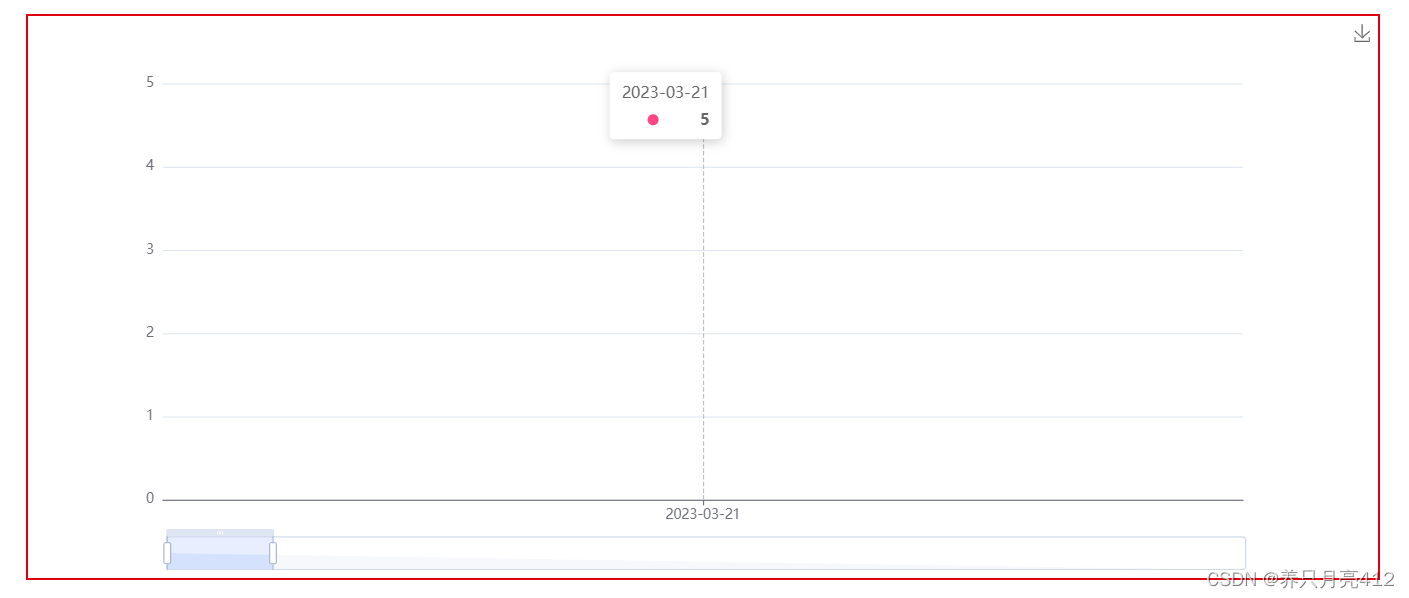
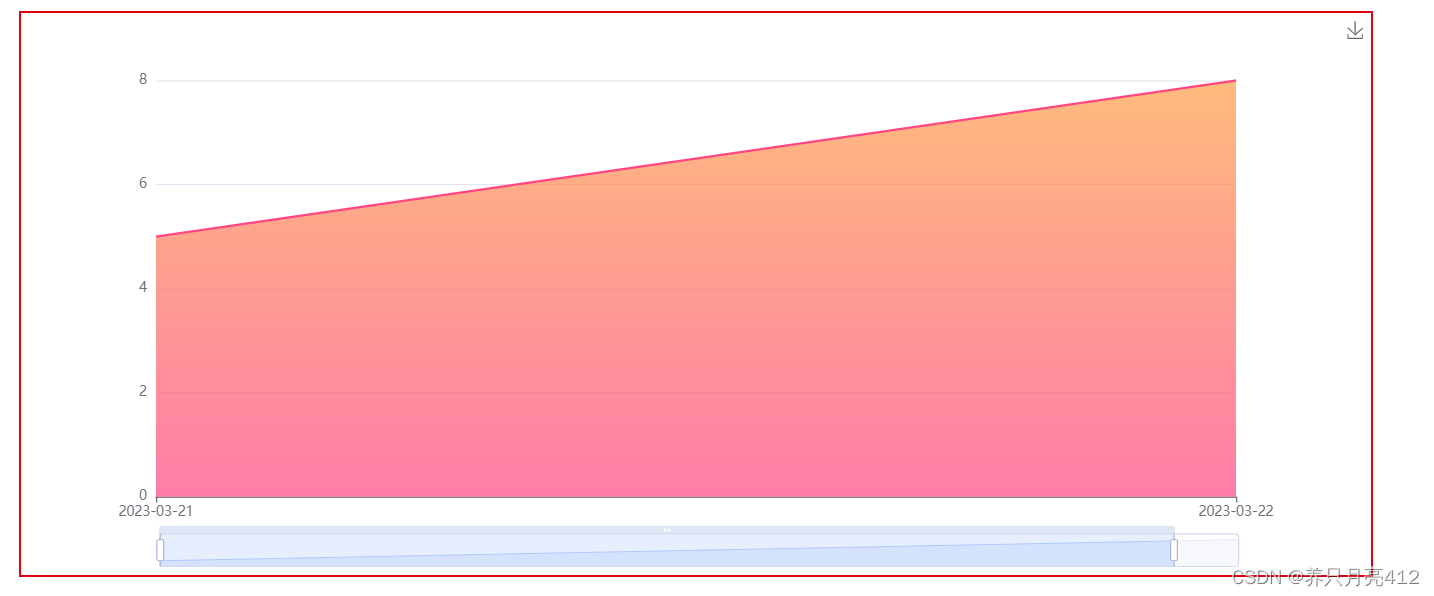
结果图:


 292
292


 被折叠的 条评论
为什么被折叠?
被折叠的 条评论
为什么被折叠?
 到【灌水乐园】发言


