算法执行简介
在 Iterated Tverberg Point-Theory 里面, 已经介绍过理论的部分,这里就主要讲算法的执行了。整个算法的执行用的是Python语言。因为执行算法只是实验的一部分,还有很重要的一部分是应该理解清楚什么情况下这种算法有应用的价值,所以代码里面算法的执行算其中的一部分,还会有一个完整的实例。
下面代码是算法的执行部分,里面还包含有一个测试的比对。比对的对象分别是: Averaged point, Tverberg point, All point。在这个实验里,用的是Stochastic Gradient Descent来得到线性模型,上面说的point其实就是一个个的线性模型。因为在很多机器学习的应用中,比如大数据,分布式计算,移动计算,我们只能够接触到一部分的数据,从而得到一个相对来说的比较弱的model。这里,我们用SGD算法来获得很多的单个弱线性模型,然后用算法逼近这些线性模型的中值, 也就是算Center Point。
在一般的机器学习中,我们也会使用求平均的方式从一些模型中得到一个更好的模型。这里我们对这两个模型进行了对比。加入对比的还有在整个数据集上学到的模型。在代码中别是averaged point, tverberg point, 和all point。其中的测试部分用的是sklearn库中的分类函数生成的人工数据。
算法执行与测试代码
#  -*- coding: utf-8 -*-
"""
  Author: Yakun Li
  Date:   2015-Sep-17
  Email:  liyakun127@gmail.com
  Python: 2.7.9
"""
import numpy as np
from copy import deepcopy
from random import shuffle
from itertools import compress
from sklearn import linear_model, cross_validation, datasets

class IteratedTverbergPoint:

    def __init__(self):
        pass

    def __find_l_minus_one(self, buckets, d):
        """
          Find bucket_{l-1} with at least (d+2) points, and return index l
        """
        l_minus_one = None
        for i, b in enumerate(buckets):
            if len(b) >= d + 2:
                l_minus_one = i

        assert (l_minus_one is not None), "No bucket with d+2 points found"
        return l_minus_one + 1

    def __find_l(self, buckets, d):
        """
          get the index l of bucket, with at least d+2 points in bucket_{l-1}
        """
        return self.__find_l_minus_one(buckets, d)

    def __pop_d_plus_two_points_with_proof(self, buckets_l_minus_one, d):
        """
          Pop d+2 points from bucket_{l-1}
        """
        for _ in range(d+2):
            yield buckets_l_minus_one.pop()

    def __solve_homogeneous(self, equation):
        """
        Solve homogeneous linear equation
        """
        _, _, vh = np.linalg.svd(equation)
        return vh.T[:, -1]

    def __get_radon_point_partition(self, points_list):
        """
          Get randon partition and randon point, Proof of Theorem 1 in theory part.
        """
        points_array = np.asarray(points_list)
        n, d = np.shape(points_array)
        assert (n >= d + 2), "Not enough points"
        # in case that we get all alpha with value 0, by add one dimension, with all 1
        equation = np.vstack((np.ones(n), points_array.T))
        # get alphas and alphas index
        alphas = self.__solve_homogeneous(equation)
        positive_alphas_idx = alphas > 0
        positive_alphas = alphas[positive_alphas_idx]
        positive_points = points_array[positive_alphas_idx]
        non_positive_alphas_idx = ~ positive_alphas_idx
        non_positive_alphas = alphas[non_positive_alphas_idx]
        # get radon point and radon partition
        sum_alphas = np.sum(positive_alphas)
        radon_pt_positive_alphas = positive_alphas / sum_alphas
        radon_pt_non_positive_alphas = non_positive_alphas / (-sum_alphas)
        radon_pt = np.dot(radon_pt_positive_alphas, positive_points)
        return (radon_pt,
                (radon_pt_positive_alphas, radon_pt_non_positive_alphas),
                (positive_alphas_idx, non_positive_alphas_idx))

    def __prune_recursive(self, alphas, hull, non_hull):
        # remove all coefficients that are already (close to) zero
        idx_nonzero = ~ np.isclose(alphas, np.zeros_like(alphas))
        alphas = alphas[idx_nonzero]
        # Add pruned points to the non hull (and thus back to bucket B_0)
        non_hull = non_hull + hull[~idx_nonzero].tolist()
        hull = hull[idx_nonzero]
        n, d = hull.shape
        # continue prune until d+1 hull points, then can't be reduced any further
        if n <= d + 1:
            return alphas, hull, non_hull
        # Choose d + 2 hull points
        _hull = hull[:d + 2]
        _alphas = alphas[:d + 2]
        # Proof of Theorem 2 in theory part
        linear_dependent = _hull[1:] - _hull[1]
        _betas = self.__solve_homogeneous(linear_dependent.T)
        beta1 = np.negative(np.sum(_betas))
        betas = np.hstack((beta1, _betas))

        idx_positive = betas > 0
        idx_nonzero = ~ np.isclose(betas, np.zeros_like(betas))
         # make sure betas are positive and nonzero, so  α'_i = α_i - λ*β_i >= 0
        idx = idx_positive & idx_nonzero
        lambdas = _alphas[idx] / betas[idx]
        lambda_min_idx = np.argmin(lambdas)

        _alphas[:] = _alphas - (lambdas[lambda_min_idx] * betas)

        # remove (filter) the pruned hull vector
        idx = np.arange(n) != lambda_min_idx   # get the index of points which are Not corresponding to the minimum λ
        hull = hull[idx]                       # get the representation of the pruned convex hull
        non_hull.append(hull[lambda_min_idx])  # add pruned points to the non hull (and thus back to bucket B_0)
        alphas = alphas[idx]                   # get the corresponding alphas with the convex hull points

        return self.__prune_recursive(alphas, hull, non_hull)

    def __prune(self, alphas, hull):
        _alphas = np.asarray(alphas)
        _hull = np.asarray(hull)
        alphas, hull, non_hull = self.__prune_recursive(_alphas, _hull, [])
        assert (alphas.shape[0] == hull.shape[0]), "Broken hull"
        non_hull = [(p, [[(1,p)]]) for p in non_hull]
        return zip(alphas, hull), non_hull

    def __get_center_point_with_proof(self, points):
        """
          Return the calculated Iterated Tverberg point
        """
        points = np.asarray(points)
        n, d = points.shape
        print n, d
        z = int(np.log2(np.ceil(n/(2*((d+1)**2)))))
        buckets = [[] for l in range(z+1)] # bucket_0 contains single point with proof

        for s in points:
            buckets[0].append((s, [[(1, s)]]))

        while not buckets[z]:
            proof = []
            l = self.__find_l(buckets, d)
            d_plus_two_points_with_proof = self.__pop_d_plus_two_points_with_proof(buckets[l-1], d)
            points_list, proofs_list = zip(*d_plus_two_points_with_proof) # proof list consists of all the partitions of proof of depth 2^{l-1}
            radon_pt, alphas_tuple, partition_idx_tuple = self.__get_radon_point_partition(points_list)

            for k in range(2):
                """
                Iterate two radon partitions to form a proof of depth 2^l, with 2 * 2^{l-1} new partitions
                """
                radon_pt_proof_list = list(compress(proofs_list, partition_idx_tuple[k]))
                radon_pt_factor_tuple = alphas_tuple[k]
                for i in range(2 ** (l-1)):
                    """
                    Go through one partition within 2^{l-1} partitions, to form a new partition with size d+1
                    Totally need to go 2^{l-1} times, to get 2^{l-1} new partitions
                    Each time, prune the size once
                    """
                    pt_alphas, pt_hulls = [], []
                    for j, ps in enumerate(radon_pt_proof_list):
                        """
                        radon_pt_proof_list consists of 2 * 2^{l-1} partitions
                        """
                        parts_i_of_proof_of_j = ps[i] # get partition i within partitions j
                        for ppt in parts_i_of_proof_of_j:
                            """
                            Get all the points and alpha within each partition
                            """
                            alpha = radon_pt_factor_tuple[j] * ppt[0] # get alpha
                            hull = ppt[1] # get point
                            pt_alphas.append(alpha)
                            pt_hulls.append(hull)
                    proof_after_pruning, non_hull = self.__prune(pt_alphas, pt_hulls)
                    proof.append(proof_after_pruning)
                    buckets[0].extend(non_hull)
            buckets[l].append((radon_pt, proof))
        return buckets[z]

    def __get_averaged_point(self, points):
        """
        calculate the average point
        """
        average_point = [0 for x in range(len(points[0]))]
        for i in range(len(points)):
            for j in range(len(points[i])):
                average_point[j] += (points[i][j])
        return [x / len(points) for x in average_point]

    def get_center_and_average_point(self, points):
        """
        return the tverberg point and average point
        """
        center_point_with_proof = self.__get_center_point_with_proof(points)
        print "Center Point with proof: ", center_point_with_proof[0]
        print "Center point: ", center_point_with_proof[0][0]
        print "Proof of center point: ", center_point_with_proof[0][1]
        print "Depth of center point: ", len(center_point_with_proof[0][1])
        return center_point_with_proof[0][0], self.__get_averaged_point(points)

class Test:

    def __init__(self):
        pass

    def __sigmoid(self, inX):
        return 1.0/(1+np.exp(-inX))

    def __sig_test(self, instance, weights):
        value = np.dot(instance, weights)
        sig_value = self.__sigmoid(value)
        if sig_value > 0.5:
            return 1.0
        else:
            return 0.0

    def __perform_test(self, instance_matrix, labels_list, weights_list, coefficients, mean_point, weights_all, path):
        errors_list = []
        print "Test Starts...\n"
        for j in range(len(weights_list)):
            print "%d th test..." % j
            error_count = 0
            for i in range(len(instance_matrix)):
                if int((self.__sig_test(np.transpose(np.asarray(instance_matrix[i])), np.asarray(weights_list[j])
                                                 ))) != int(labels_list[i]):
                    error_count += 1
            errors_list.append(float(error_count)/float(len(instance_matrix)))
            print "%d th test finished." % j

        if coefficients is not None:
            error_center_counter, error_mean_counter, error_all_counter = 0, 0, 0
            print "test for middle and center point..."
            for i in range(len(instance_matrix)):
                if int((self.__sig_test(instance_matrix[i], np.asarray(mean_point).transpose()))) != \
                        int(labels_list[i]):
                    error_mean_counter += 1
                if int((self.__sig_test(instance_matrix[i], np.asarray(coefficients).transpose()))) != \
                        int(labels_list[i]):
                    error_center_counter += 1
                if int((self.__sig_test(instance_matrix[i], np.asarray(weights_all).transpose()))) != \
                        int(labels_list[i]):
                    error_all_counter += 1
            print "test for averaged, tverberg and all point finished."
            errors_list.append(float(error_mean_counter)/float(len(instance_matrix)))
            errors_list.append(float(error_center_counter)/float(len(instance_matrix)))
            errors_list.append(float(error_all_counter)/float(len(instance_matrix)))
        self.__write_error_to_file(errors_list, path)

    def __write_error_to_file(self, errors_list, path):
        """
        Write testing error rate to file
        """
        with open(path, "w") as f:
            for i in range(0, len(errors_list)):
                f.writelines("Testing Error of %dth weights vector: %f\n" % (i, errors_list[i]))
        print "Done!"

    def run_synthetic_data_one_fold(self, number_of_training, number_of_training_instances, percent_of_train, n_samples, n_features, n_informative, n_classes):
        x_, y_ =  datasets.make_classification(n_samples=n_samples, n_features=n_features, n_informative=n_informative,
                                            n_redundant=0, n_classes=n_classes, random_state=42)
        x_train, x_test, y_train, y_test = cross_validation.train_test_split(x_, y_, train_size=percent_of_train, random_state=42)
        sgd = linear_model.SGDClassifier(loss='log')
        sgd.fit(x_train, y_train)
        weights_all = deepcopy(sgd.coef_)
        weights_equal = []
        weights_random = []
        for i in xrange(number_of_training):
            Xs = x_train[i*number_of_training:(i+1)*number_of_training]
            ys = y_train[i*number_of_training:(i+1)*number_of_training]
            if len(ys) > 0:
                sgd = linear_model.SGDClassifier(loss='log')
                sgd.fit(Xs,ys)
                w = deepcopy(sgd.coef_[0])
                weights_equal.append(w)
            Xidx = range(len(x_train))
            yidx = range(len(y_train))
            shuffle(Xidx)
            shuffle(yidx)
            Xs = x_train[Xidx[:number_of_training_instances]]
            ys = y_train[yidx[:number_of_training_instances]]
            sgd = linear_model.SGDClassifier(loss='log')
            sgd.fit(Xs,ys)
            w = deepcopy(sgd.coef_[0])
            weights_random.append(w)
        weights_random = weights_random
        weights_equal = weights_equal

        tverberg_point = IteratedTverbergPoint()
        center_point_random, average_point_random = tverberg_point.get_center_and_average_point((weights_random))
        self.__perform_test(x_test, y_test, weights_random, center_point_random, average_point_random, weights_all,
                                 "./error_random.txt")

Test().run_synthetic_data_one_fold(2000, 1000, 0.9, 5000, 5, 5, 2)
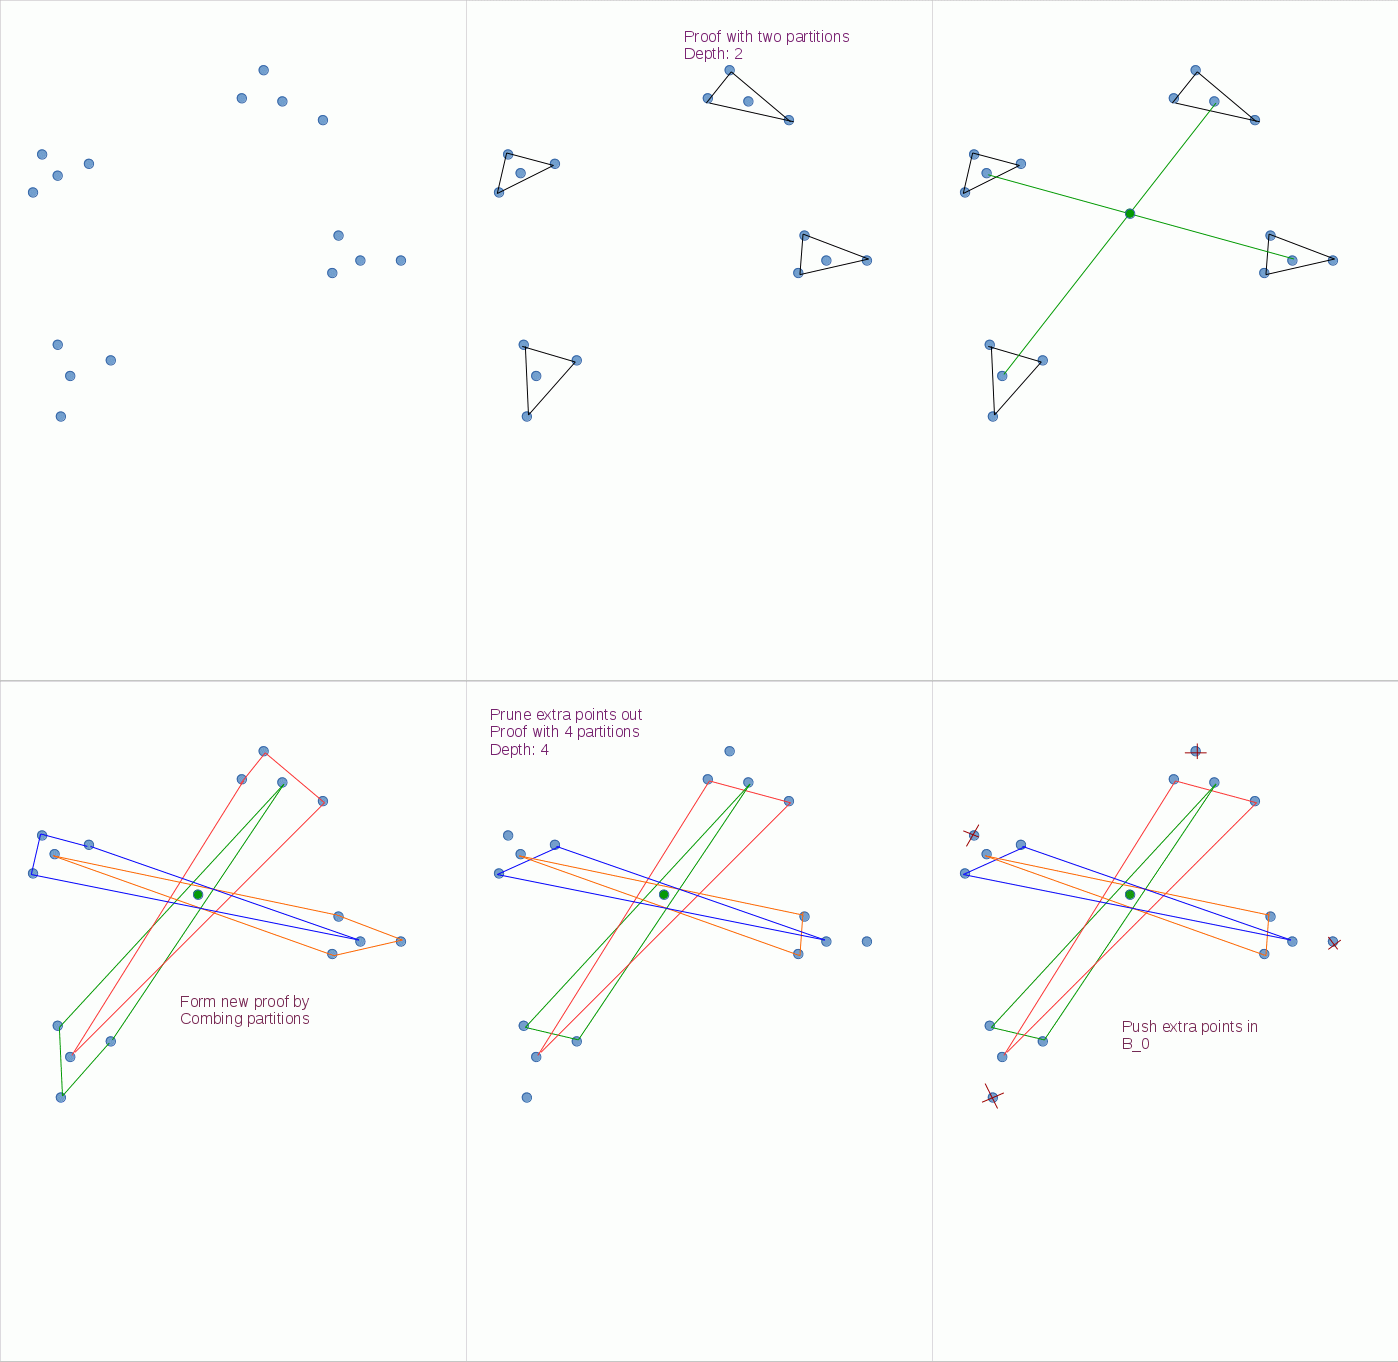
上面算法prune部分对我来说刚开始理解起来不容易,所以做了一个实例用gif展示。
算法测试结果与分析
这里我们用box plot来把跑出的结果展示出来,因为在这个测试中数据量和结果比较多,用box plot来展示的话很容易从中直观的看出。
import matplotlib.pyplot as plt
import matplotlib.lines as mlines

class Plot:

    def file_to_list(self, file_open):
        """
        Convert the readed file to list
        """
        line_list = [line for line in file_open.readlines()]
        temp_list, center_list, average_list, all_list = [], [], [], []
        length = len(line_list)
        for i,  line in enumerate(line_list):
            if i <= (length-4):
                temp_list.append(float(line.split(":")[1].rstrip()))
            elif i == length-3:
                average_list.append(float(line.split(":")[1].rstrip()))
            elif i == length-2:
                center_list.append(float(line.split(":")[1].rstrip()))
            else:
                all_list.append(float(line.split(":")[1].rstrip()))
        return temp_list, average_list, center_list, all_list

    def box_plot_with_special_point(self, equal_list, equal_special_list, path, str_):
        """
        box plot with single models, as well as Tverberg point, Average point, All point
        """
        fig1 = plt.figure(1, figsize=(14, 14))
        ax = fig1.add_subplot(111)
        plt.subplots_adjust(left=0.075, right=0.95, top=0.9, bottom=0.25)
        meanlineprops = dict(linestyle='--', linewidth=2.5, color='purple')

        bp_0 = ax.boxplot(equal_list, 1, meanprops=meanlineprops, meanline=True, showmeans=True)

        bp_1 = ax.boxplot(equal_special_list[0])
        for i, median in enumerate(bp_1['medians']):
            if i == 0:
                median.set(color='red', linewidth=1, label="mean_point")
            else:
                median.set(color='red', linewidth=1)

        bp_2 = ax.boxplot(equal_special_list[1])
        for i, median in enumerate(bp_2['medians']):
            if i == 0:
                median.set(color='magenta', linewidth=1, label="tverberg_point")
            else:
                median.set(color='magenta', linewidth=1)

        bp_3 = ax.boxplot(equal_special_list[2])
        for i, median in enumerate(bp_3['medians']):
            if i == 0:
                median.set(color='yellow', linewidth=1, label="all_point")
            else:
                median.set(color='yellow', linewidth=1)

        # Remove top axes and right axes ticks
        ax.get_xaxis().tick_bottom()
        ax.get_yaxis().tick_left()

        # Add a horizontal grid to the plot, but make it very light in color
        # so we can use it for reading data values but not be distracting
        ax.yaxis.grid(True, linestyle='-', which='major', color='lightgrey', alpha=0.5)

        # Hide these grid behind plot objects
        ax.set_axisbelow(True)

        # change outline color, fill color and linewidth of the boxes
        for box in bp_0['boxes']:
            # change outline color
            box.set(color='#7570b3', linewidth=1)

        # change color and linewidth of the whiskers
        for whisker in bp_0['whiskers']:
            whisker.set(color='#7570b3', linewidth=2)

        # change color and linewidth of the caps
        for cap in bp_0['caps']:
            cap.set(color='#7570b3', linewidth=2)

        # change color and linewidth of the medians
        for i, median in enumerate(bp_0['medians']):
            if i == 0:
                median.set(color='#b2df8a', linewidth=2, label="error_median")
            else:
                median.set(color='#b2df8a', linewidth=2)

        dash_line = mlines.Line2D([], [], color='purple', label='error_mean', linestyle='--')

        ax.set_xlabel('Random Sample-Lists of Weight Vectors')
        ax.set_ylabel('Errors of Each Weight Vector')
        # Put a legend below current axis
        f1 = plt.legend(handles=[dash_line], loc=1)

        box = ax.get_position()
        ax.set_position([box.x0, box.y0, box.width * 0.8, box.height])

        # Put a legend to the right of the current axis
        ax.legend(loc='center left', bbox_to_anchor=(1, 0.5))

        ax = plt.gca().add_artist(f1)

        fig1.savefig(path+'fig_random.png', bbox_inches='tight')

        plt.close()

    def box_plot(self, path):
        """
        A general box plot
        """
        random_list = []
        random_special_list = [[], [], []]
        fr_random = (open(path+"error_random.txt"))
        random_, ra_average_list, ra_center_list, ra_all_list = self.file_to_list(fr_random)
        random_list.append(random_)
        random_special_list[0].append(ra_average_list)
        random_special_list[1].append(ra_center_list)
        random_special_list[2].append(ra_all_list)
        self.box_plot_with_special_point(random_list, random_special_list, path, "random")

Plot().box_plot('')
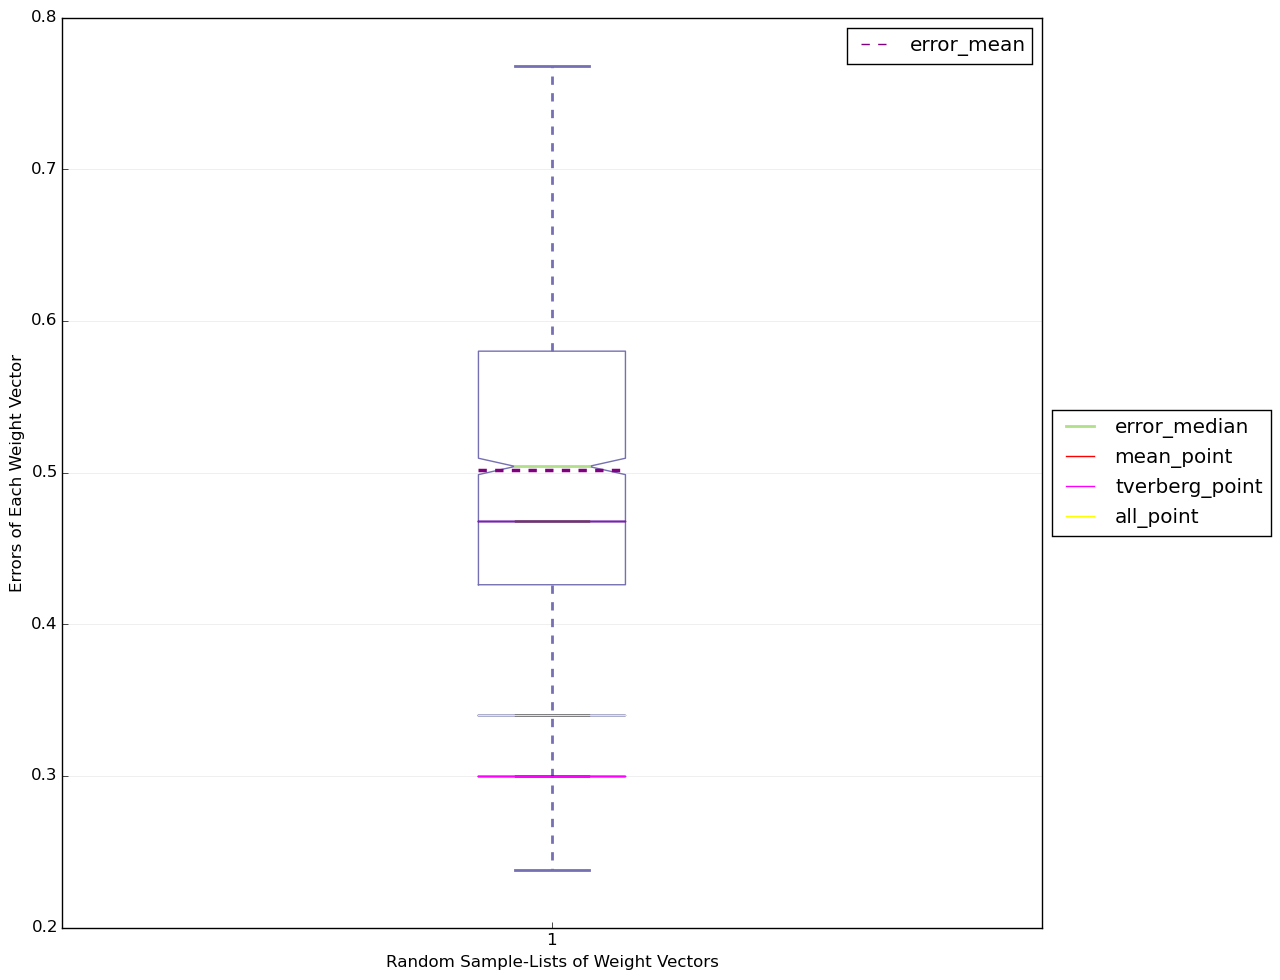
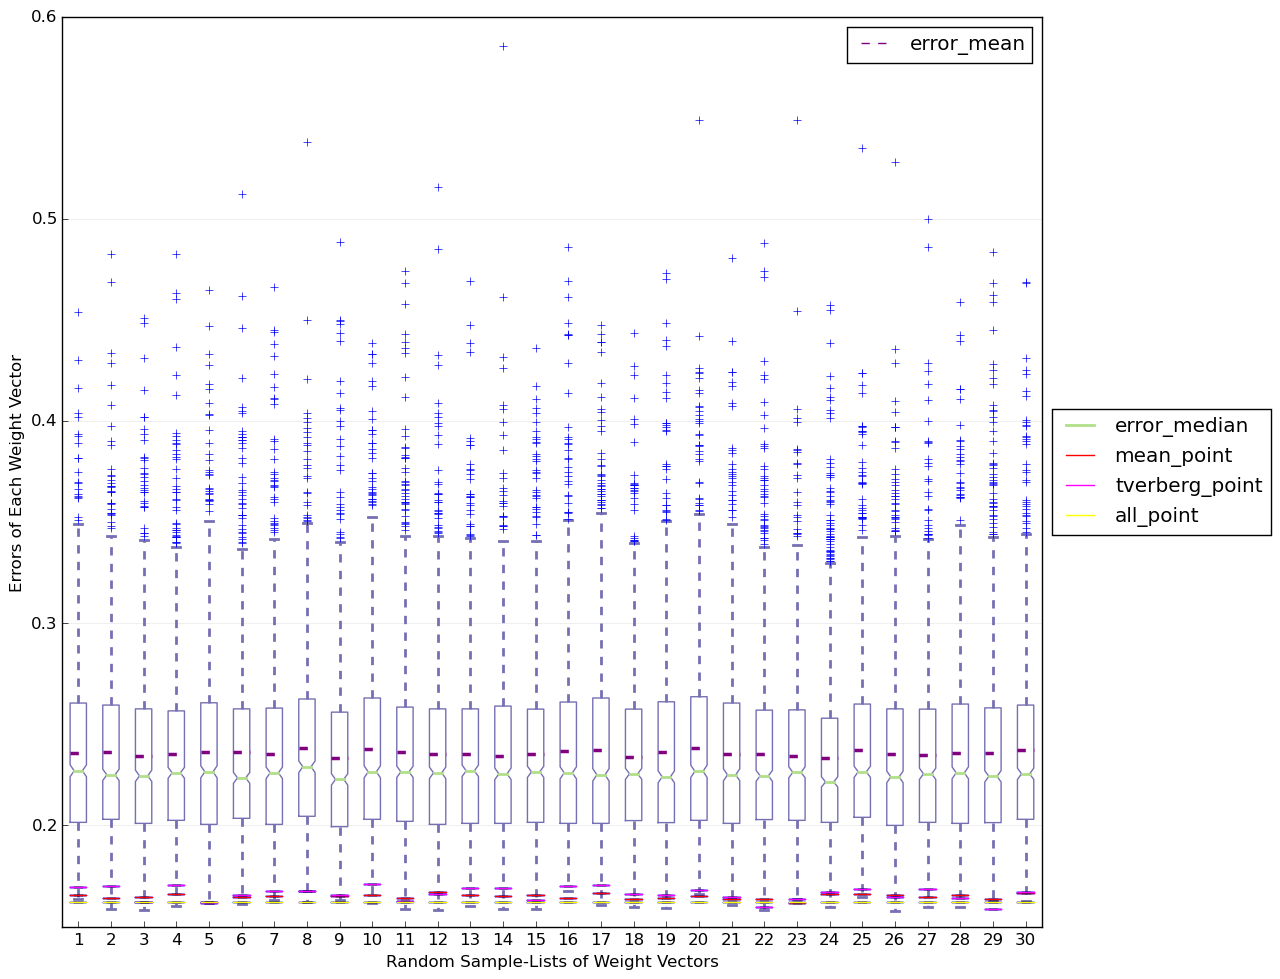
这个是上面的代码跑出来的结果,大家通过结果可以看出tverberg point相对与all point, averaged point确实更好。上面的实验因为数据生成,测试训练分割都是随机的,所以需要多跑一些循环才能够得到更可靠的结果。在实验里面我跑了数据的维度从2维到20维,然后每个维度跑了30次从而得到了如下的数据, 这个是在数据10个维度的时候得到的结果。
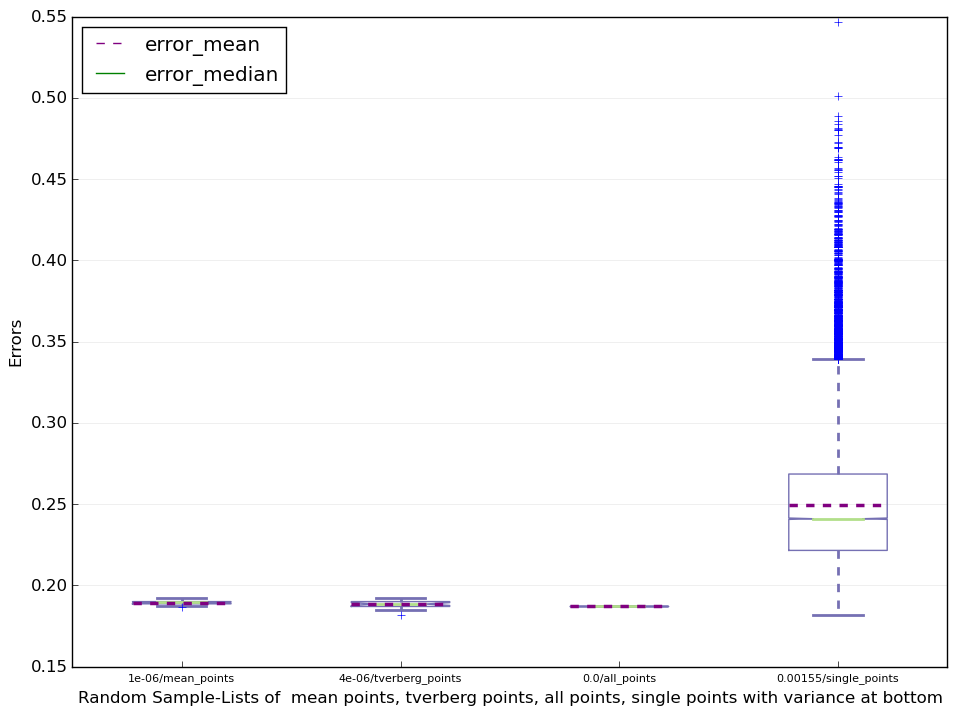
从上面的测试中,我们可以看出Iterated Tverberg Point确实可以得到很好的结果。下面比对tverberg point, averaged point, all point还有所有其他的single point(model)
大家从数据中可以看出,all point在20次测试中的表现是最好的,然后相对来说tverberg point 和 averaged point 不相伯仲。不过通过多次测试,tverberg point的error平均值相对来说比较小点。但是当数据的维度特别大时,Iterated Tverberg Point的计算需要的时间比较长,有时候当数据数量比较少时甚至没有办法使用。但是当你的数据量大,维度较少时,它是一个不错的选择。


 636
636

 被折叠的 条评论
为什么被折叠?


