
前言:研究卷积神经网络,把阅读到的一些文献经典的部分翻译一下,写成博客,代码后续给出,不足之处还请大家指出。
本文来自:tony-tan.com
Github:github.com/Tony-Tan
大型卷积神经网络在图片分类上很成功,然而我们不知道他为什么能表现的如此不错,或者如何提高。
#Abstract:
In this paper we address both issues. We introduce a novel visualization technique that gives insight into the function of inter-mediate feature layers and the operation of the classifier
我们研究一个优秀的可视化技术,能够给出函数内部特征层以及分类层的信息
Used in a diagnostic role, these visualizations allow us to find model architectures that outperform Krizhevsky et al. on the ImageNet classification benchmark.
可视化使我们找到比Kri在ImageNet分类更好的网络架构。
We also perform an ablation study to discover the performance contribution from different model layers.
我们通过切块研究发现不同层对分类的作用。
We show our ImageNet model generalizes well to other datasets: when the softmax classifier is retrained, it convincingly beats the current state-of-the-art results on Caltech-101 and Caltech-256 datasets.
我们展示了我们的 ImageNet 模型在其他数据集上获得优秀的表现:当我们重新训练SoftMax分类器。其结果信服的打败了当前SOTA结果,在Caltech-101和Caltech-256数据集上
评论:作者要解决的是可视化深度学习模型,来给出内部的结构,工作原理,以及内在结构的相关性等。并且在这个基础上反向选择优化不同的深度架构(模型)来得到更好的模型,并给出了监督学习的Pre-training方法,在不同测试数据集上表现不俗。
#Introduction
卷积神经网络很牛,在各种分类比赛上获得state-of-the-art的结果。
卷积神经网络在各大测试集上获得好结果的原因:
Several factors are responsible for this renewed interest in convnet
models:
(i) the availability of much larger training sets, with大量的训练数据
(ii) powerful GPU implementations, making the training of very large models practical
GPU的高效计算
(iii) better model regularization strategies, such as Dropout (Hinton et al., 2012).
更优秀的网络结构(例如Dropout)
Without clear understanding of how and why they work, the development of better models is reduced to trial-and-error.
如果不知道内部原因,我们的新模型只能停留在实验,观察的基础上
In this paper we introduce a visualization technique that reveals the input stimuli that excite individual feature maps at any layer in the model. It also allows us to observe the evolution of features during training and to diagnose potential problems with the model.
本文提出了一种可视化技术,其能够揭示输入是如何激活那些独立的特征映射在模型中的任一层。这项技术也允许我们来观察特征在训练过程中的进化过程来判断模型潜在的问题。
The visualization technique we propose uses a multi-layered Deconvolutional Network (deconvnet), as proposed by (Zeiler et al., 2011), to project the feature activations back to the input pixel space.
我们提出了使用多层逆卷积网络,(Zeiler et al 2014年)提出的,将特征反向映射会到输入层观察结果
We also perform a sensitivity analysis of the classifier output by occluding portions of the input image, revealing which parts of the scene are important for classification
通过遮挡输入图片的部分,对分类器进行分析,来揭示哪些部分对分类结果产生相对重的影响
Using these tools, we start with the architecture of (Krizhevsky et al., 2012) and explore different architectures, discovering ones that outperform their results on ImageNet.
使用这些工具,我们开始使用此架构探索不同的架构,认识在ImageNet上表现出色的结构
We then explore the generalization ability of the model to other datasets, just retraining the softmax classifier on top.
我们随后探索架构对于其他数据集的范化能力,在只重新训练softmax分类器的基础上。
As such, this is a form of supervised pre-training, which contrasts with the unsupervised pre-training methods popularized by (Hinton et al., 2006) and others (Bengio et al., 2007; Vincent et al., 2008)
监督学习的Pre-training来对比无监督的Pre-training方法(Hinton et al., 2006 Bengio et al., 2007; Vincent et al., 2008)
评论:主要就是说,以前都是不知道为啥深度学习会工作,不知道如何优化,只是考实验观察,现在我们能牛x的知道为啥能工作了,虽然没有数学证明,但我们知道怎么调了,知道工作原理,知道怎么Pre-training。。。
#Related Work
Our approach, by contrast, provides a non-parametric view of invariance, showing which patterns from the training set activate the feature map.
我们的工作提出了一种无参数的不变性观点,来展示训练数据的哪些部分激活了特征映射
评论:没有评论
#Approach
We use standard fully supervised convnet models throughout the paper, as defined by (LeCun et al., 1989) and (Krizhevsky et al., 2012).
我们在整篇文章使用标准完全监督卷积网络模型,在 (LeCun et al., 1989) and (Krizhevsky et al., 2012)定义的。
(i) convolution of the previous layer output (or, in the case of the 1st layer, the input image) with a set of learned filters;
(ii) pass- ing the responses through a rectified linear function (relu(x) = max(x, 0));
(iii) [optionally] max pooling over local neighborhoodsand
(iv) [optionally] a local contrast operation that normalizes the responses across feature maps.The top few layers of the network are conventional fully-connected
networks and the final layer is a softmax classifie
##Visualization with a Deconvnet
We present a novel way to map these activities back to the input pixel space, showing what input pattern originally caused a given activation in the feature maps.
我们提出了一个高级的方法来映射激活反向到输入像素空间,来展示在特征空间哪一部分输入引起了这个给定的激活
In (Zeiler et al., 2011), deconvnets were proposed as a way of performing unsupervised learning. Here, they are not used in any learning capacity, just as a probe of an already trained convent.
在(Zeiler et al., 2011),Deconvnets 被提出作为一种表现非监督学习的方法。这里他们不再用于任何其学习能力,只是用于研究已经训练好的Convnet
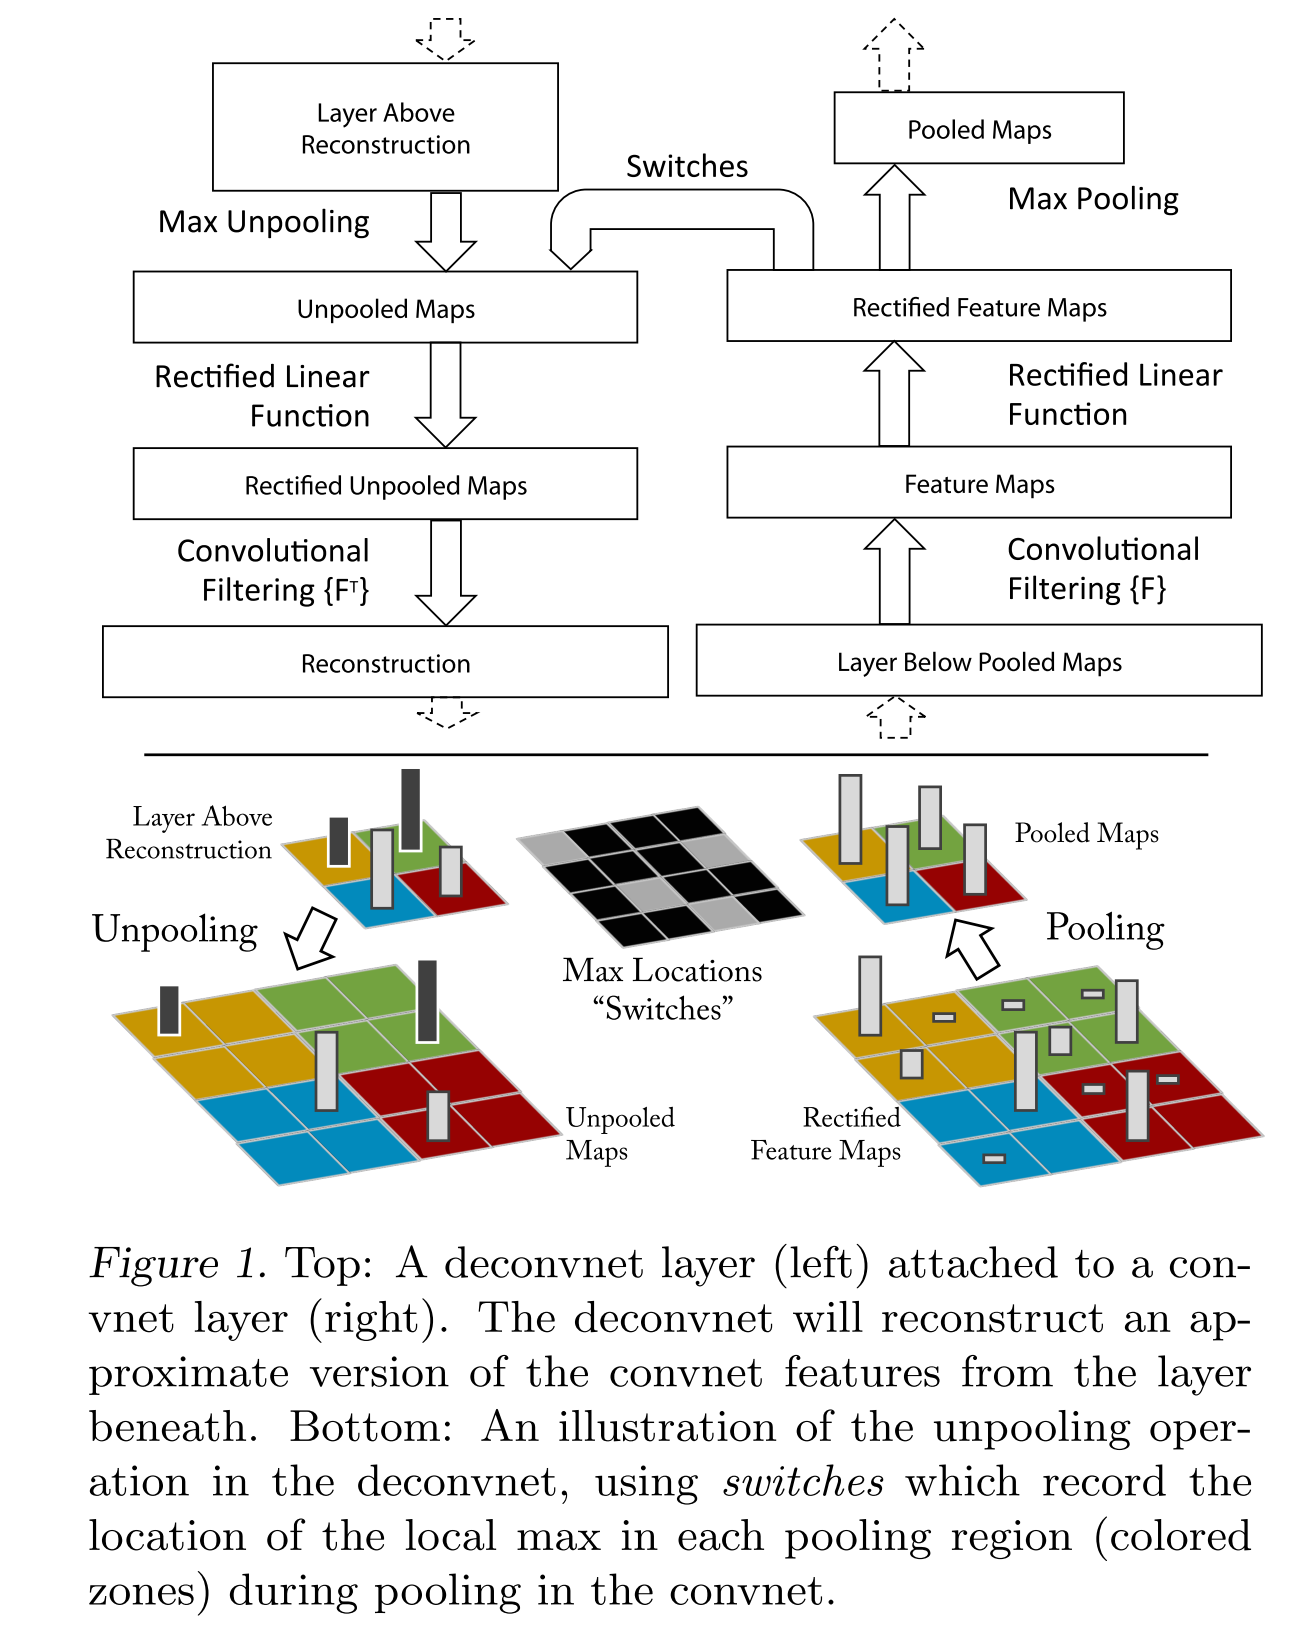
To examine a given convnet activation, we set all other activations in the layer to zero and pass the feature maps as input to the attached deconvnet layer.
为了测试一个给定的神经元激活,我们设置所有其他的同层神经元激活值为零,传导特征映射作为输入来激活deconvnet层
Then we successively (i) unpool, (ii) rectify and (iii) filter to reconstruct the activity in the layer beneath that gave rise to the chosen activation. This is then repeated until input pixel space is reached.
在激活选定特征的神经元后Unpool,rectify,filter来重建本层的激活。
###Unpooling:
In the convnet, the max pooling operation is non-invertible, however we can obtain an approximate inverse by recording the locations of the maxima within each pooling region in a set of switch variables. In the deconvnet, the unpooling operation uses these switches to place the reconstructions from the layer above into appropriate locations, preserving the structure of the stimulus. See Fig. 1(bottom) for an illustration of the procedure
最大池化不可逆,我们通过记录位置来进行近似,记录被称为一组switch值,在deconvnet中,逆池化使用这些switch值来定位重建上一层,保留激活分布。在Fig1中说明
###Rectification:
The convnet uses relu non-linearities, which rectify the feature maps
thus ensuring the feature maps are always positive. To obtain valid feature reconstructions at each layer (which also should be positive),we pass the reconstructed signal through a relu non-linearity.Convnet使用ReLu非线性函数,保证激活值非负;为保证每层特征可重建,我们让所有重建信号经过ReLu层。
###Filtering:
The convnet uses learned filters to con-volve the feature maps from the previous layer. To invert this, the deconvnet uses transposed versions of the same filters, but applied to the rectified maps, not the output of the layer beneath.
Convnet使用学习到的Filters从前一层来获取特征映射。相反,deconvnet使用同一filter的转置,但是操作的对象是整流结果(Rectification),而不是之前的层。
###总结:
Since the model is trained discriminatively, they implicitly show
which parts of the input image are discriminative由于模型是训练成有区别的,因此他们理所应当的展示输入图片的那些部分是有区别的。
Note that these projections are not samples from the model, since
there is no generative process involved注意这些映射不是从模型中采样,因为没有范化处理涉及。
评论:此段描述了具体如何反向将特征映射到像素空间。
#Training Details
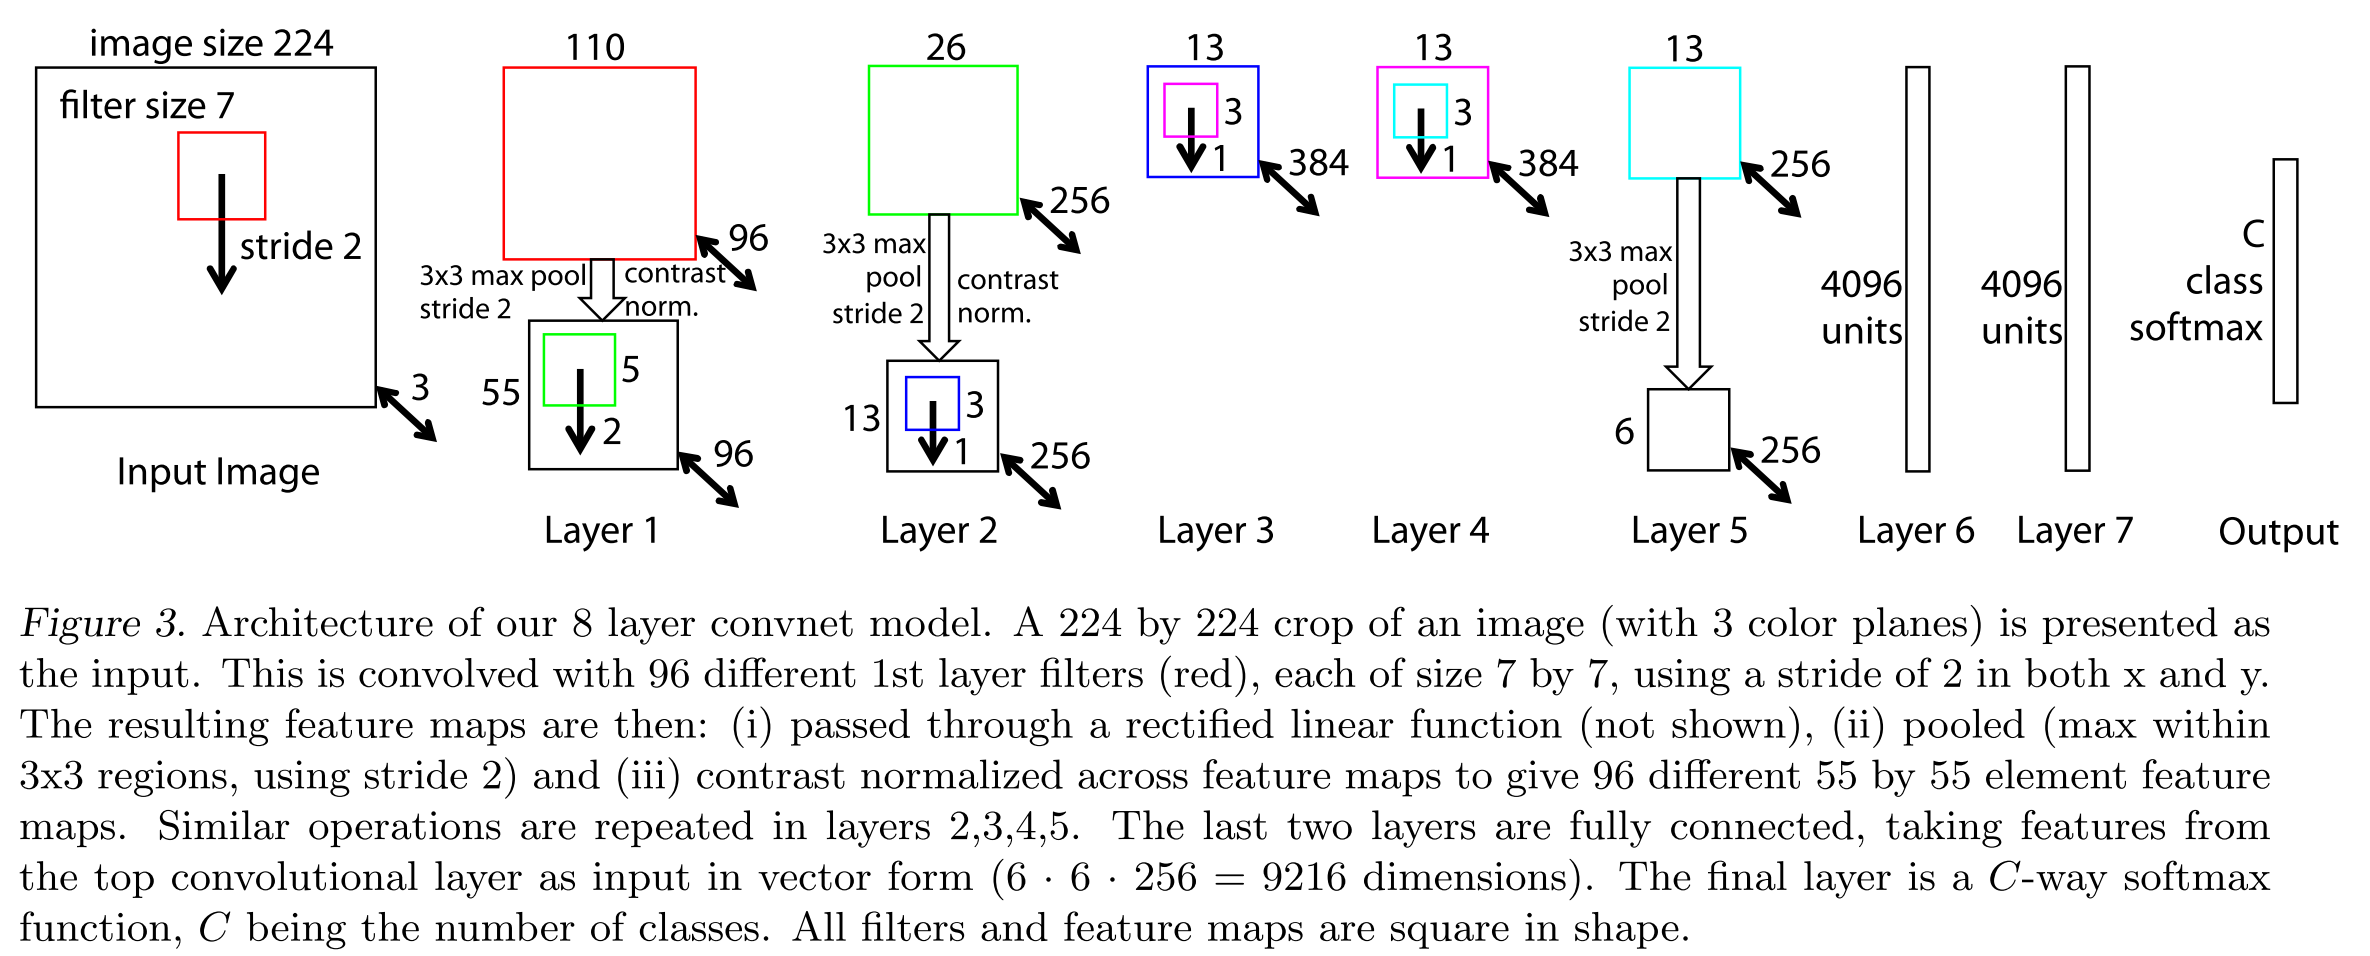
The architecture, shown in Fig. 3, is similar to that used by (Krizhevsky et al., 2012) for ImageNet classification
结构在Fig 3中(本文第一张图)。。。
训练方法:
The model was trained on the ImageNet 2012 train- ing set (1.3 million images, spread over 1000 different classes). Each RGB image was preprocessed by resizing the smallest dimension to 256, cropping the center 256x256 region, subtracting the per-pixel mean (across all images) and then using 10 different sub-crops of size 224x224 (corners + center with(out) horizontal flips). Stochastic gradient descent with a mini-batch size of 128 was used to update the parameters, starting with a learning rate of 10−2, in conjunction with a momentum term of 0.9. We anneal the learning rate throughout training manually when the validation error plateaus. Dropout (Hinton et al., 2012) is used in the fully connected layers (6 and 7) with a rate of 0.5.
此处翻译略过,描述了卷积神经网络的训练方法。
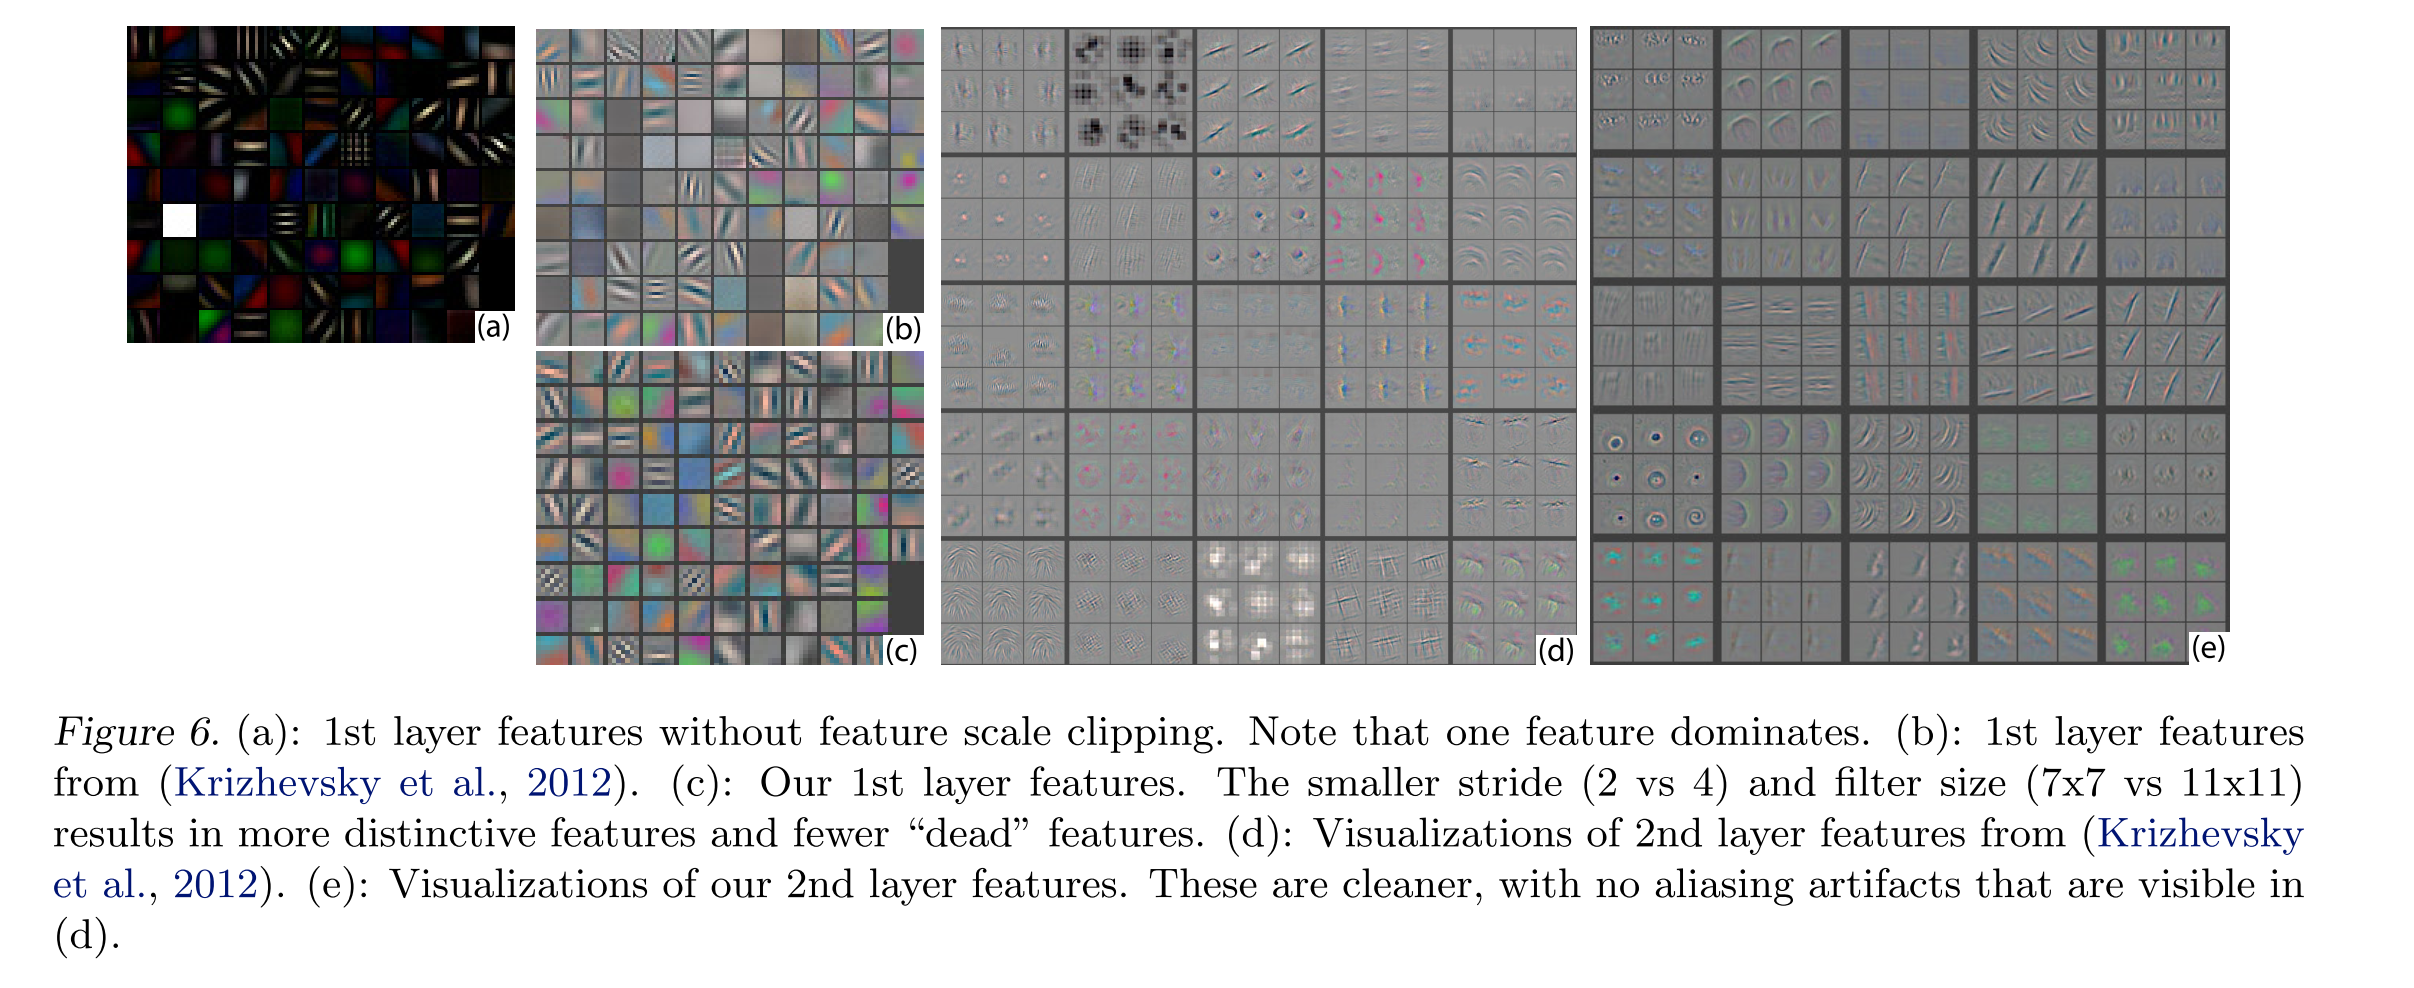
Visualization of the first layer filters during training reveals that a few of them dominate, as shown in Fig. 6(a). To combat this, we renormalize each filter in the convolutional layers whose RMS value exceeds a fixed radius of 10−1 to this fixed radius
第一层 Filter的可视化在训练过程揭示,其中一部分起支配作用,如Fig 6 a 所示,为了对抗这种情况,我们重新归一化RMS值超过fixed-radius的0.1倍的每一个在卷基层的Filter
评论:详细的训练过程
#Convnet Visualization
关于特征:
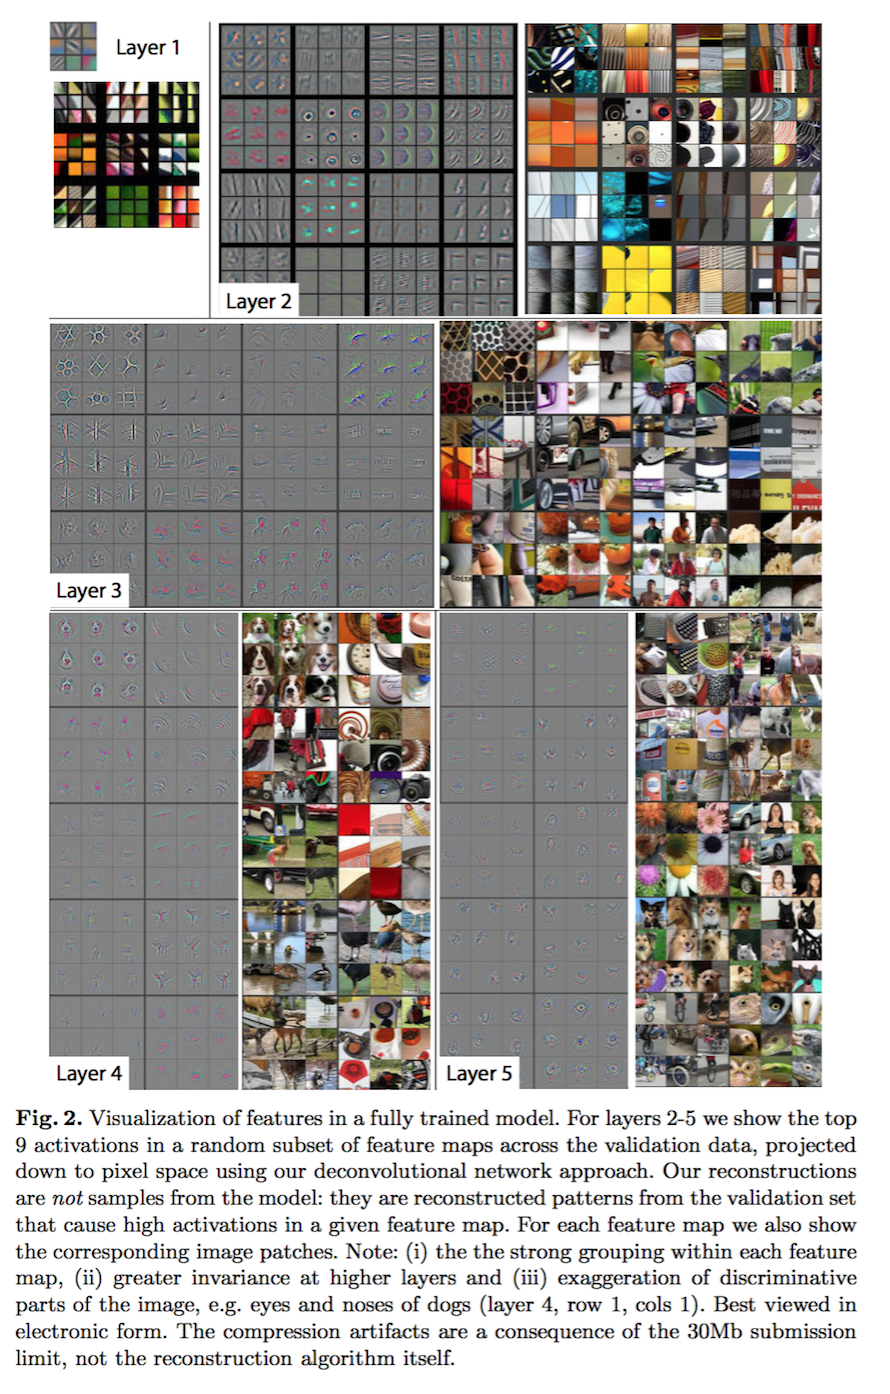
Feature Visualization: Fig. 2 shows feature visualizations from our model once training is complete. However, instead of showing the single strongest activation for a given feature map, we show the top 9 activations.
特征可视化:图2显示的特征可视化是当模型训练完成时就确定的,然而不显示对于给定特征映射的单一强刺激而显示top9
Alongside these visualizations we show the corresponding image patches. These have greater variation than visualizations as the latter solely focus on the discriminant structure within each patch.
沿着这个可视化我们可以观察到相当的当前图像区域。这有相当大的可视化成都相对于单独把注意力放到每一个path。
The projections from each layer show the hierarchical nature of the features in the network.
不同层的映射表现出网络中不同自然层级的特征
Feature Evolution during Training: Fig. 4 visualizes the progression during training of the strongest activation (across all training examples) within a given feature map projected back to pixel space.
特征在训练过程中的进化:图4,训练较强反应的神经元(在所有训练样本中)在给定特征映射逆向投影到像素空间的过程中的可视化。
Sudden jumps in appearance result from a change in the image from which the strongest activation originates.
表面上突然的跳跃来自图像最强的激活区域(此区域能够激发网络中的部分神经元产生大的特征变化)
The lower layers of the model can be seen to converge within a few epochs. However, the upper layers only develop after a considerable number of epochs (40-50), demonstrating the need to let the models train until fully converged.
模型的较低层可以在一定周期内观察到。然而,高层的网络只在相当大的周期后才能被建立起来,表明模型需要继续训练到完全收敛
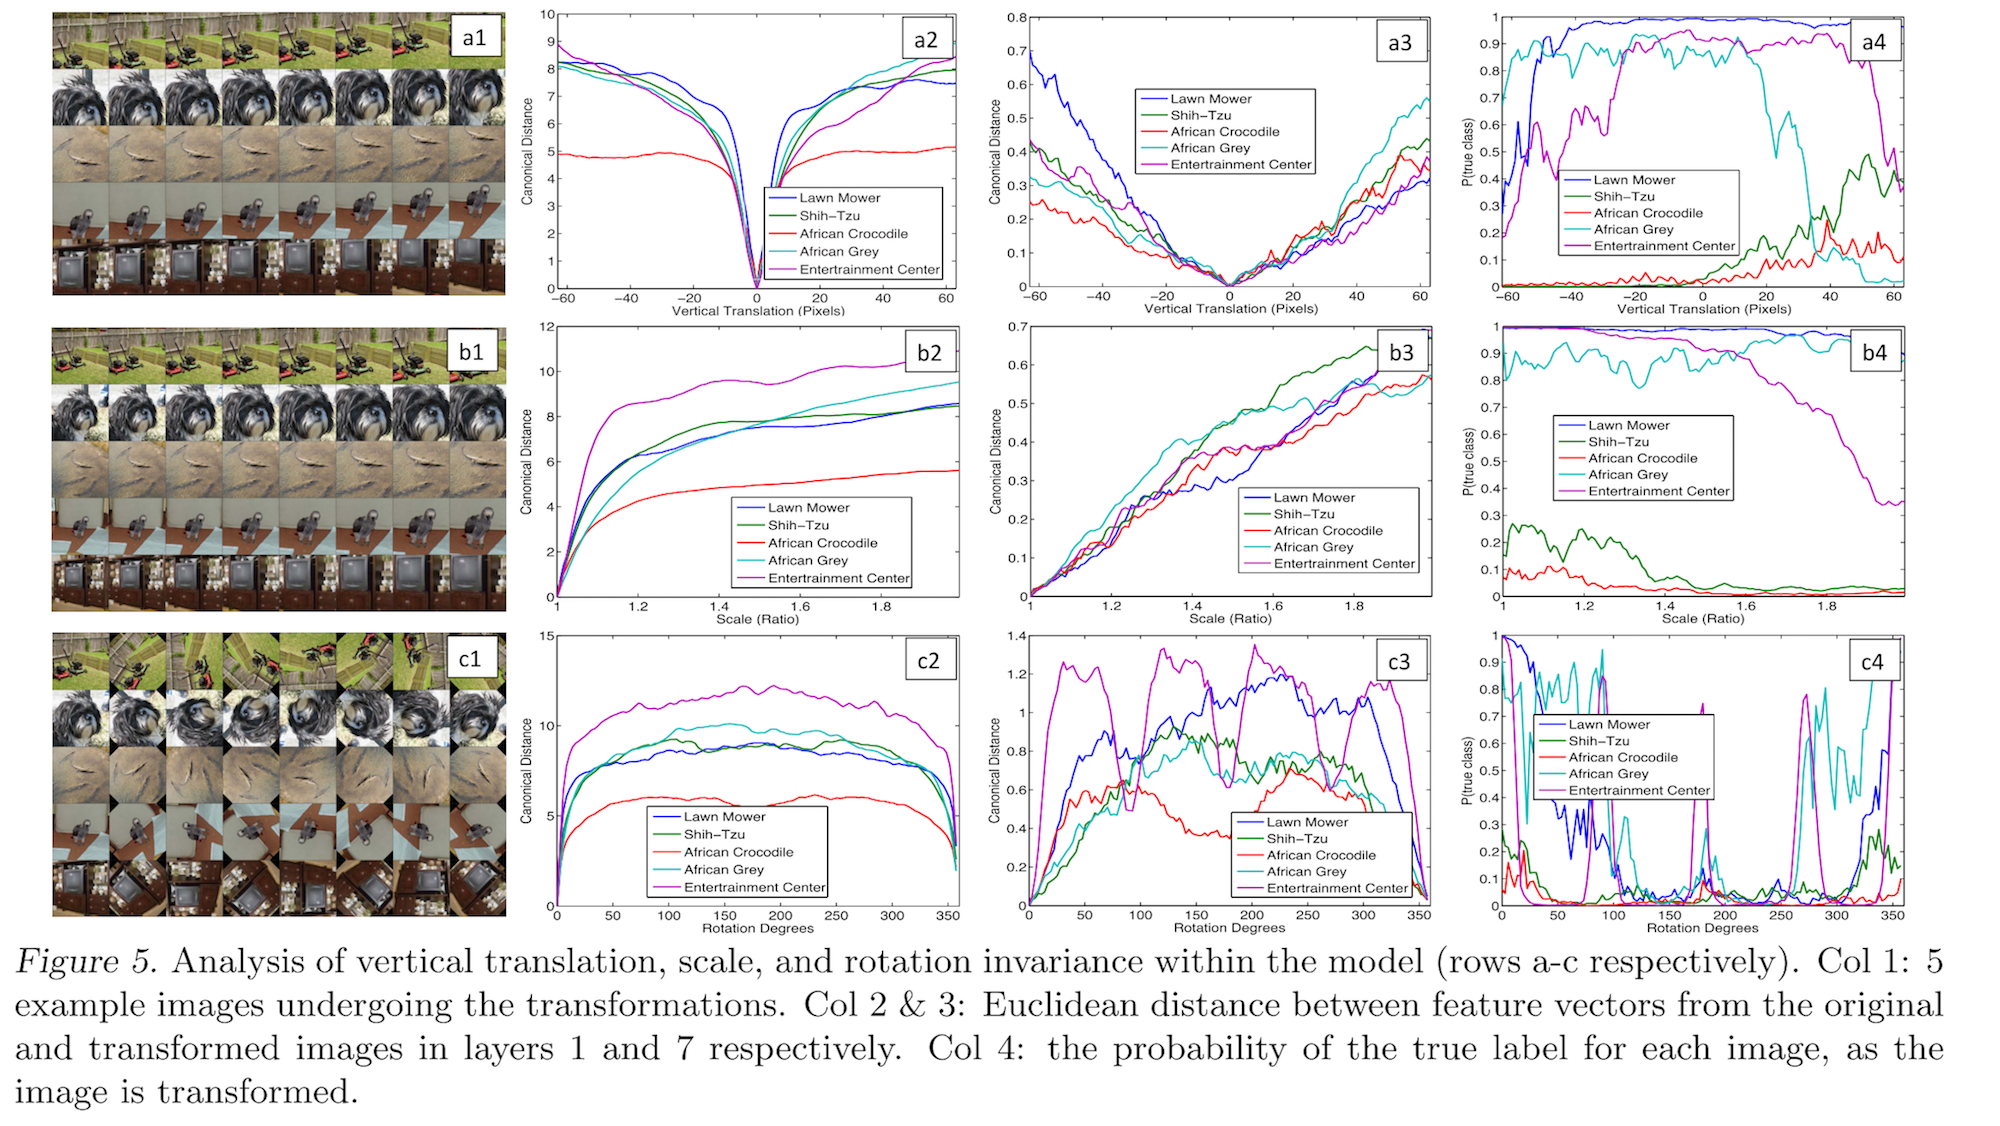
Feature Invariance: Fig. 5 shows 5 sample images being translated, rotated and scaled by varying degrees while looking at the changes in the feature vectors from the top and bottom layers of the model, relative to the untransformed feature.
特征独立性:图5,显示五个样本图经过变换,旋转,缩放多种随机模型,然后从底层到高层观察特征向量与未变换的特征向量进行对比
小的变换对于模型的第一层有显著影响,但是对于顶层特征影响不大,对于变换和缩放大致呈线性
The network output is stable to translations and scalings.
网络输出对于变换和尺度缩放稳定。
In general, the output is not invariant to rotation, except for object with rotational symmetry (e.g. entertainment center).
然而,输出对于旋转变换不稳定,除非是对齐式的旋转。
评论:训练过程中的特征是怎么来的。
##Architecture Selection
While visualization of a trained model gives insight into its operation, it can also assist with selecting good architectures in the first place.
当可视化一个训练好的模型给出了其内部的操作,也能帮助我们选取更好的架构。
The first layer filters are a mix of extremely high and low frequency information, with little coverage of the mid frequencies.
第一层filter是混合了极其高频和极其低频的信息,只有少量的中频信息。
Additionally, the 2nd layer visualization shows aliasing artifacts caused by the large stride 4 used in the 1st layer convolutions.
第二层可视化展示了混淆的手工结果由在第一层中较大的步长(4)引起的
To remedy these problems, we
解决办法:(i) reduced the 1st layer filter size from 11x11 to 7x7
(ii) made the stride of the convolution 2, rather than 4.
This new architecture retains much more information in the 1st and 2nd layer fea- tures, as shown in Fig. 6© & (e). More importantly, it also improves the classification performance as shown in Section 5.1.
评论:本段讲如何选取架构,说明步长在其中的影响
##Occlusion Sensitivity
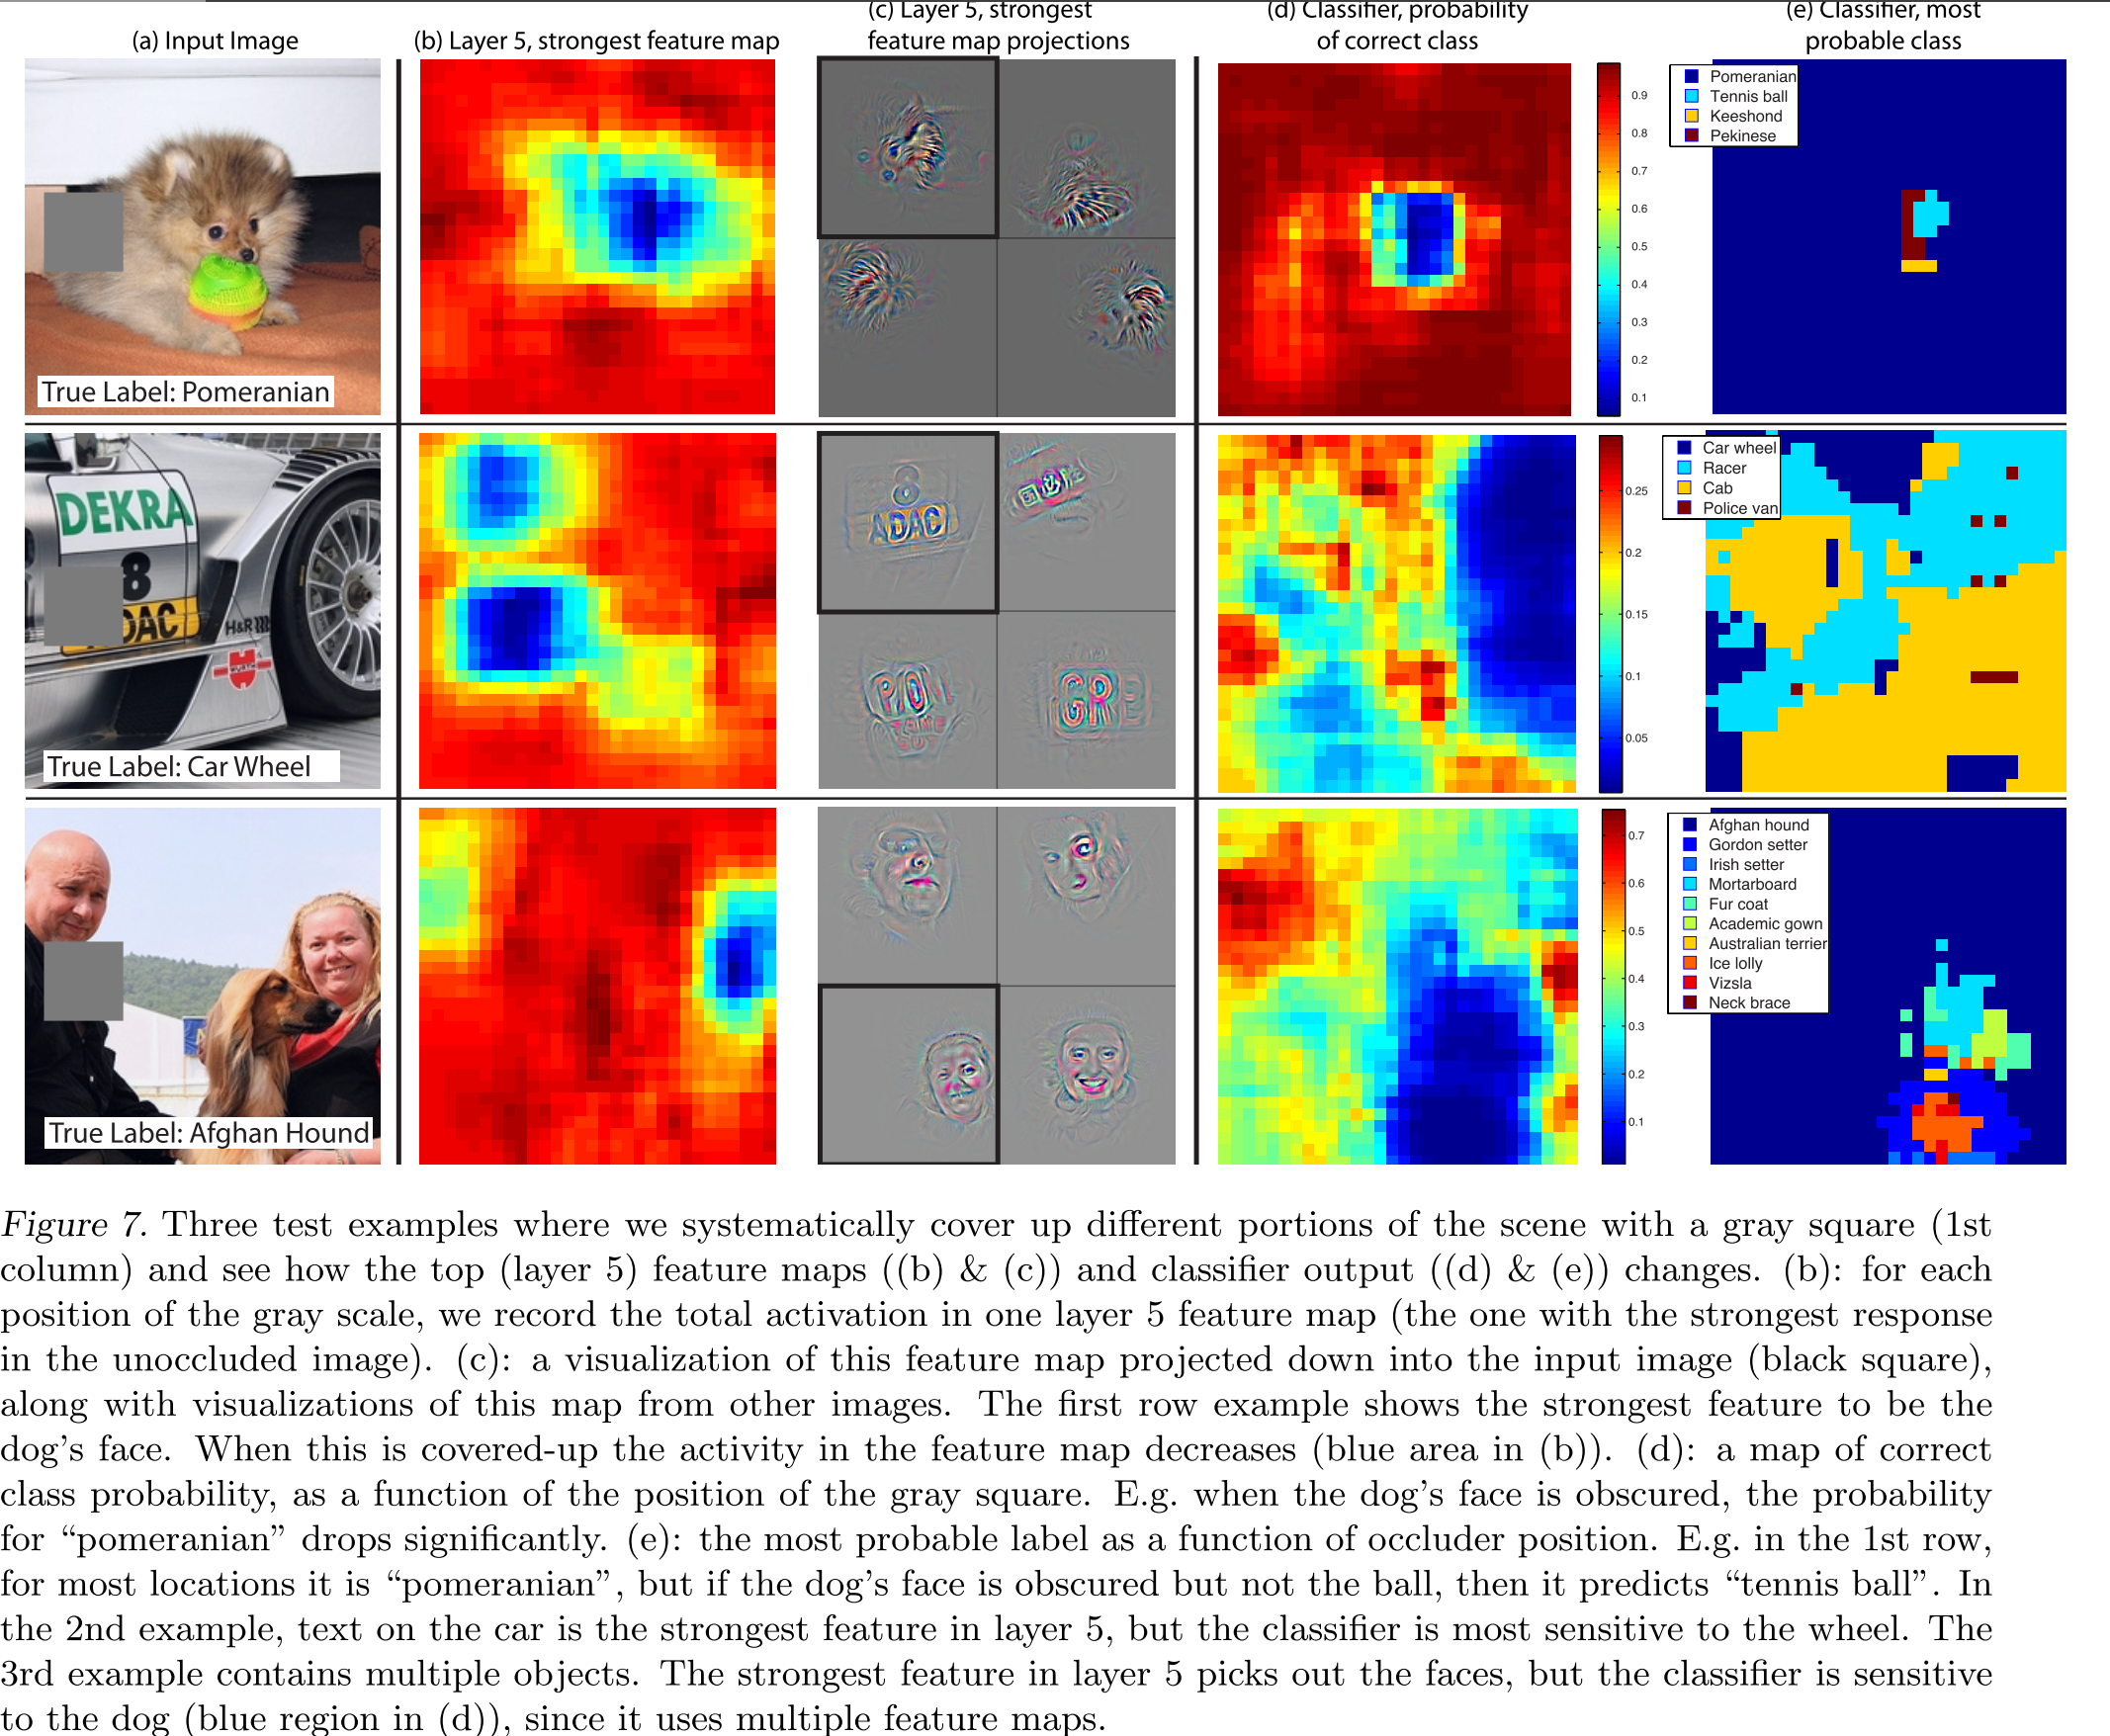
With image classification approaches, a natural question is if the model is truly identifying the location of the object in the image, or just using the surrounding context.
对于图像分类的应用,一个自然的问题是模型是否只利用图片中的物体,还是使用周围的上下文信息
Fig. 7 attempts to answer this question by systematically occluding different portions of the input image with a grey square, and monitoring the output of the classifier.
图7试图回答这个问题,通过系统的遮挡输入图片不同的位置,使用一个灰色方框,然后监视分类器的输出
When the occluder covers the image region that appears in the visualization, we see a strong drop in activity in the feature map.
当遮挡覆盖到可视化中出现的区域,我们发现在特征映射层有一个强烈的drop
Fig. 4 and Fig. 2. 图4和图2
评论:遮挡不同区域的影响,不同区域敏感度不同。
##Correspondence Analysis
一致性分析
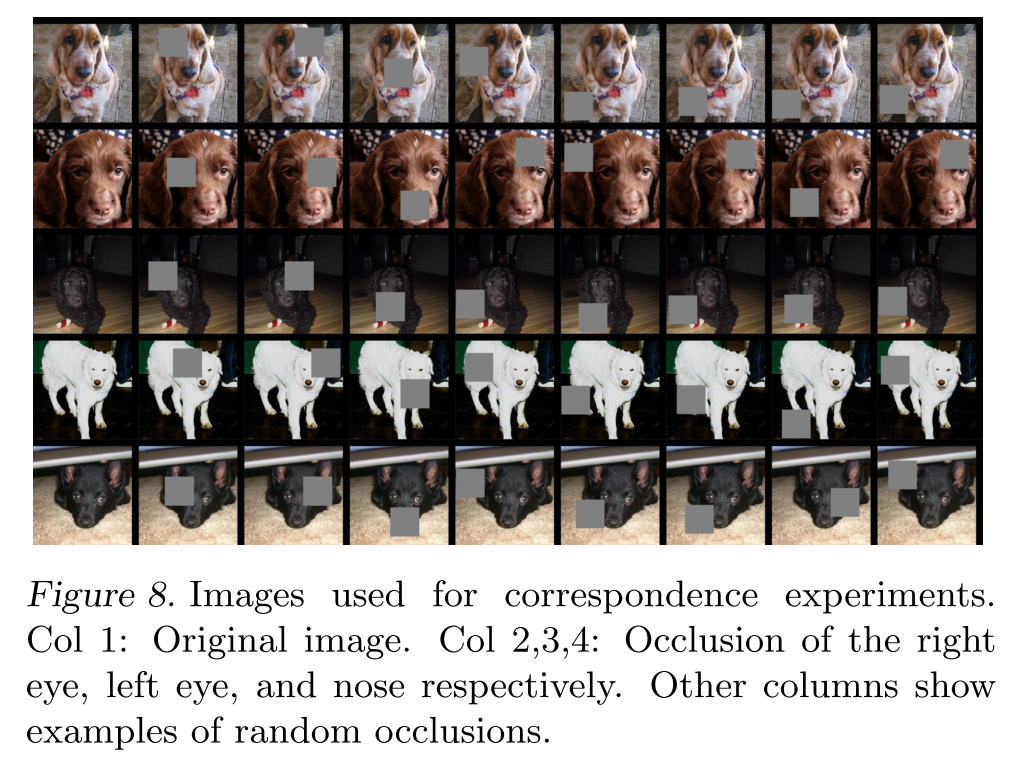
Deep models differ from many existing recognition approaches in that there is no explicit mechanism for establishing correspondence between specific object parts in different images (e.g. faces have a particular spatial configuration of the eyes and nose)
深度学习模型与现存其他识别机制不同在于:其不存在对于在不同图片之间某些物体的特殊部分之间的准确的区别关系(例如:脸部存在一个鼻子和脸的特别空间关系)
不同的特征向量计算公式:
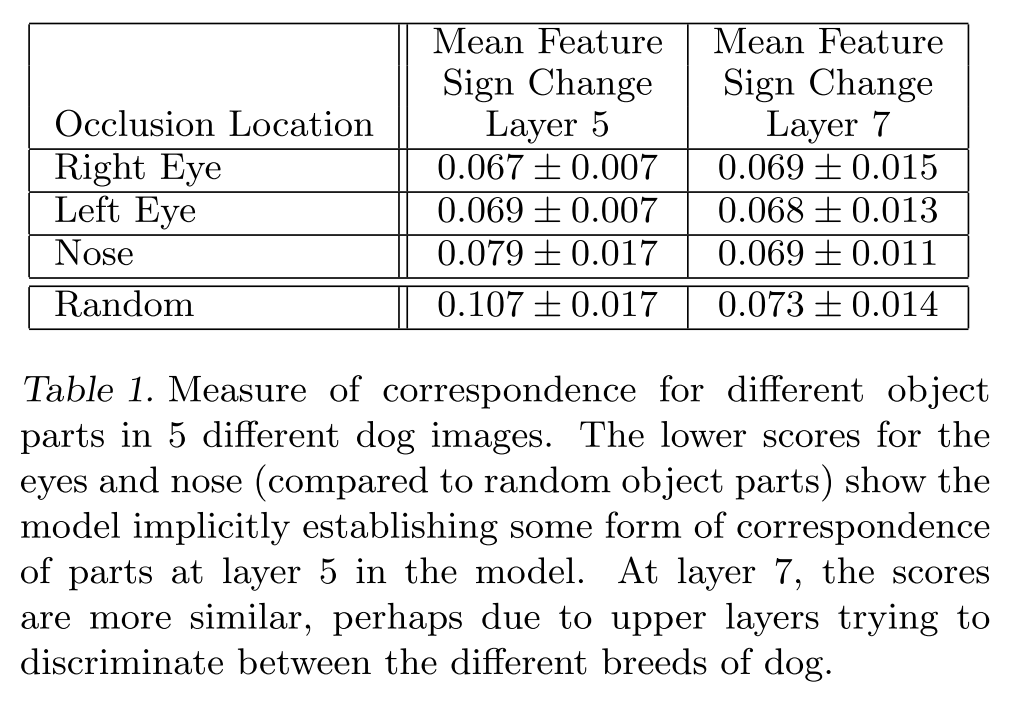
We then measure the consistency of this difference vector delta between all related image pairs (i, j):
我们然后计算所有图片对之间的不同。
where H is Hamming distance.
H为汉明距离A lower value indicates greater consistency in the change resulting
from the masking operation, hence tighter correspondence between the
same object parts in different images (i.e. blocking the left eye)在遮挡操作的变换结果中,一个较低的值表示部件之间较大的相关性fig8:
Table 1
评论:不同特征的独立性验证,如果你有鼻子眼睛嘴的脸部特征,遮住鼻子对最后的特征向量影响不大,说明他们之间的相关性比较强,类似于一张图如果有鼻子,基本也有眼睛,所以你遮住眼睛也会得到差不多的特征向量。
总结:简单的学习了一下这篇文章,后面第五部分讲的是经验,关于如何训练高质量的网络,会在下一篇推出,欢迎收看。







 1377
1377

 被折叠的 条评论
为什么被折叠?


