


Legend()参数调整图例位置
在日常使用中,有时默认的图例位置不符合我们的需要,那么我们可以添加参数对图例的位置进行调整。
matplotlib.pyplot.legend(loc='String' or Number, bbox_to_anchor=(num1, num2))
1.loc参数的具体使用情况如下:
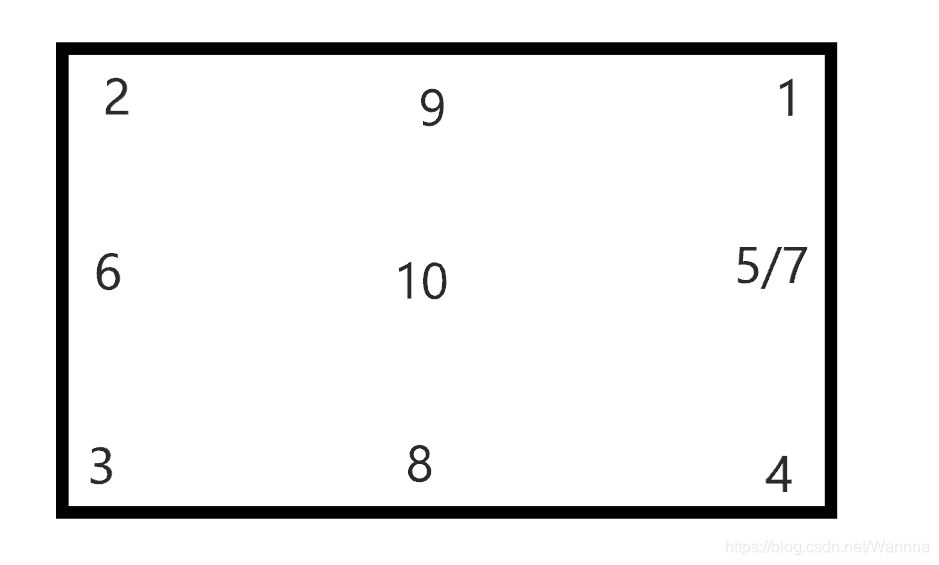
String由两个单词拼合而成,第一个单词为upper/center/lower,用于描述摆放位置的上/中/下,第二个单词为left/center/right,用于描述摆放位置的左/中/右,例如右上,即为upper right。对应的有Number参数与之对应,具体请看下文:
注:loc参数用于大致调整图例位置。
| 位置 | String | Number |
|---|---|---|
| 右上 | upper right | 1 |
| 左上 | upper left | 2 |
| 左下 | lower left | 3 |
| 右下 | lower right | 4 |
| 正右 | right | 5 |
| 中央偏左 | center left | 6 |
| 中央偏右 | center right | 7 |
| 中央偏下 | lower center | 8 |
| 中央偏上 | upper center | 9 |
| 正中央 | center | 10 |
具体在图中的位置见下图:
2.bbox_to_anchor参数的使用情况如下:
bbox_to_anchor被赋予的二元组中,num1用于控制legend的左右移动,值越大越向右边移动,num2用于控制legend的上下移动,值越大,越向上移动。
注:bbox_to_anchor参数用于微调图例位置。
3.来段实际的代码例子:
import numpy as np
import matplotlib.pyplot as plt
import matplotlib
x = np.linspace(-2*np.pi, 2*np.pi, 10000)
y = np.sin(x)
z = np.cos(x)
plt.plot(x, y, color="black", linestyle="-.", linewidth="2", label="sinx")
plt.plot(x, z, color="blue", linestyle="-", linewidth="2", label="cosx")
plt.xlabel("x")
plt.ylabel("y")
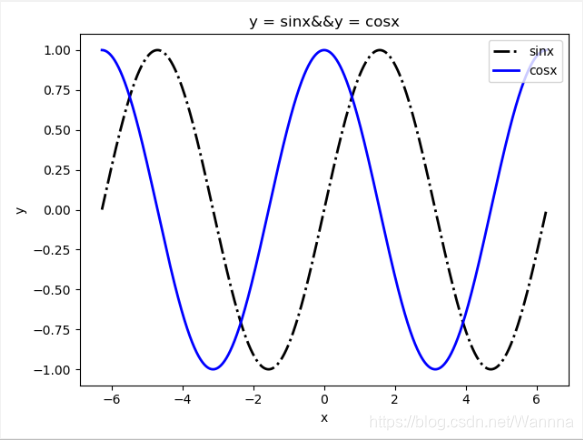
plt.legend(loc="upper right") # 与plt.legend(loc=1)等价
plt.title("y = sinx&&y = cosx")
plt.show()
运行结果如下:
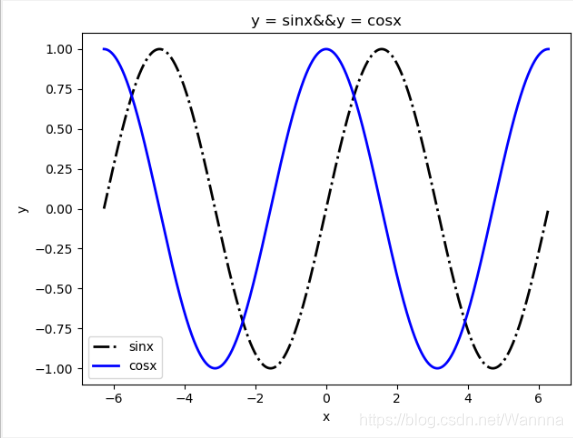
若将第十一行中的plt.legend(loc=“upper right”)改为plt.legend(loc=“lower left”),则运行结果如下
参考:
[1]python画图matplotlib的Legend
[2]matplotlib中legend位置调整


 1万+
1万+

 被折叠的 条评论
为什么被折叠?
被折叠的 条评论
为什么被折叠?
 到【灌水乐园】发言


