


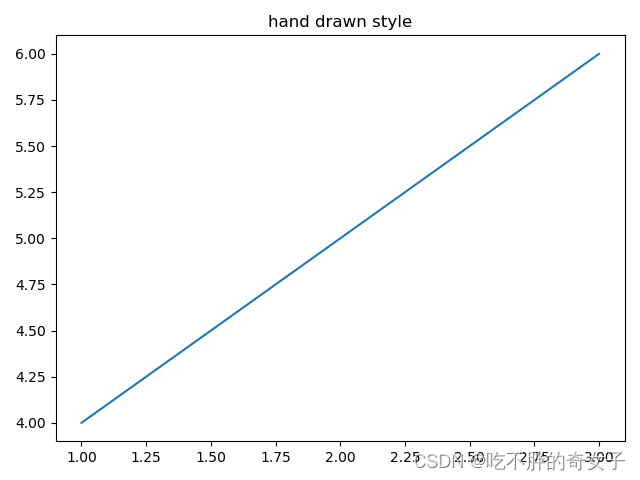
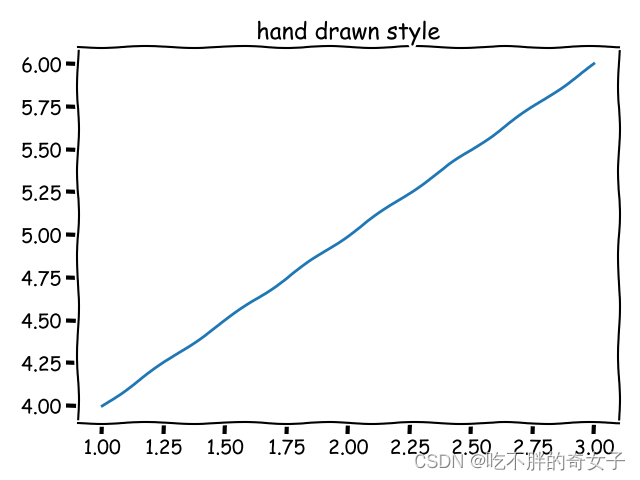
如何从图1变成图2?
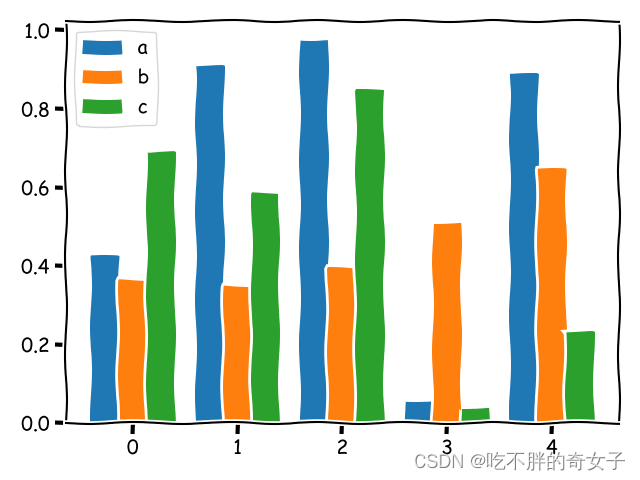
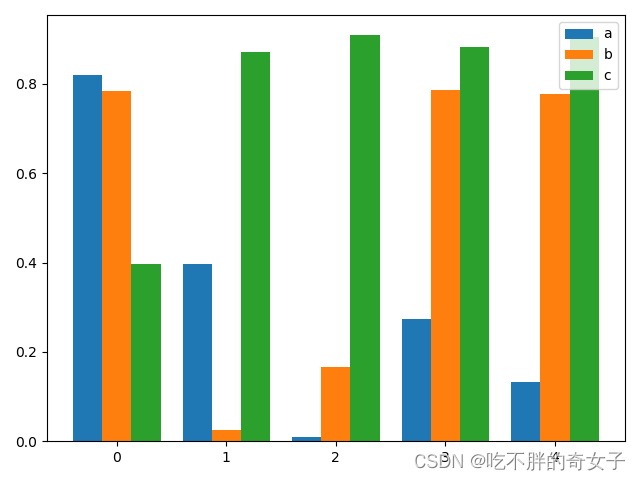
图1 图2
仅需一行代码,便可实现!
with plt.xkcd(scale=1, length=100, randomness=2):上图代码示例:只需在画图部分添加上述代码即可:
import matplotlib.pyplot as plt
import numpy as np

size = 5
# 返回size个0-1的随机数
a = np.random.random(size)
b = np.random.random(size)
c = np.random.random(size)
# x轴坐标, size=5, 返回[0, 1, 2, 3, 4]
x = np.arange(size)

# 有a/b/c三种类型的数据,n设置为3
total_width, n = 0.8, 3
# 每种类型的柱状图宽度
width = total_width / n

# 重新设置x轴的坐标
x = x - (total_width - width) / 2
print(x)

# 画柱状图
with plt.xkcd(scale=1, length=100, randomness=2):
    plt.bar(x, a, width=width, label="a")
    plt.bar(x + width, b, width=width, label="b")
    plt.bar(x + 2*width, c, width=width, label="c")
    # 显示图例
    plt.legend()
    # 显示柱状图
    plt.show()
是不是很简单呢?适用于各种图哦,去试试吧~


 1688
1688


 被折叠的 条评论
为什么被折叠?
被折叠的 条评论
为什么被折叠?
 到【灌水乐园】发言


