


ELK实例----Filebeat 收集Nginx日志和系统日志利用 Redis 缓存发送至Elasticsearch
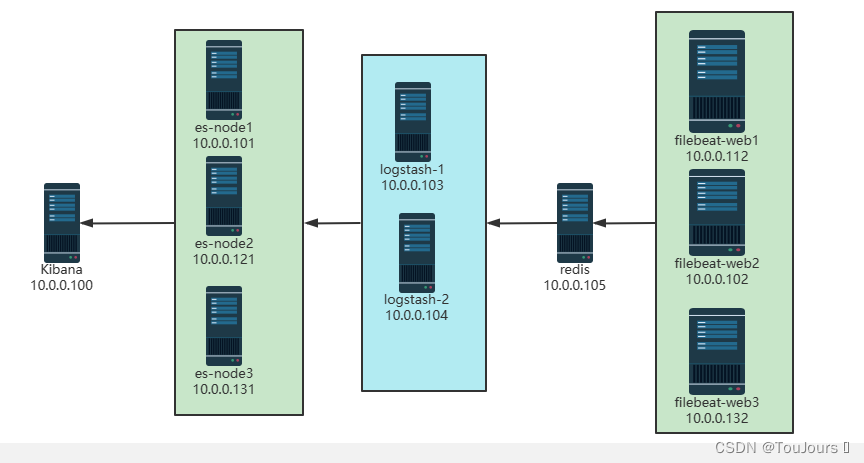
1.0 环境拓扑图
集群
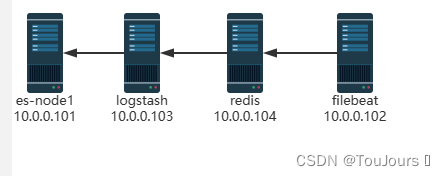
单机
1.1 环境准备
| 节点名称 | 节点名称 | ip地址 |
|---|---|---|
| kibana | kibana | 10.0.0.100 |
| elasticsearch | elasticsearch | 10.0.0.101 |
| filebeat | filebeat | 10.0.0.102 |
| logstash | logstash | 10.0.0.103 |
| redis | redis | 10.0.0.100 |
1.2 安装
- elasticsearch、Kibana、metricbeat、filebeat版本要一致,如都是7.17.5版本
1.2.1 filebeat安装
- 10.0.0.102机器上
下载
wget https://mirrors.tuna.tsinghua.edu.cn/elasticstack/7.x/apt/pool/main/f/filebeat/filebeat-7.17.5-amd64.deb
安装
dpkg -i filebeat-7.17.5-amd64.deb

创建配置
vim /etc/filebeat/stdin.yml
1.2.2 nginx安装
- 10.0.0.102机器上
apt update
apt -y install nginx
默认开启nginx的错误日志,但如果是ubuntu,还需要修改下面行才能记录错误日志
[root@elk-web1 ~]#vim /etc/nginx/sites-available/default
location / {
# First attempt to serve request as file, then
# as directory, then fall back to displaying a 404.
#try_files $uri $uri/ =404; #将此行注释
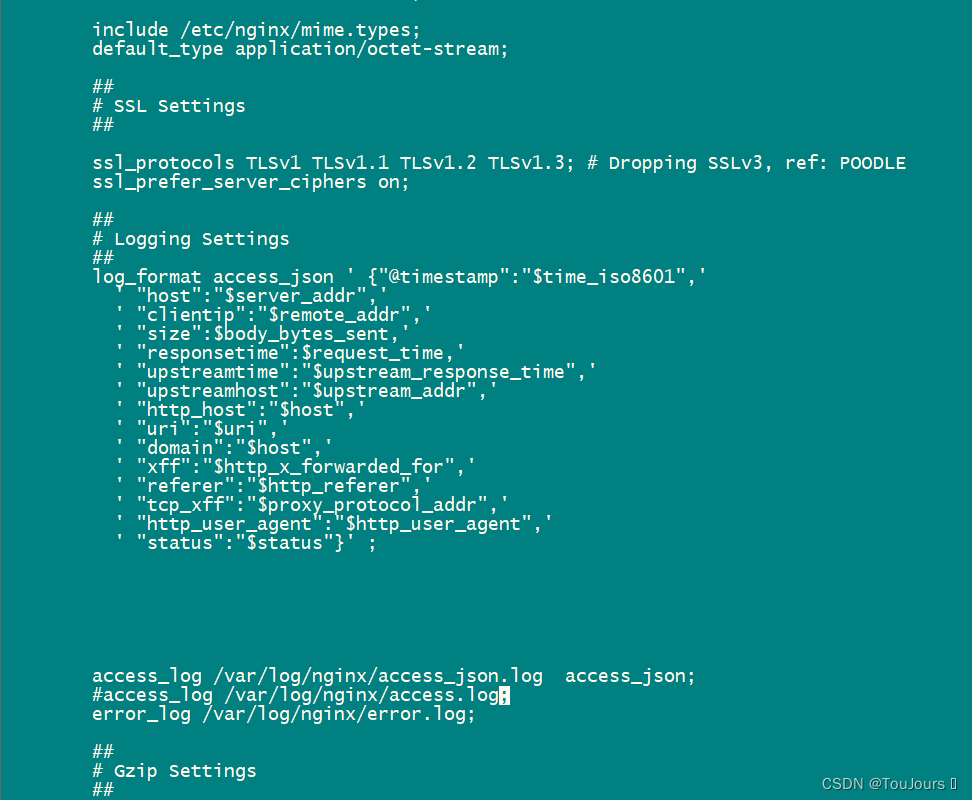
修改成功日志access为json格式
root@filebeat:~# vi /etc/nginx/nginx.conf
http {
##
# Basic Settings
##
'''
# Logging Settings
##
log_format access_json ' {"@timestamp":"$time_iso8601",'
' "host":"$server_addr",'
' "clientip":"$remote_addr",'
' "size":$body_bytes_sent,'
' "responsetime":$request_time,'
' "upstreamtime":"$upstream_response_time",'
' "upstreamhost":"$upstream_addr",'
' "http_host":"$host",'
' "uri":"$uri",'
' "domain":"$host",'
' "xff":"$http_x_forwarded_for",'
' "referer":"$http_referer",'
' "tcp_xff":"$proxy_protocol_addr",'
' "http_user_agent":"$http_user_agent",'
' "status":"$status"}' ;
access_log /var/log/nginx/access_json.log access_json;
#access_log /var/log/nginx/access.log;
error_log /var/log/nginx/error.log;
##
# Gzip Settings
##
'''
重启nginx服务
systemctl restart nginx
查看是否是json格式
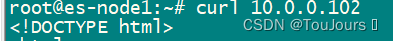
其他机器curl 10.0.0.102
root@filebeat:~# tail -f /var/log/nginx/access_json.log
{"@timestamp":"2022-12-30T09:05:23+00:00", "host":"10.0.0.102", "clientip":"10.0.0.101", "size":612, "responsetime":0.000, "upstreamtime":"-", "upstreamhost":"-", "http_host":"10.0.0.102", "uri":"/index.nginx-debian.html", "domain":"10.0.0.102", "xff":"-", "referer":"-", "tcp_xff":"-", "http_user_agent":"curl/7.68.0", "status":"200"}

1.2.3 安装elasticsearch
- CPU 2C 内存4G或更多
- 10.0.0.101机器上
安装jdk8
apt update;apt -y install openjdk-8-jdk

安装elasticsearch
wget https://mirrors.tuna.tsinghua.edu.cn/elasticstack/7.x/apt/pool/main/e/elasticsearch/elasticsearch-7.17.5-amd64.deb
dpkg -i elasticsearch-7.17.5-amd64.deb

修改配置文件,单节点配置
cat >> /etc/elasticsearch/elasticsearch.yml  <<EOF
node.name: node-1
network.host: 0.0.0.0
discovery.seed_hosts: ["$LOCAL_IP"]
cluster.initial_master_nodes: ["node-1"]
EOF

mkdir -p /etc/systemd/system/elasticsearch.service.d/
cat > /etc/systemd/system/elasticsearch.service.d/override.conf <<EOF
[Service]
LimitMEMLOCK=infinity
EOF

加载配置
systemctl daemon-reload
systemctl enable  elasticsearch.service

修改内核参数
echo "vm.max_map_count = 262144" >> /etc/sysctl.conf
sysctl  -p

启动elasticsearch服务
systemctl start elasticsearch
1.2.4 安装 Kibana
- 10.0.0.100机器上
下载kibana
wget https://mirrors.tuna.tsinghua.edu.cn/elasticstack/7.x/apt/pool/main/k/kibana/kibana-7.17.5-amd64.deb
安装kibana
dpkg -i kibana-7.17.5-amd64.deb

修改下面几行就行
root@es-node1:~# grep "^[a-Z]" /etc/kibana/kibana.yml
server.port: 5601
server.host: "0.0.0.0"
elasticsearch.hosts: ["http://10.0.0.101:9200"]
i18n.locale: "zh-CN"

启动kibana服务
systemctl enable --now kibana
1.2.5 redis安装和配置
- 10.0.0.100机器上安装
apt update
apt -y install redis
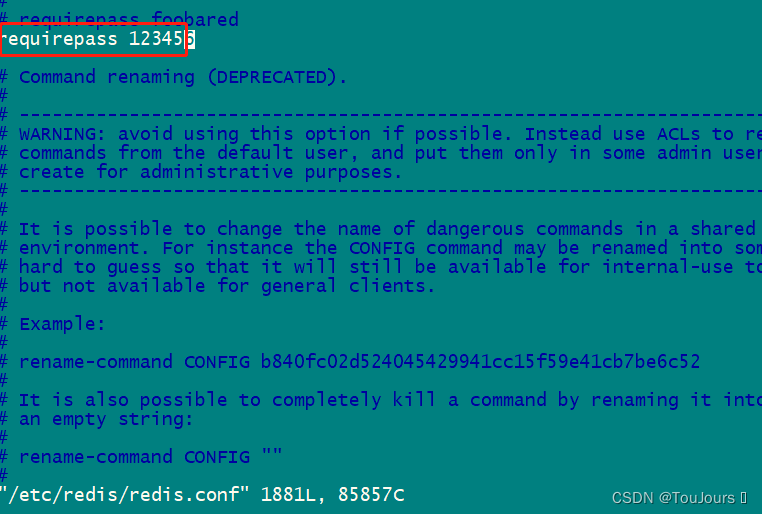
修改redis配置
sed -i.bak '/^bind.*/c bind 0.0.0.0' /etc/redis/redis.conf
vi /etc/redis/redis.conf
requirepass 123456
重启服务
systemctl restart redis
1.2.6 logstash安装
- 10.0.0.103机器上安装
安装
apt update;apt -y install openjdk-8-jdk

cd /usr/local/src/
wget https://mirrors.tuna.tsinghua.edu.cn/elasticstack/7.x/apt/pool/main/l/logstash/logstash-7.17.5-amd64.deb


dpkg -i logstash-7.17.5-amd64.deb
软连接
ln -s  /usr/share/logstash/bin/logstash /usr/bin/logstash
启动服务
systemctl	enable  logstash
1.3 修改 Filebeat 配置
- 利用 Filebeat 收集日志到 Redis
-------------------------redis-------------------------------
[root@logsj ~]# vim /etc/filebeat/filebeat.yml
filebeat.inputs:
- type: log
  enable: true
  paths:
    - /var/log/nginx/access_json.log
  json.keys_under_root: true
  json.overwrite_keys: true
  tags: ["nginx-access"]

- type: log
  enable: true
  paths:
    - /var/log/nginx/error.log
  tags: ["nginx-error"]

- type: log
  enable: true
  paths:
    - /var/log/syslog
  tags: ["syslog"]

output.redis:
  hosts: ["10.0.0.100:6379"]
  key: "filebeat"
  password: "123456"
  #db: 0

重启filebeat服务
systemctl restart filebeat.service
systemctl status filebeat.service
1.4 修改logstash配置
- logstash收集Redis数据发送至Elasticsearch
vim /etc/logstash/conf.d/redis_to_es.conf

input {
    redis {
        host => "10.0.0.100"
        port => "6379"
        password => "123456"
        db => "0"
        data_type => "list"
        key => "filebeat"
    }
}
output {
    if "syslog" in [tags] {
        elasticsearch {
          hosts => "10.0.0.101:9200"
          index => "syslog-%{+YYYY.MM.dd}"
       }
    }
    if "nginx-access" in [tags] {
        elasticsearch {
          hosts => "10.0.0.101:9200"
          index => "nginx-accesslog-%{+YYYY.MM.dd}"
          template_overwrite => true
       }
    }
    if "nginx-error" in [tags] {
        elasticsearch {
          hosts => "10.0.0.101:9200"
          index => "nginx-errorlog-%{+YYYY.MM.dd}"
          template_overwrite => true
       }
    }

}

检查配置
logstash -f /etc/logstash/conf.d/redis_to_es.conf  --config.reload.automatic
1.5 日志插入数据
1.5.1 nginx_access_json.log
curl 10.0.0.102
1.5.2 nginx_error.log
curl 10.0.0.102/xxx.html
1.5.3 syslog
echo 112541 >> /var/log/syslog
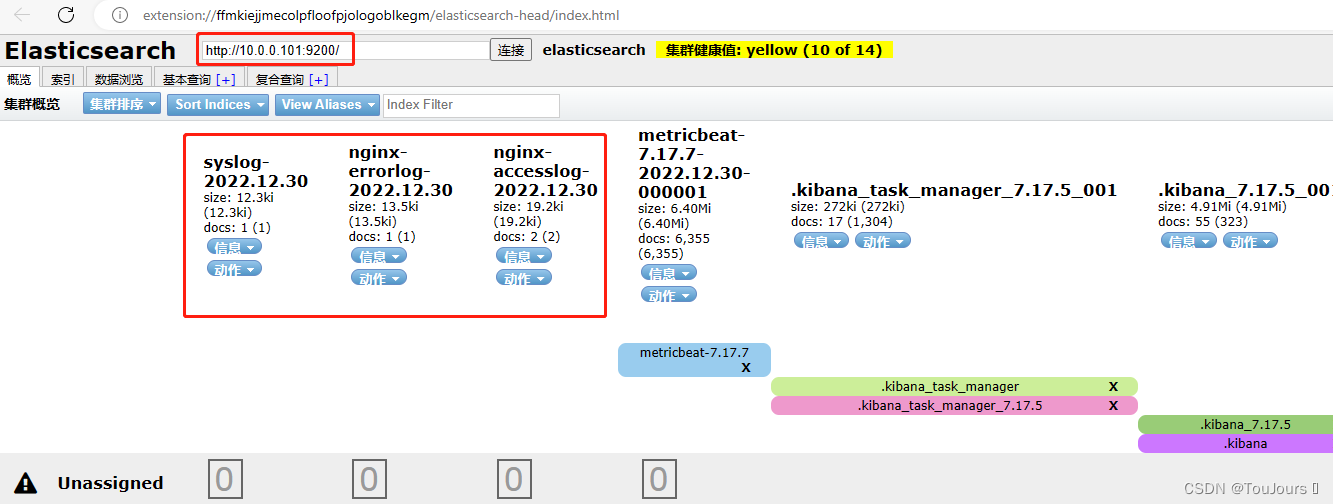
1.6 通过 Head 插件查看索引
1.7 通过 Kibana 创建索引模式查看
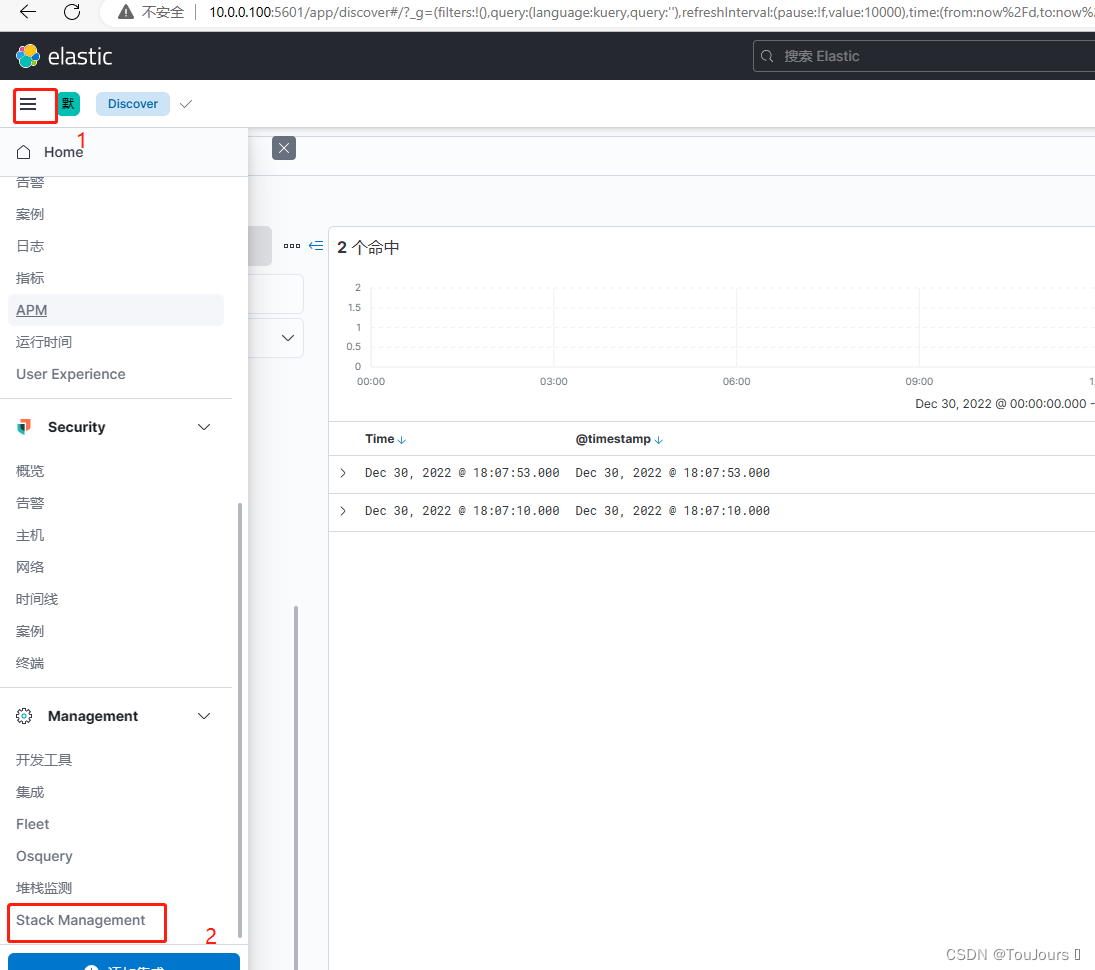
浏览器http://10.0.0.100:5601/
1.7.1 点击左上角三个横杠,然后点Stack Management
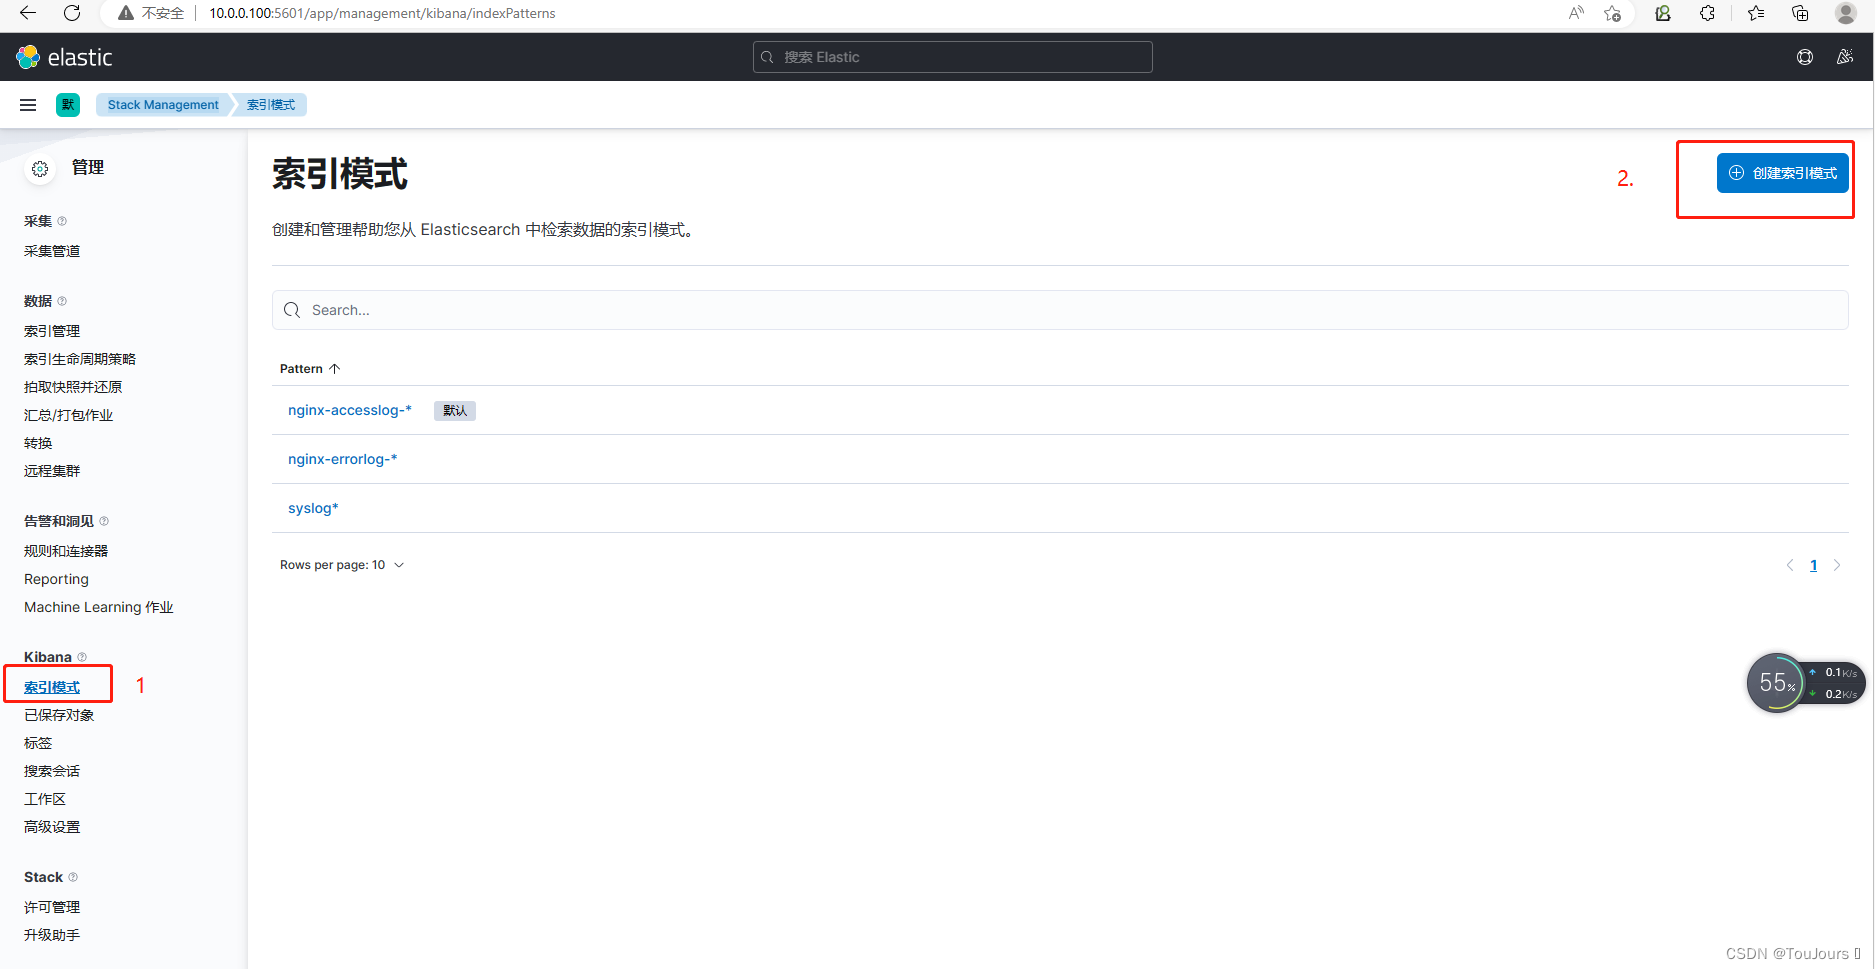
1.7.2 点击索引模式,再点右上角创建索引
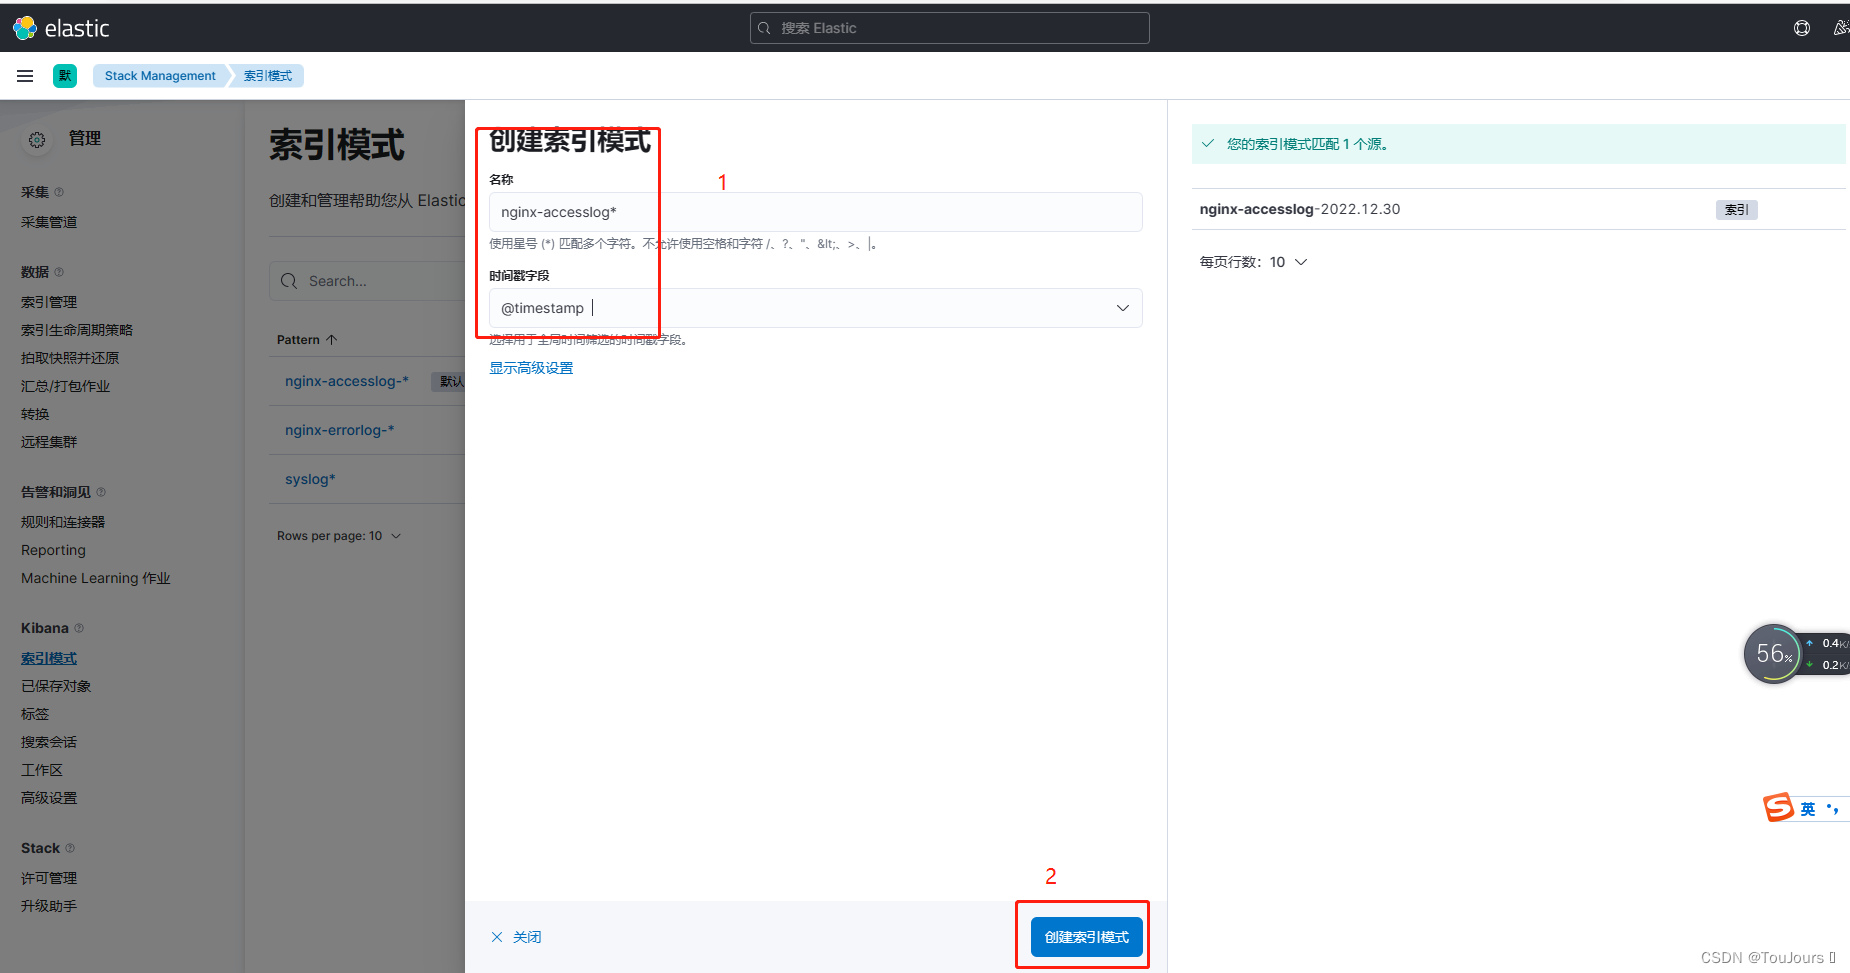
1.7.3 创建nginx-accesslog索引
- 索引名称: nginx-accesslog-*,时间戳字段:@timestamp,然后点下面的创建索引模式
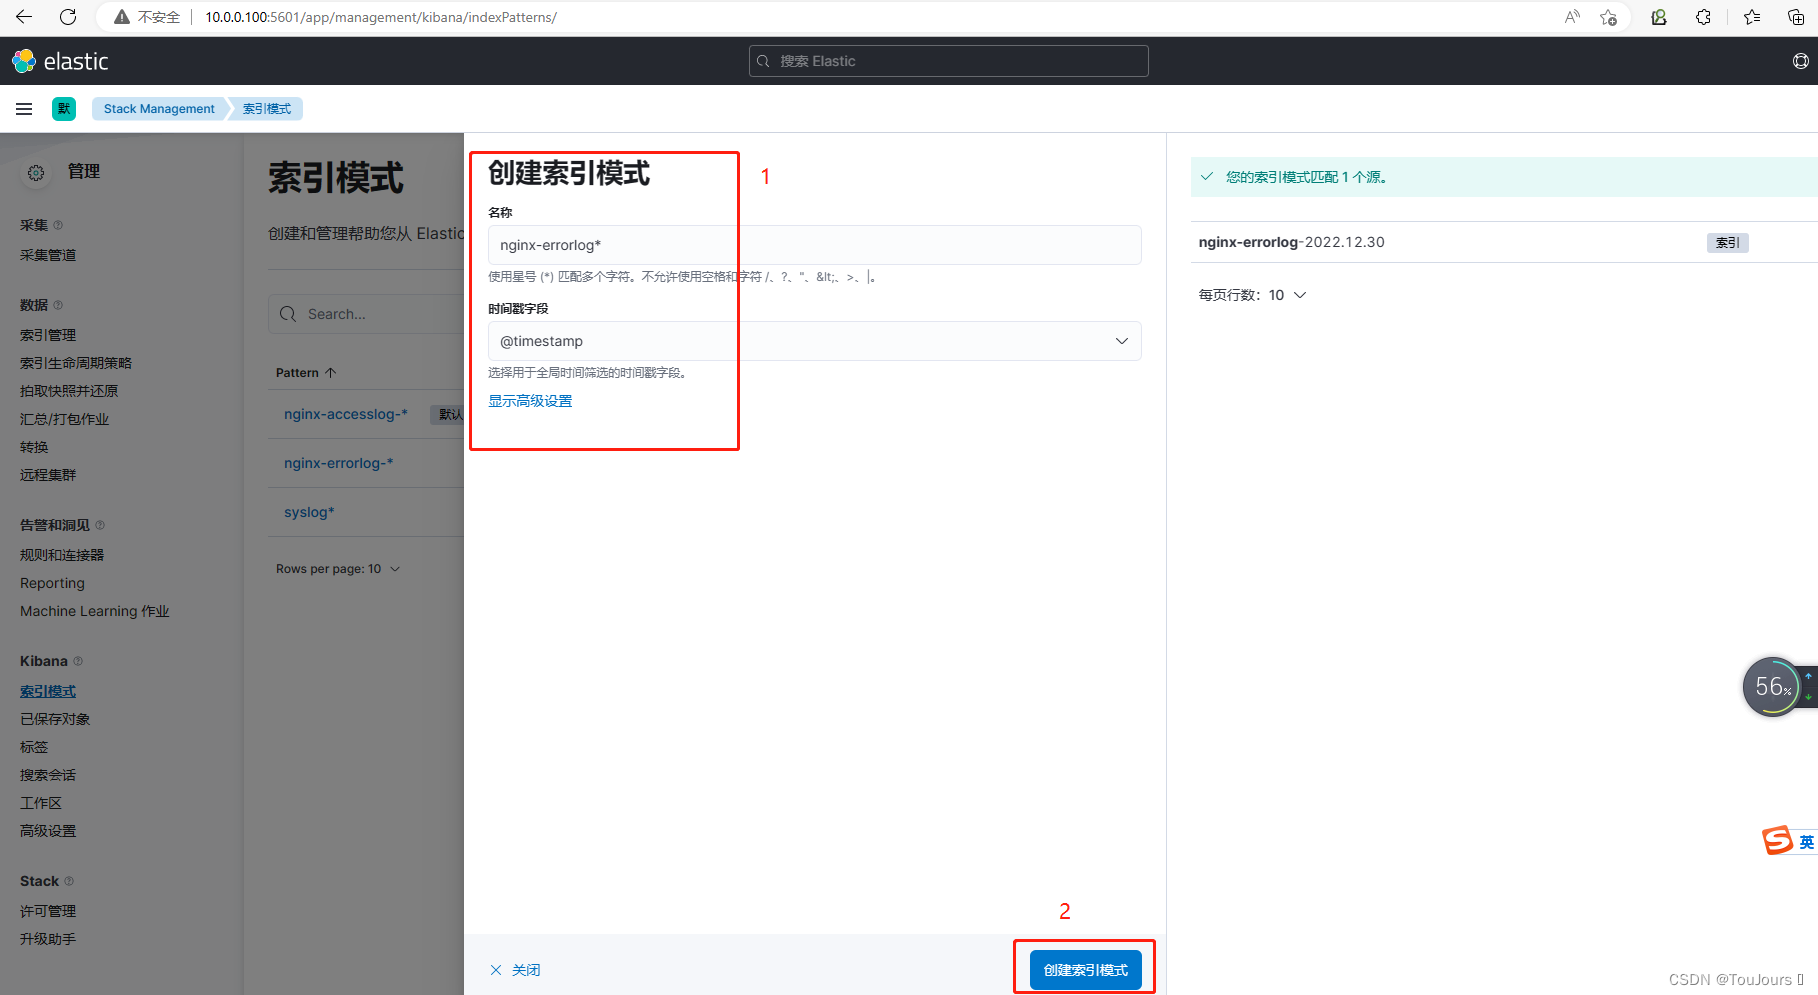
1.7.4 创建nginx-errlog索引
- 索引名称: nginx-errlog-*,时间戳字段:@timestamp,然后点下面的创建索引模式
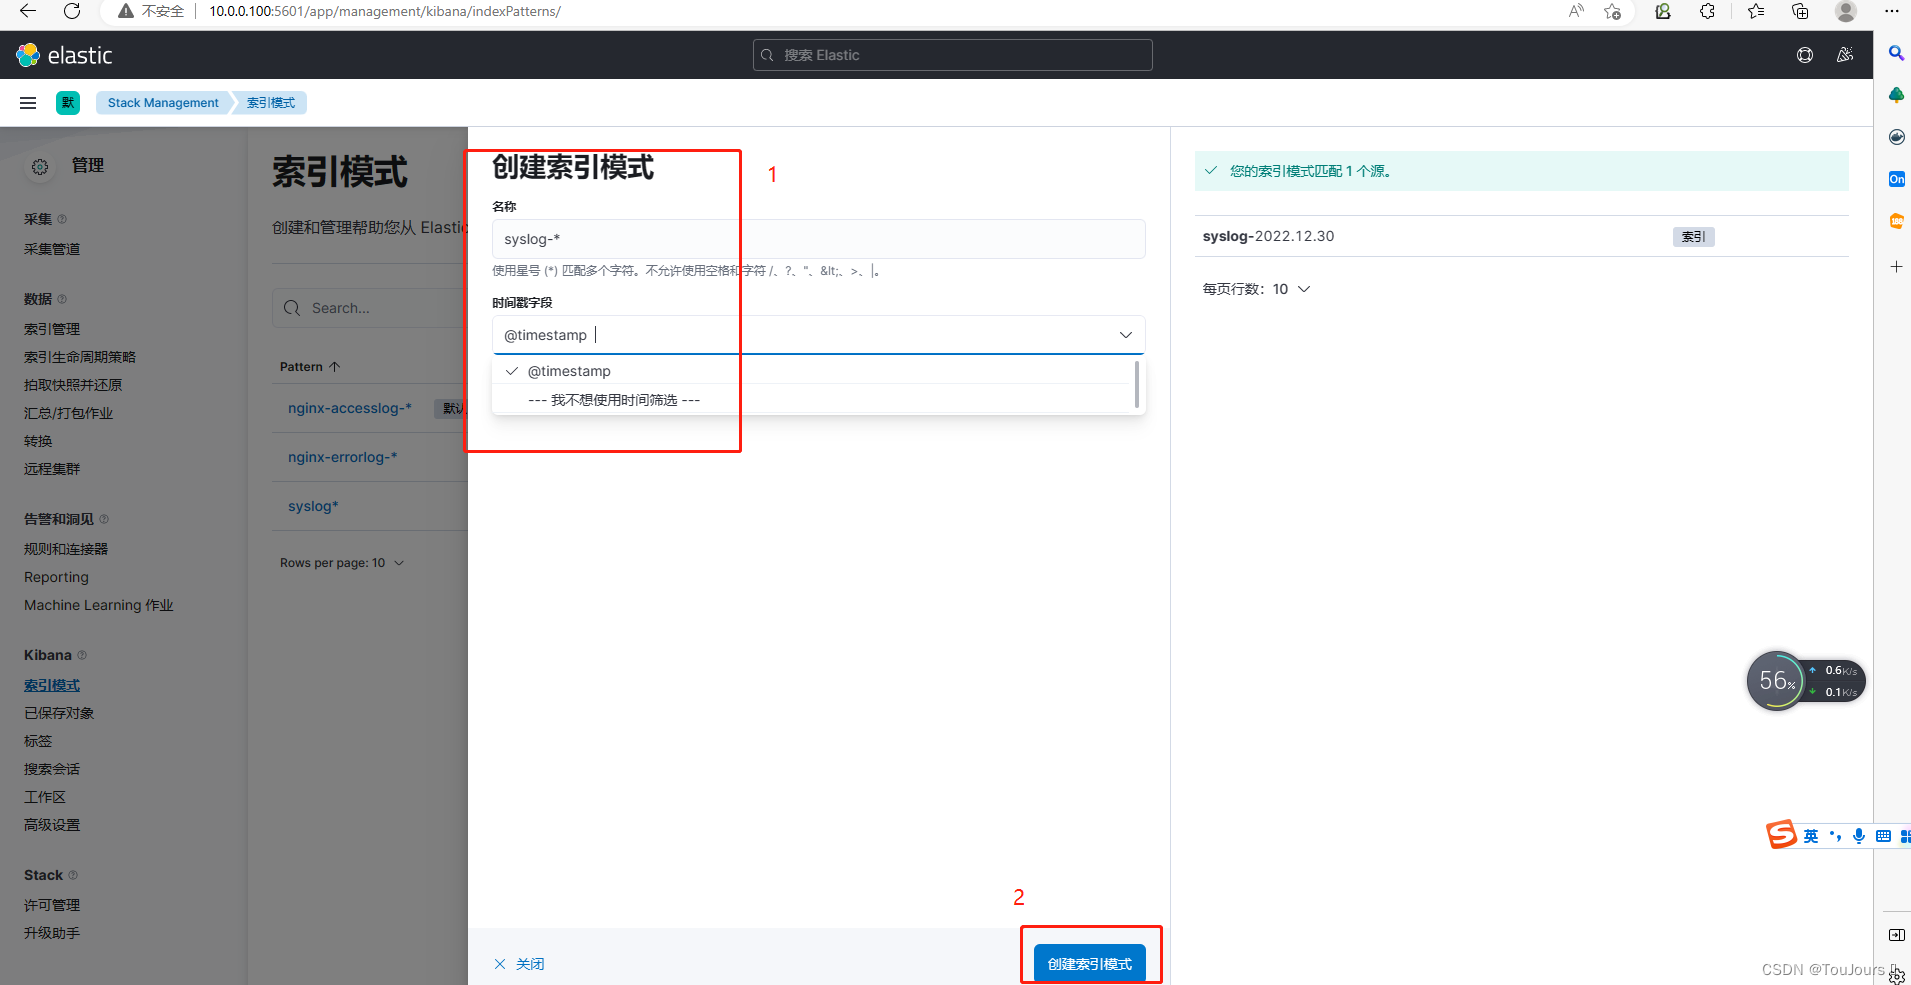
1.7.5 创建syslog索引
- 索引名称: syslog*,时间戳字段:@timestamp,然后点下面的创建索引模式
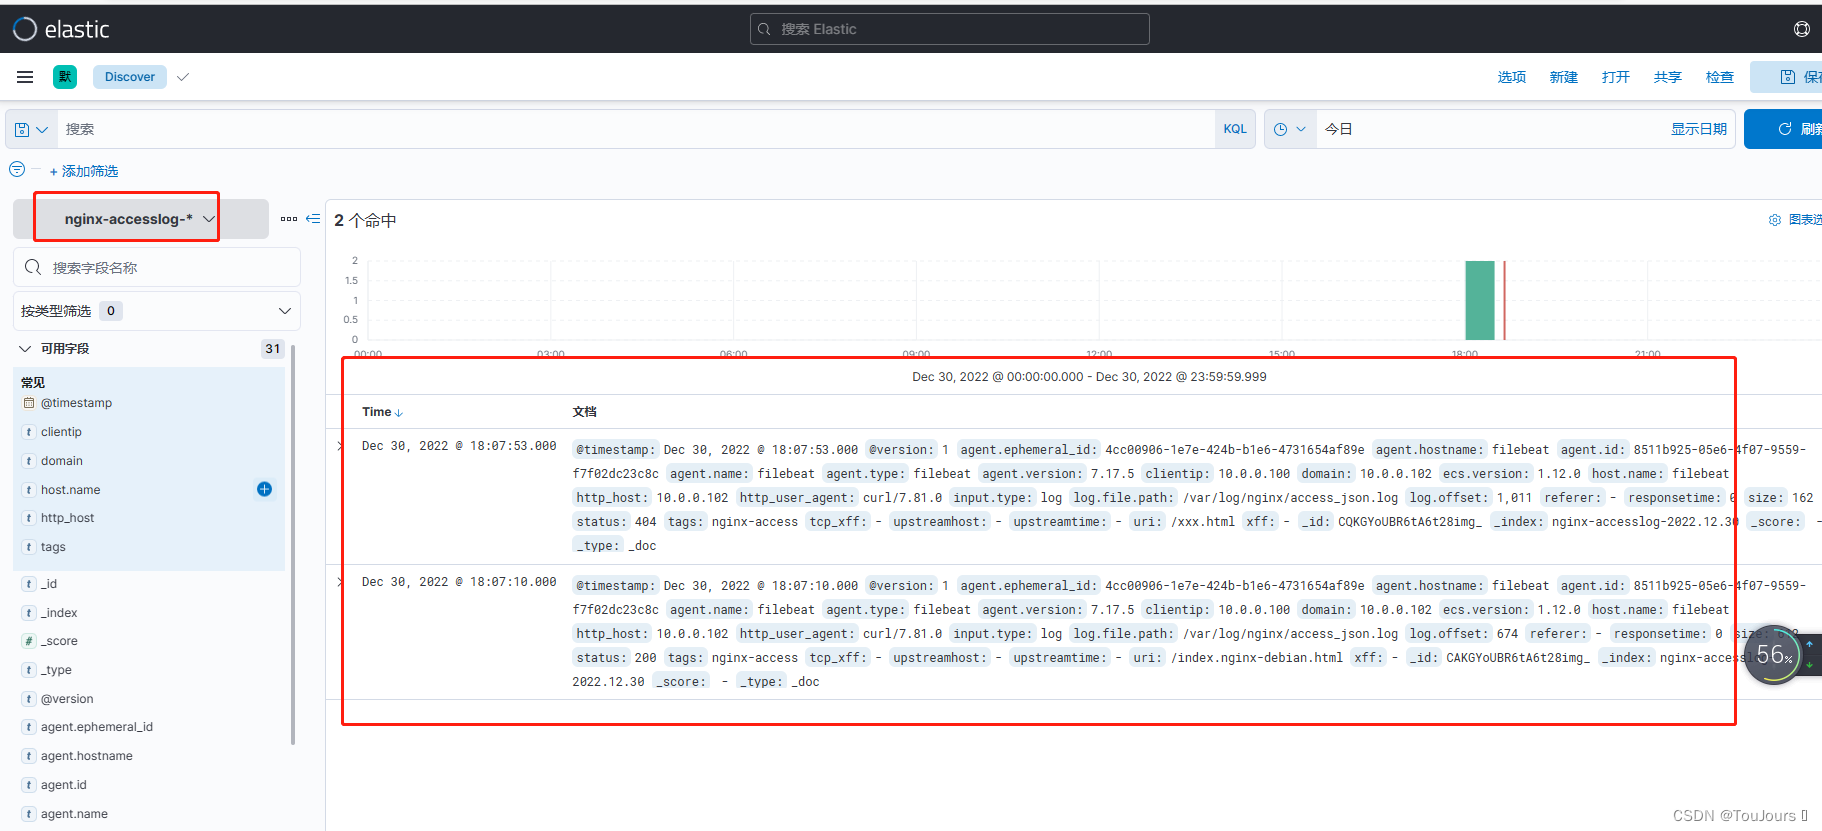
1.7.6 点击左上角三个横杠,选择Analytics下的Discover查看索引
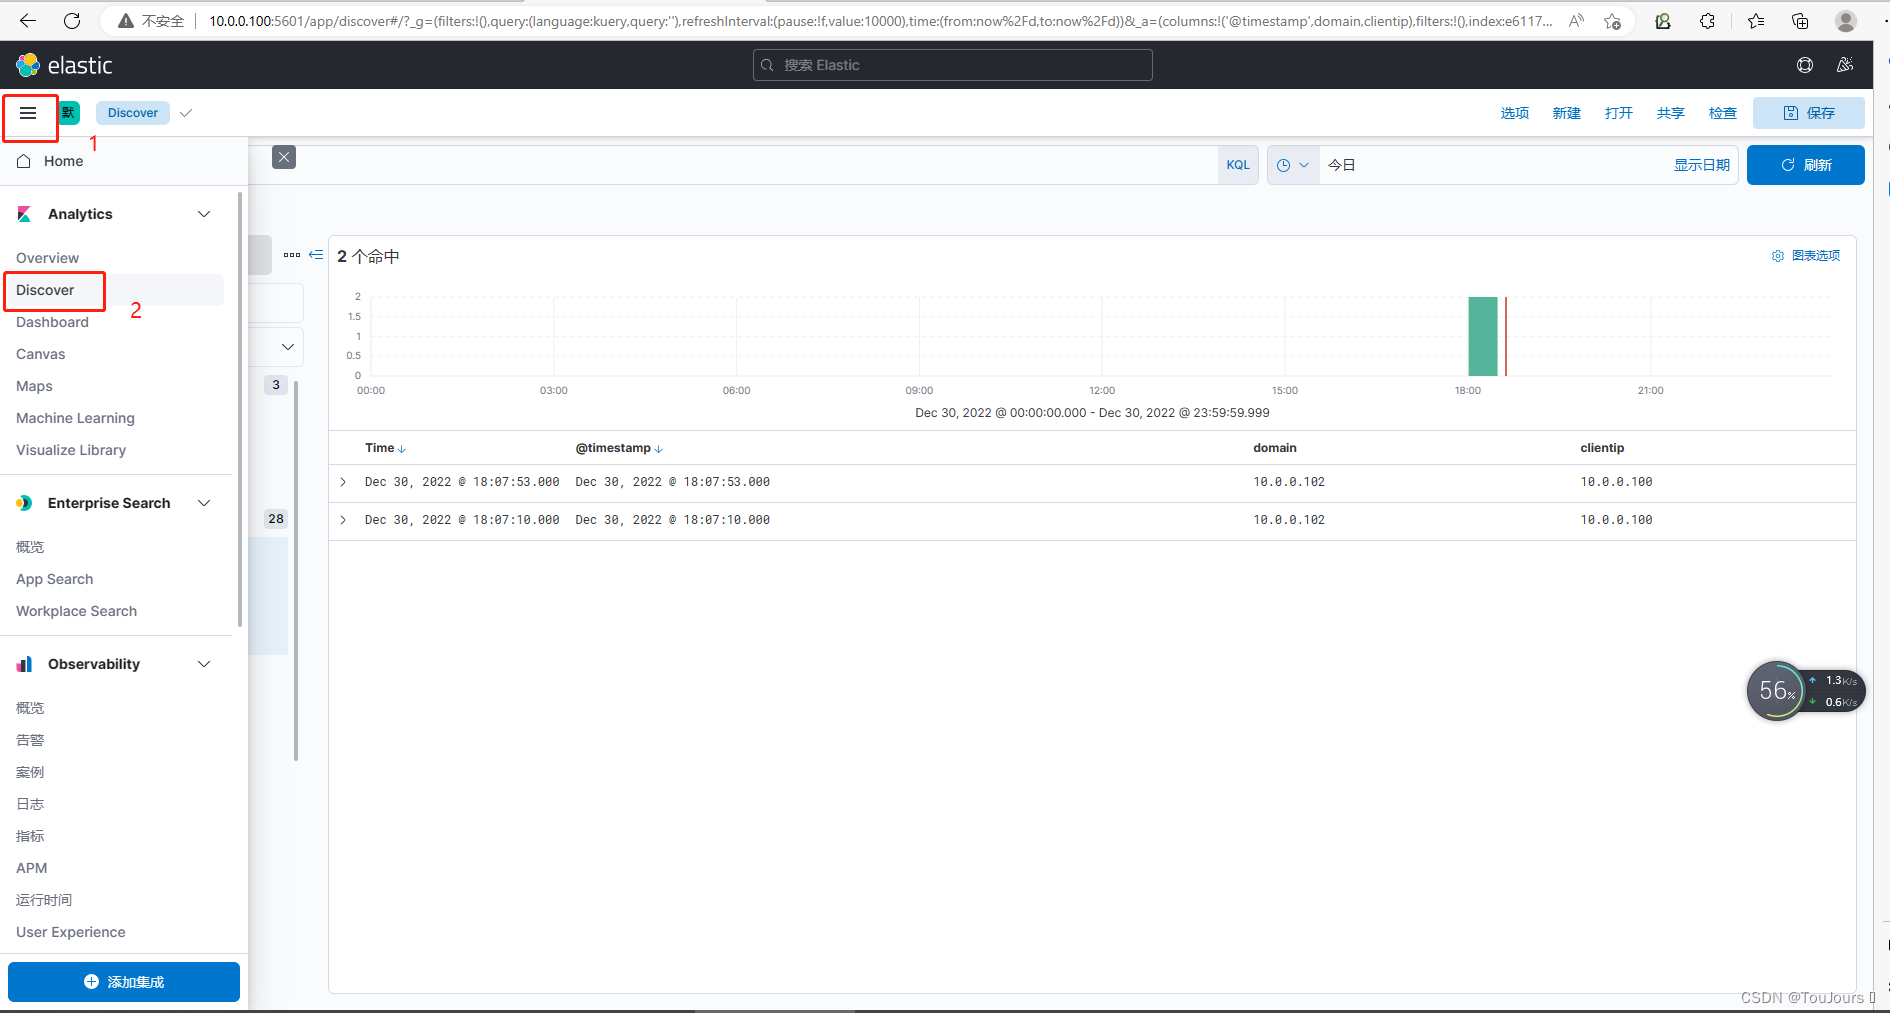
1.7.7 每个索引选择查看
- nginx-accesslog-*索引
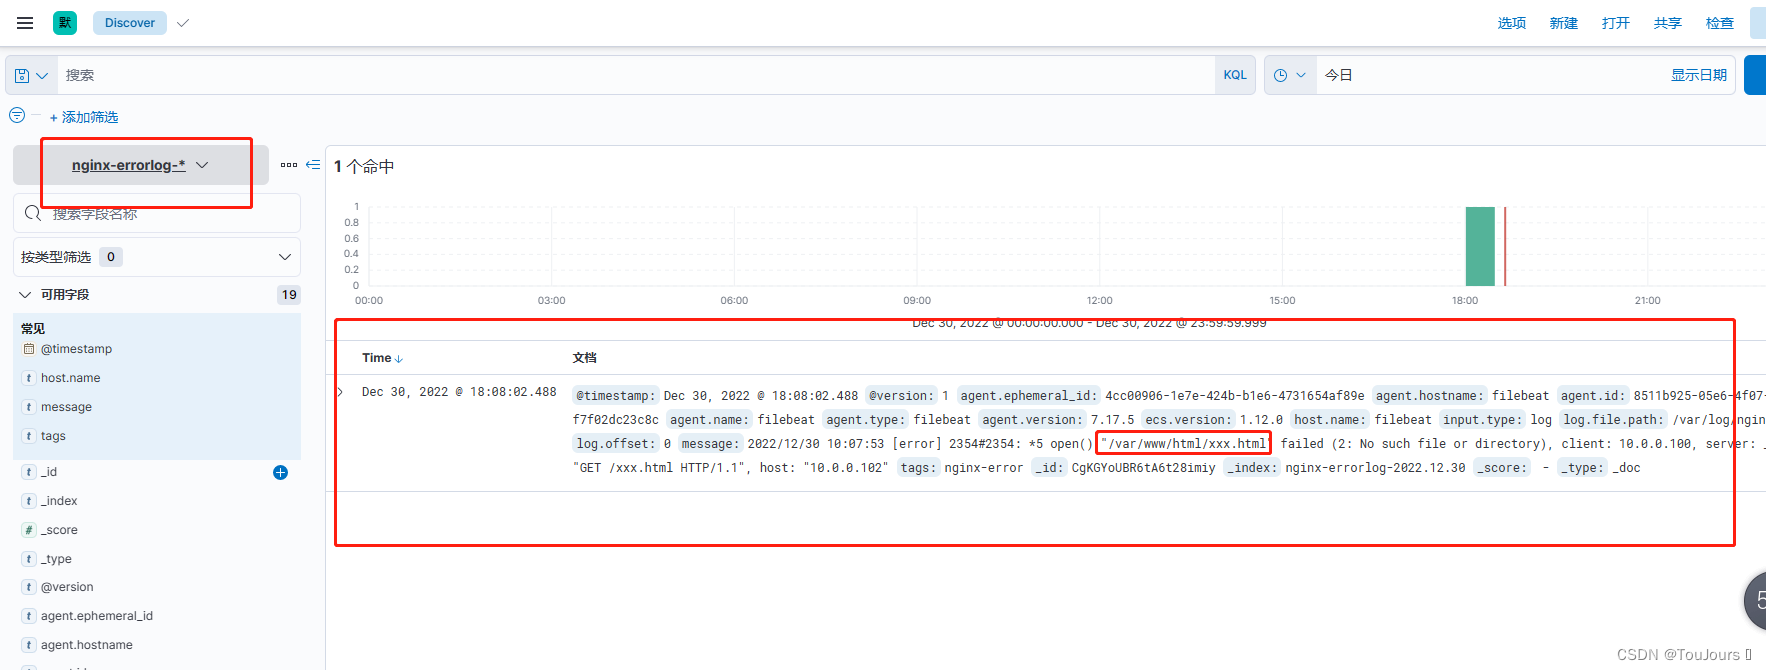
- nginx-errlog-*索引
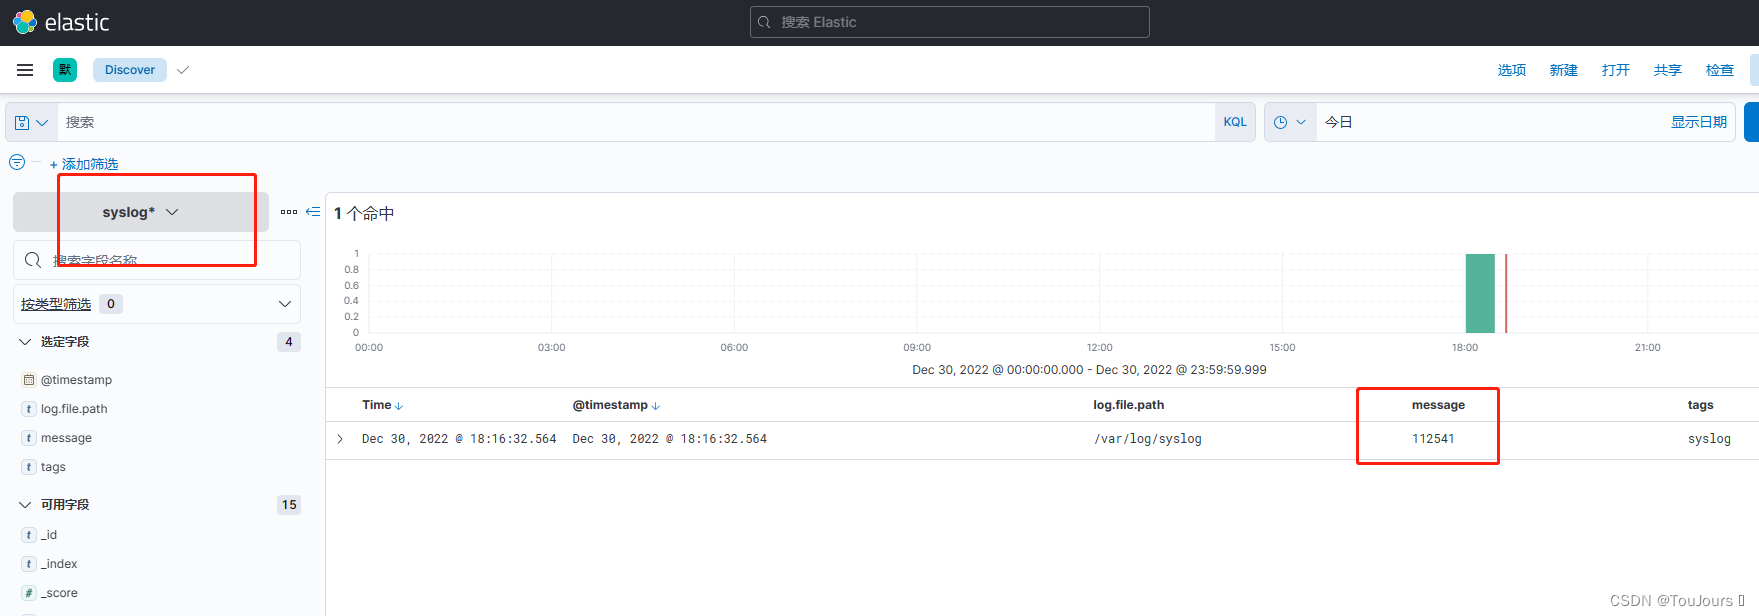
- syslog*索引


 1286
1286


 被折叠的 条评论
为什么被折叠?
被折叠的 条评论
为什么被折叠?
 到【灌水乐园】发言


