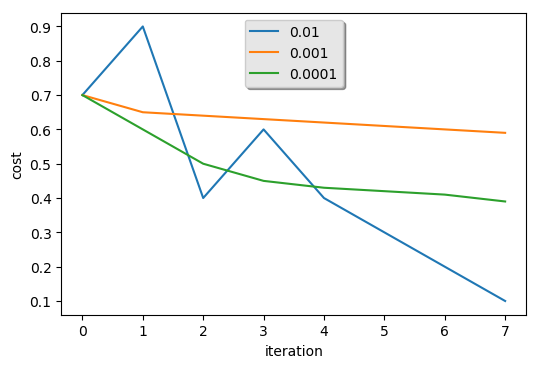
rates = [0.01, 0.001, 0.0001]

models = {}

costs = np.array([[0.7, 0.9, 0.4, 0.6, 0.4, 0.3, 0.2, 0.1],
                  [0.7, 0.65, 0.64, 0.63, 0.62, 0.61, 0.60, 0.59],
                  [0.7, 0.6, 0.5, 0.45, 0.43, 0.42, 0.41, 0.39]
                 ])

j = 0
for i in rates:
    models[str(i)] = costs[j]
    j = j + 1


# plt.plot(models[str(i)])
j = 0
for i in rates:
    plt.plot(models[str(i)], label=str(rates[j]))     # 设置图例(legend)的标签
    j = j + 1

plt.xlabel("iteration")
plt.ylabel("cost")

legend = plt.legend(loc="upper center", shadow=True)  # shadow设置背景为灰色
frame = legend.get_frame()                            # 获得背景
frame.set_facecolor('0.90')                           # 设置背景透明度

plt.show()


 1万+
1万+


 被折叠的 条评论
为什么被折叠?
被折叠的 条评论
为什么被折叠?
 到【灌水乐园】发言


