


下面算法中选取房间数RM作为特征变量,房价PRICE作为目标变量,通过使用Scikit-learn中内置的回归模型对“美国波斯顿房价”数据进行预测,最终给出房价PRICE的预测。
import pandas as pd
import numpy as np
from sklearn.datasets import load_boston
import matplotlib.pyplot as plt
from sklearn.linear_model import LinearRegression
#把数据转化成Pandas的形式,在列尾加上房价PRICE
boston_dataset=datasets.load_boston()
data=pd.DataFrame(boston_dataset.data)
data.columns=boston_dataset.feature_names
data['PRICE']=boston_dataset.target
#取出房间数和房价并转化成矩阵形式
x=data.loc[:,'RM'].as_matrix(column=None)
y=data.loc[:,'PRICE'].as_matrix(column=None)
#进行矩阵的转置
x=np.array([x]).T
y=np.array([y]).T
#训练线性模型
l=LinearRegression()
l.fit(x,y)
#画图显示
plt.scatter(x,y,s=10,alpha=0.3,c='green')
plt.plot(x,l.predict(x),c='blue',linewidth='1')
plt.xlabel("Number of Rooms")
plt.ylabel("House Price")
plt.show()
from sklearn.datasets import load_boston报错提示:
ImportError:
`load_boston` has been removed from scikit-learn since version 1.2.
报错原因:
The Boston housing prices dataset has an ethical problem: as
investigated in [1], the authors of this dataset engineered a
non-invertible variable "B" assuming that racial self-segregation had a
positive impact on house prices [2]. Furthermore the goal of the
research that led to the creation of this dataset was to study the
impact of air quality but it did not give adequate demonstration of the
validity of this assumption.
因为数据集涉及种族问题,所以在sklearn 1.2版本中被移除。
解决方法:
1.报错地方已提示:
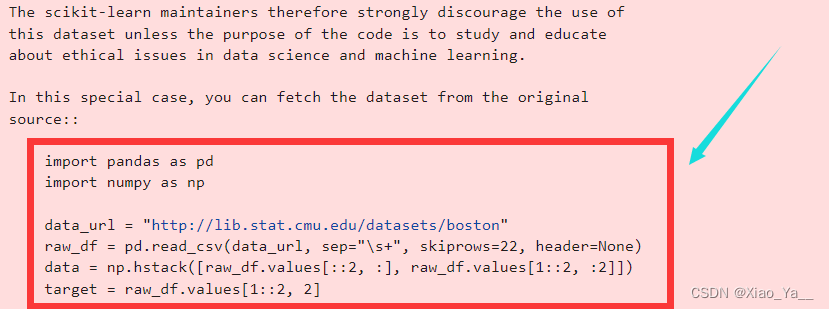
import numpy as np
import pandas as pd
data_url = "http://lib.stat.cmu.edu/datasets/boston"
raw_df = pd.read_csv(data_url, sep=r"\s+", skiprows=22, header=None)
data = np.hstack([raw_df.values[::2, :], raw_df.values[1::2, :2]])
target = raw_df.values[1::2, 2]
数据集中14个属性的描述:
1- CRIM     犯罪率;per capita crime rate by town
2- ZN       proportion of residential land zoned for lots over 25,000 sq.ft.
3- INDUS    非零售商业用地占比;proportion of non-retail business acres per town
4- CHAS     是否临Charles河;Charles River dummy variable (= 1 if tract bounds river; 0 otherwise)
5- NOX      氮氧化物浓度;nitric oxides concentration (parts per 10 million)
6- RM       房屋房间数;average number of rooms per dwelling
7- AGE      房屋年龄;proportion of owner-occupied units built prior to 1940
8- DIS      和就业中心的距离;weighted distances to five Boston employment centres
9- RAD      是否容易上高速路;index of accessibility to radial highways
10- TAX      税率;full-value property-tax rate per $10,000
11- PTRATIO  学生人数比老师人数;pupil-teacher ratio by town
12- B        城镇黑人比例计算的统计值;1000(Bk - 0.63)^2 where Bk is the proportion of black people by town
13- LSTAT    低收入人群比例;% lower status of the population
14- MEDV     房价中位数;Median value of owner-occupied homes in $1000's
具体实现代码如下:
# 导入必要的库
import numpy as np
import pandas as pd
import matplotlib.pyplot as plt
#from sklearn.datasets import load_boston
from sklearn.linear_model import LinearRegression
# 数据来源
data_url = "http://lib.stat.cmu.edu/datasets/boston"
# 加载波士顿房屋数据集
# 用pandas读csv文件 跳过了22行,中间间隔任意长度相同字符
raw_df = pd.read_csv(data_url, sep="\s+", skiprows=22,header=None)
data= np.hstack([raw_df.values[::2, :], raw_df.values[1::2, :2]])
boston=pd.DataFrame(data,columns=["CRIM","ZN","INDUS","CHAS","NOX","RM","AGE","DIS","RAD","TAX","PTRATIO","B","LSTAT"])
print(boston)
target_df=raw_df.values[1::2, 2]
target = pd.DataFrame(target_df,columns=["PRICE"])
print(target)

#################################################################
#取出房间数和房价并转化成矩阵形式
x=boston.loc[:,'RM'].values
y=target.loc[:,'PRICE'].values
#进行矩阵的转置
x=np.array([x]).T
y=np.array([y]).T
#训练线性模型
l=LinearRegression()
l.fit(x,y)
#画图显示
plt.scatter(x,y,s=10,alpha=0.3,c='green')
plt.plot(x,l.predict(x),c='blue',linewidth='1')
plt.xlabel("Number of Rooms")
plt.ylabel("House Price")
plt.show()
运行结果:
 CRIM    ZN  INDUS  CHAS    NOX     RM   AGE     DIS  RAD    TAX  \
0    0.00632  18.0   2.31   0.0  0.538  6.575  65.2  4.0900  1.0  296.0
1    0.02731   0.0   7.07   0.0  0.469  6.421  78.9  4.9671  2.0  242.0
2    0.02729   0.0   7.07   0.0  0.469  7.185  61.1  4.9671  2.0  242.0
3    0.03237   0.0   2.18   0.0  0.458  6.998  45.8  6.0622  3.0  222.0
4    0.06905   0.0   2.18   0.0  0.458  7.147  54.2  6.0622  3.0  222.0
..       ...   ...    ...   ...    ...    ...   ...     ...  ...    ...
501  0.06263   0.0  11.93   0.0  0.573  6.593  69.1  2.4786  1.0  273.0
502  0.04527   0.0  11.93   0.0  0.573  6.120  76.7  2.2875  1.0  273.0
503  0.06076   0.0  11.93   0.0  0.573  6.976  91.0  2.1675  1.0  273.0
504  0.10959   0.0  11.93   0.0  0.573  6.794  89.3  2.3889  1.0  273.0
505  0.04741   0.0  11.93   0.0  0.573  6.030  80.8  2.5050  1.0  273.0

     PTRATIO       B  LSTAT
0       15.3  396.90   4.98
1       17.8  396.90   9.14
2       17.8  392.83   4.03
3       18.7  394.63   2.94
4       18.7  396.90   5.33
..       ...     ...    ...
501     21.0  391.99   9.67
502     21.0  396.90   9.08
503     21.0  396.90   5.64
504     21.0  393.45   6.48
505     21.0  396.90   7.88

[506 rows x 13 columns]
     PRICE
0     24.0
1     21.6
2     34.7
3     33.4
4     36.2
..     ...
501   22.4
502   20.6
503   23.9
504   22.0
505   11.9

[506 rows x 1 columns]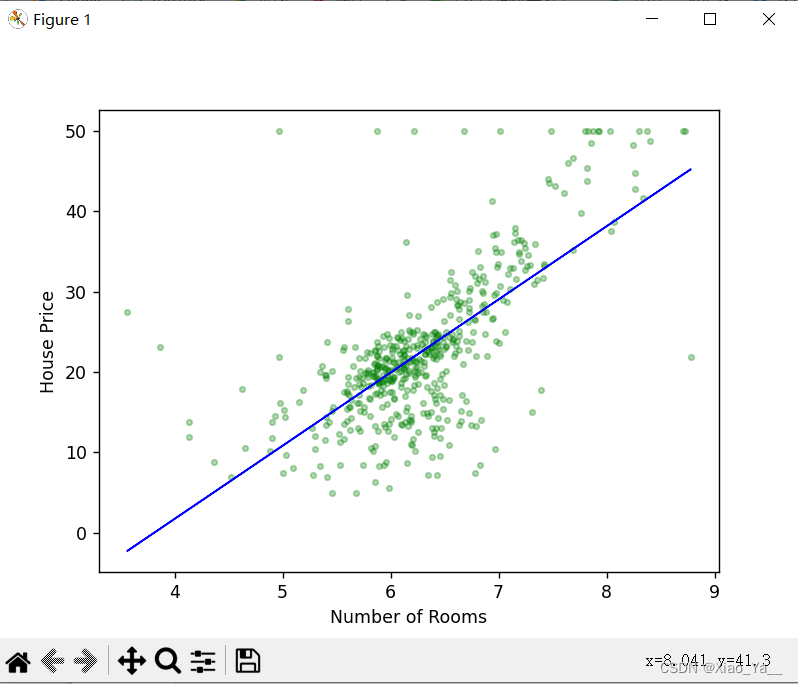
2.直接选择下了波士顿数据集,然后读取,再操作。
boston = pd.read_csv('D:/FATE/HFL/DATASET/boston/boston_house_prices.csv')
()里换成下载好的数据集地址


 9万+
9万+

 被折叠的 条评论
为什么被折叠?
被折叠的 条评论
为什么被折叠?
 到【灌水乐园】发言


