


 本文详细介绍了sysbench这款跨平台数据库负载测试工具,包括其支持的测试类型(如CPU、磁盘IO、内存、线程和数据库性能),源码编译与命令行安装步骤,以及重要参数的详细解释和实战示例,为读者提供了全面的使用指南。
一、概述
sysbench是一个模块化的、跨平台、多线程基准测试工具,主要用于评估测试各种不同系统参数下的数据库负载情况,它主要包括以下几种方式的测试:磁盘io性能、数据库性能、内存分配及传输速度等,详细的介绍见:gitee.com/cn-loongson…
它主要包括以下几种方式的测试:
1、cpu性能。
2、磁盘io性能
3、调度程序性能
4、内存分配及传输速度
5、POSIX线程性能
6、数据库性能(OLTP基准测试)
目前sysbench主要支持 MySQL,pgsql,oracle 这3种数据库
二、安装
2.1、源码编译安装
源码编译安装请参考如下命令:
bash
复制代码
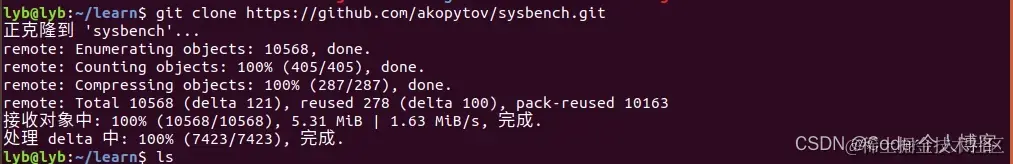
// 下载源码
git clone https://github.com/akopytov/sysbench.git
 当前有0.4、0.5、1.0三个版本,我们通过如下命令来切换到1.0版本:
bash
复制代码
git checkout 1.0
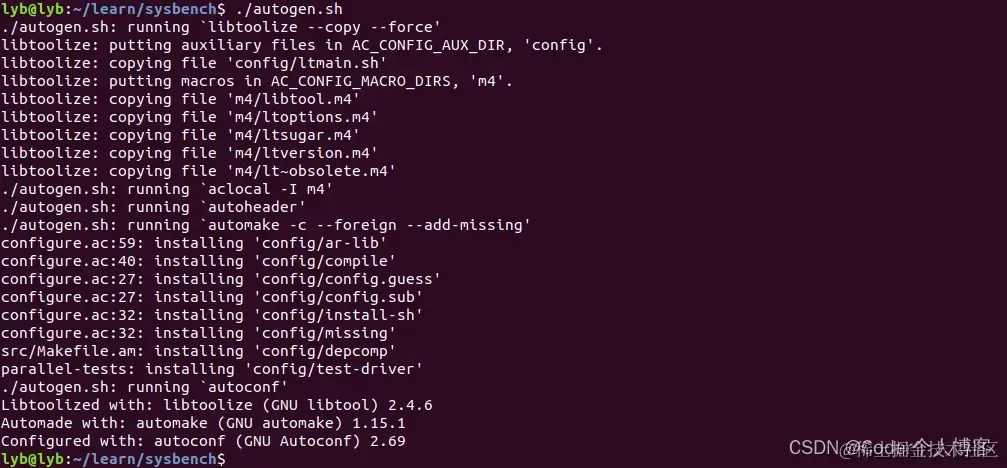
 请执行如下命令来确认当前环境是否安装了依赖工具:
bash
复制代码
./autogen.sh
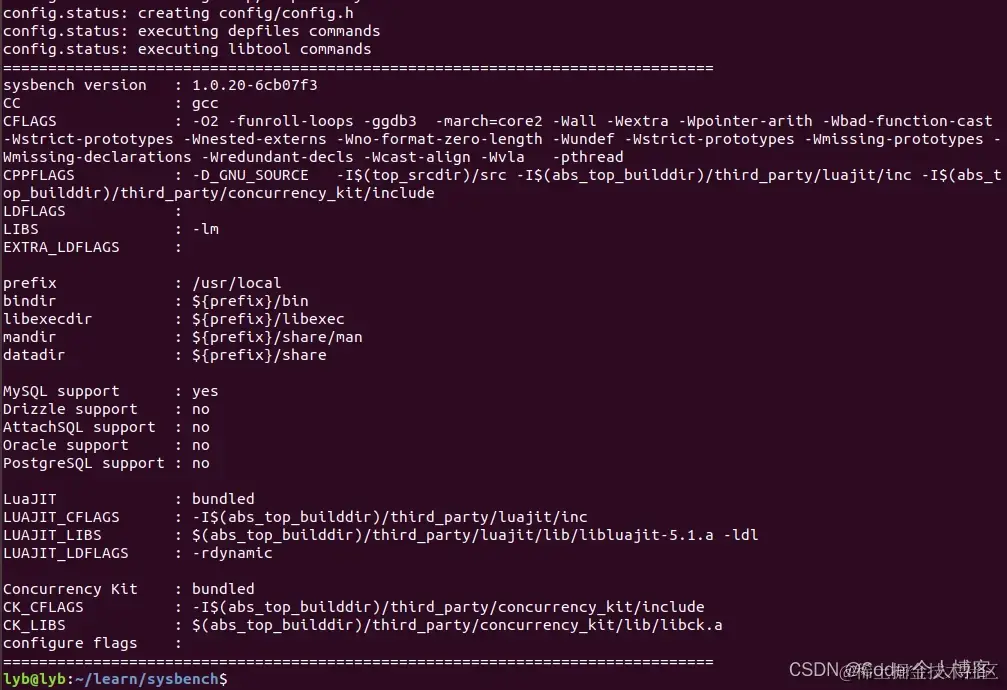
 执行如下命令来进行配置编译选项:
bash
复制代码
./configure
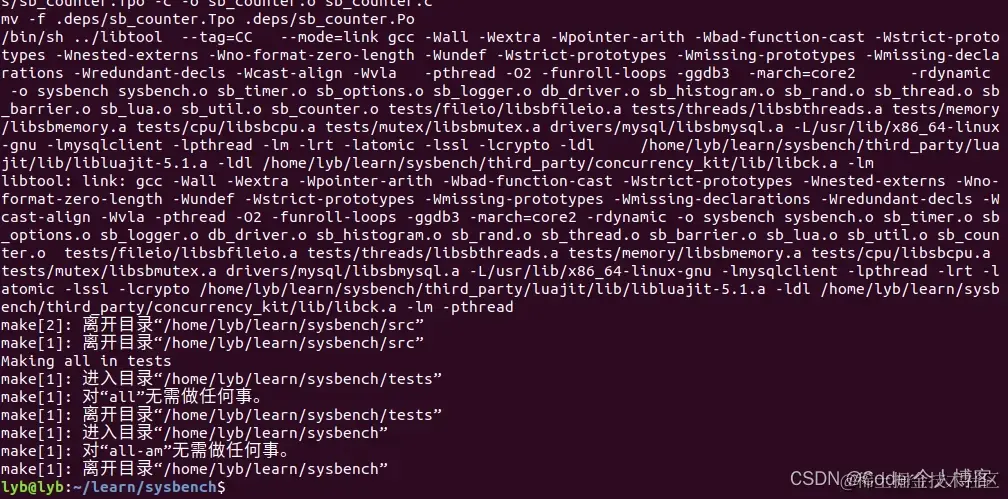
 编译源码请参考如下命令:
bash
复制代码
make
 按照请参考如下命令:
bash
复制代码
sudo make install
安装命令执行结果如下: 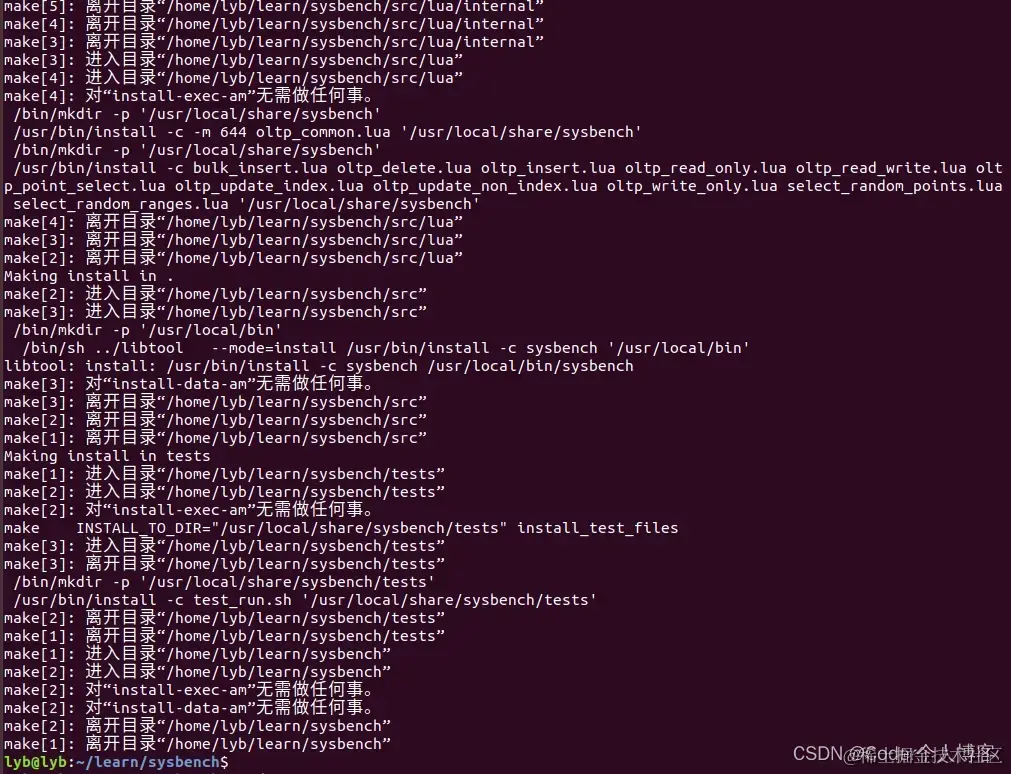
2.2、命令行安装
Ubuntu下执行如下命令进行安装:
bash
复制代码
curl -s https://packagecloud.io/install/repositories/akopytov/sysbench/script.deb.sh | sudo bash
sudo apt -y install sysbench
命令行安装执行结果如下: 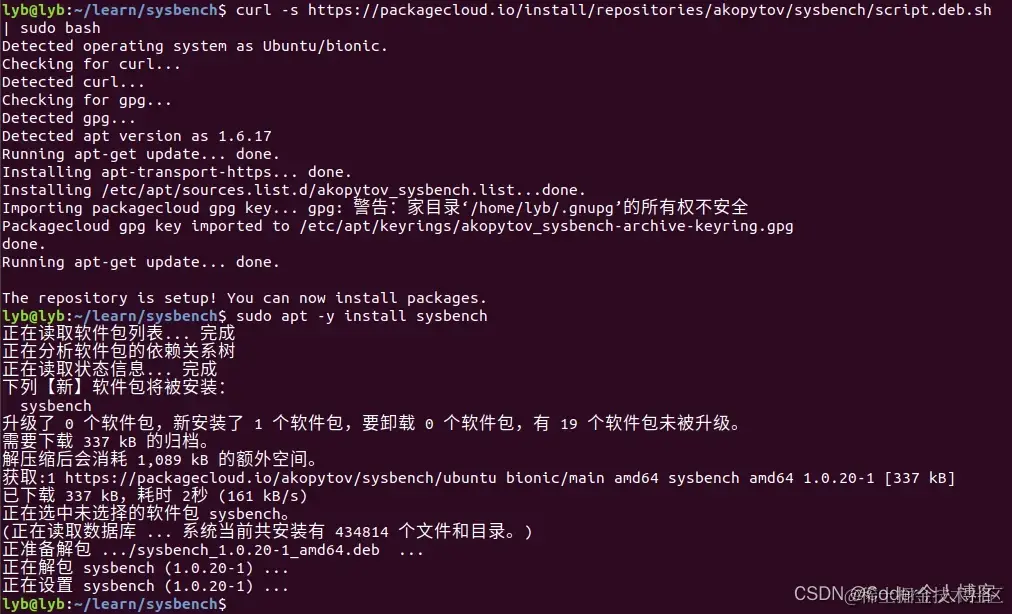
2.3、安装确认
执行如下命令来确认sysbench是否安装成功:
bash
复制代码
sysbench --version
cpp
复制代码
lyb@lyb:~/learn/sysbench$ sysbench --help
Usage:
  sysbench [options]... [testname] [command]

Commands implemented by most tests: prepare run cleanup help

General options:
  --threads=N                     number of threads to use [1]
  --events=N                      limit for total number of events [0]
  --time=N                        limit for total execution time in seconds [10]
  --forced-shutdown=STRING        number of seconds to wait after the --time limit before forcing shutdown, or 'off' to disable [off]
  --thread-stack-size=SIZE        size of stack per thread [64K]
  --rate=N                        average transactions rate. 0 for unlimited rate [0]
  --report-interval=N             periodically report intermediate statistics with a specified interval in seconds. 0 disables intermediate reports [0]
  --report-checkpoints=[LIST,...] dump full statistics and reset all counters at specified points in time. The argument is a list of comma-separated values representing the amount of time in seconds elapsed from start of test when report checkpoint(s) must be performed. Report checkpoints are off by default. []
  --debug[=on|off]                print more debugging info [off]
  --validate[=on|off]             perform validation checks where possible [off]
  --help[=on|off]                 print help and exit [off]
  --version[=on|off]              print version and exit [off]
  --config-file=FILENAME          File containing command line options
  --tx-rate=N                     deprecated alias for --rate [0]
  --max-requests=N                deprecated alias for --events [0]
  --max-time=N                    deprecated alias for --time [0]
  --num-threads=N                 deprecated alias for --threads [1]

Pseudo-Random Numbers Generator options:
  --rand-type=STRING random numbers distribution {uniform,gaussian,special,pareto} [special]
  --rand-spec-iter=N number of iterations used for numbers generation [12]
  --rand-spec-pct=N  percentage of values to be treated as 'special' (for special distribution) [1]
  --rand-spec-res=N  percentage of 'special' values to use (for special distribution) [75]
  --rand-seed=N      seed for random number generator. When 0, the current time is used as a RNG seed. [0]
  --rand-pareto-h=N  parameter h for pareto distribution [0.2]

Log options:
  --verbosity=N verbosity level {5 - debug, 0 - only critical messages} [3]

  --percentile=N       percentile to calculate in latency statistics (1-100). Use the special value of 0 to disable percentile calculations [95]
  --histogram[=on|off] print latency histogram in report [off]

General database options:

  --db-driver=STRING  specifies database driver to use ('help' to get list of available drivers) [mysql]
  --db-ps-mode=STRING prepared statements usage mode {auto, disable} [auto]
  --db-debug[=on|off] print database-specific debug information [off]


Compiled-in database drivers:
  mysql - MySQL driver

mysql options:
  --mysql-host=[LIST,...]          MySQL server host [localhost]
  --mysql-port=[LIST,...]          MySQL server port [3306]
  --mysql-socket=[LIST,...]        MySQL socket
  --mysql-user=STRING              MySQL user [sbtest]
  --mysql-password=STRING          MySQL password []
  --mysql-db=STRING                MySQL database name [sbtest]
  --mysql-ssl[=on|off]             use SSL connections, if available in the client library [off]
  --mysql-ssl-cipher=STRING        use specific cipher for SSL connections []
  --mysql-compression[=on|off]     use compression, if available in the client library [off]
  --mysql-debug[=on|off]           trace all client library calls [off]
  --mysql-ignore-errors=[LIST,...] list of errors to ignore, or "all" [1213,1020,1205]
  --mysql-dry-run[=on|off]         Dry run, pretend that all MySQL client API calls are successful without executing them [off]

Compiled-in tests:
  fileio - File I/O test
  cpu - CPU performance test
  memory - Memory functions speed test
  threads - Threads subsystem performance test
  mutex - Mutex performance test

See 'sysbench <testname> help' for a list of options for each test.
lyb@lyb:~/learn/sysbench$
三、重要参数详解
3.1、查询支持的参数
执行如下命令来确认sysbench是否安装成功: 
3.2、重要参数说明
| 选项 | 默认值 | 描述 |
|---|---|---|
| –threads | 创建1的工作线程总数 | 1 |
| –events | 请求总数的限制。0(默认值)表示没有限制 | 0 |
| –time | 总执行时间限制,以秒为单位。0表示不限制 | 10 |
| –warmup-time | 在启用统计信息运行实际基准测试之前,在禁用统计信息的情况下执行事件这么多秒。当您希望从统计数据中排除基准测试运行的初始阶段时,这非常有用。在许多基准测试中,初始时间并不具有代表性,因为CPU/数据库/页面和其他缓存需要一些时间来预热 | 0 |
| –rate | 这个数字指定了所有线程平均每秒钟应该执行多少事件(事务)。0(默认)表示无限速率,即事件以尽可能快的速度执行 | 0 |
| –thread-init-timeout | 工作线程初始化的等待时间,单位为秒 | 30 |
| –thread-stack-size | 每个线程的堆栈大小 | 32k |
| –report-interval | 以间隔时间为秒定期上报中间统计信息。注意,此选项生成的统计信息是按间隔计算的,而不是累积的。0禁用中间报告 | 0 |
| –debugl | 打印更多的调试信息 | off |
| –validate | 在可能的情况下对测试结果进行验证 | off |
| –help | 打印通用语法或指定测试的帮助并退出 | off |
| –verbosity | 详细级别(0 -只有关键消息,5 -调试) | 4 |
| –percentile | sysbench测量所有已处理请求的执行时间,以显示最小、平均和最大执行时间等统计信息。对于大多数基准测试,知道一个匹配某个百分比的请求执行时间值也是有用的(例如,95%百分比意味着我们应该放弃最长请求的5%,并从剩余的请求中选择最大值)。此选项允许指定查询执行次数的百分位数用于计数 | 95 |
| –luajit-cmd | 执行一个LuaJIT控制命令。这个选项相当于luajit -j |
四、实例
4.1、CPU性能测试
使用如下命令进行CPU性能测试:
bash
复制代码
# 开启两个线程,素数上限设置为20000
sysbench cpu --cpu-max-prime=20000 --threads=2 run
执行CPU压测命令结果如下: 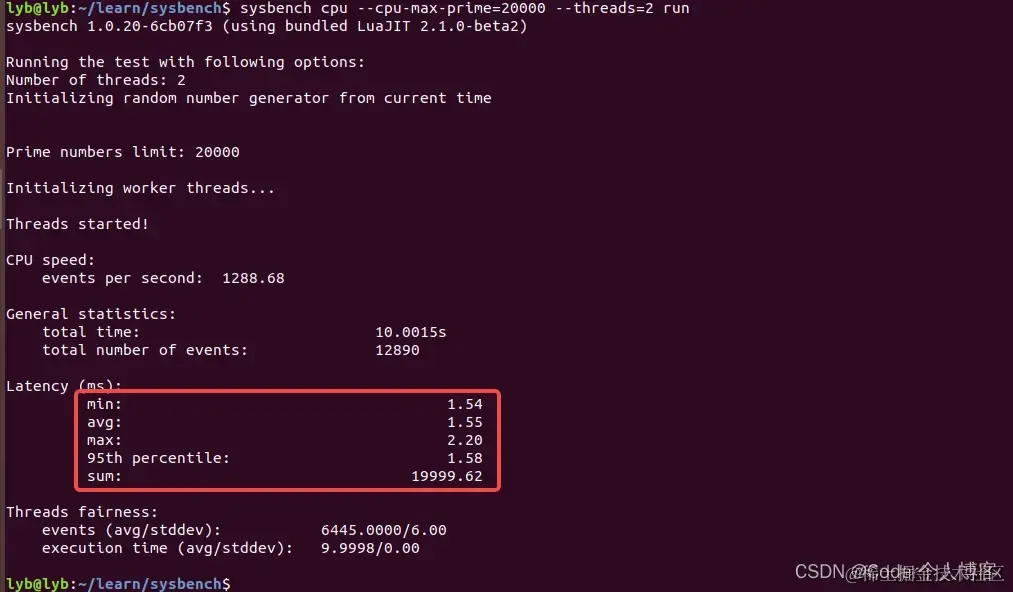
4.2、内存性能测试
使用如下命令进行内存压测:
bash
复制代码
sysbench memory --threads=14 --memory-block-size=16K --memory-total-size=100G --memory-access-mode=seq run
执行内存压测命令结果如下: 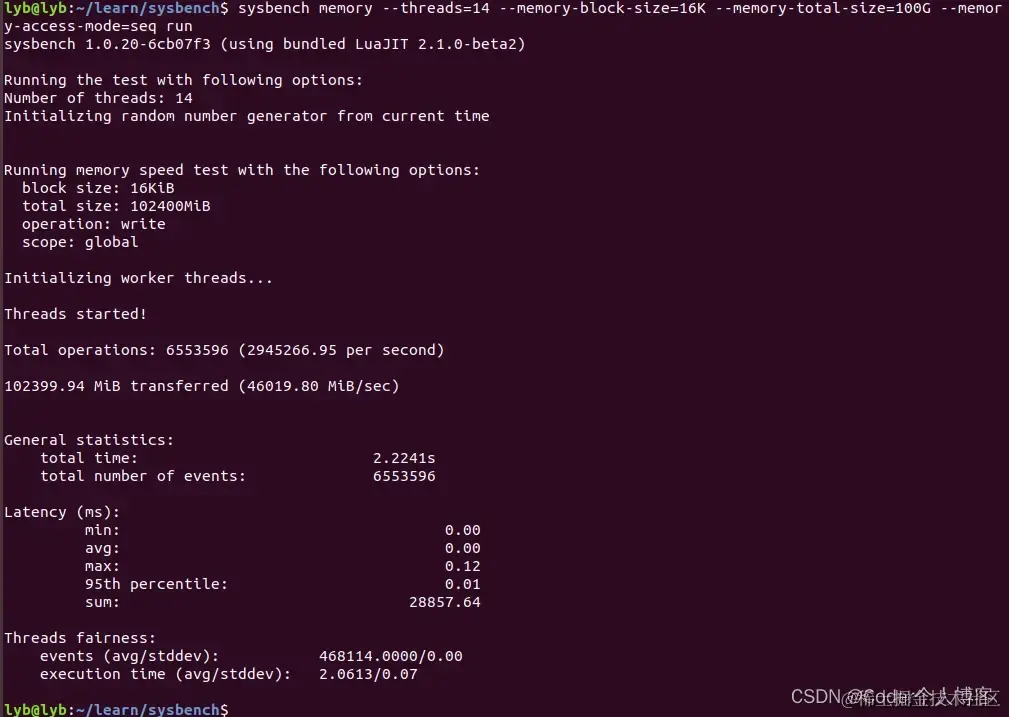
4.3、IO性能测试
使用如下命令进行IO压测:
bash
复制代码
# 1、准备测试数据集,使用prepare命令
sysbench --test=fileio --file-total-size=2G prepare
# 2、混合随机读写测试
sysbench --test=fileio --file-test-mode=rndrw --file-total-size=2G --file-rw-ratio=2 run
# 3、清除测试数据集
sysbench --test=fileio --file-total-size=2G cleanup
执行IO压测命令结果如下: 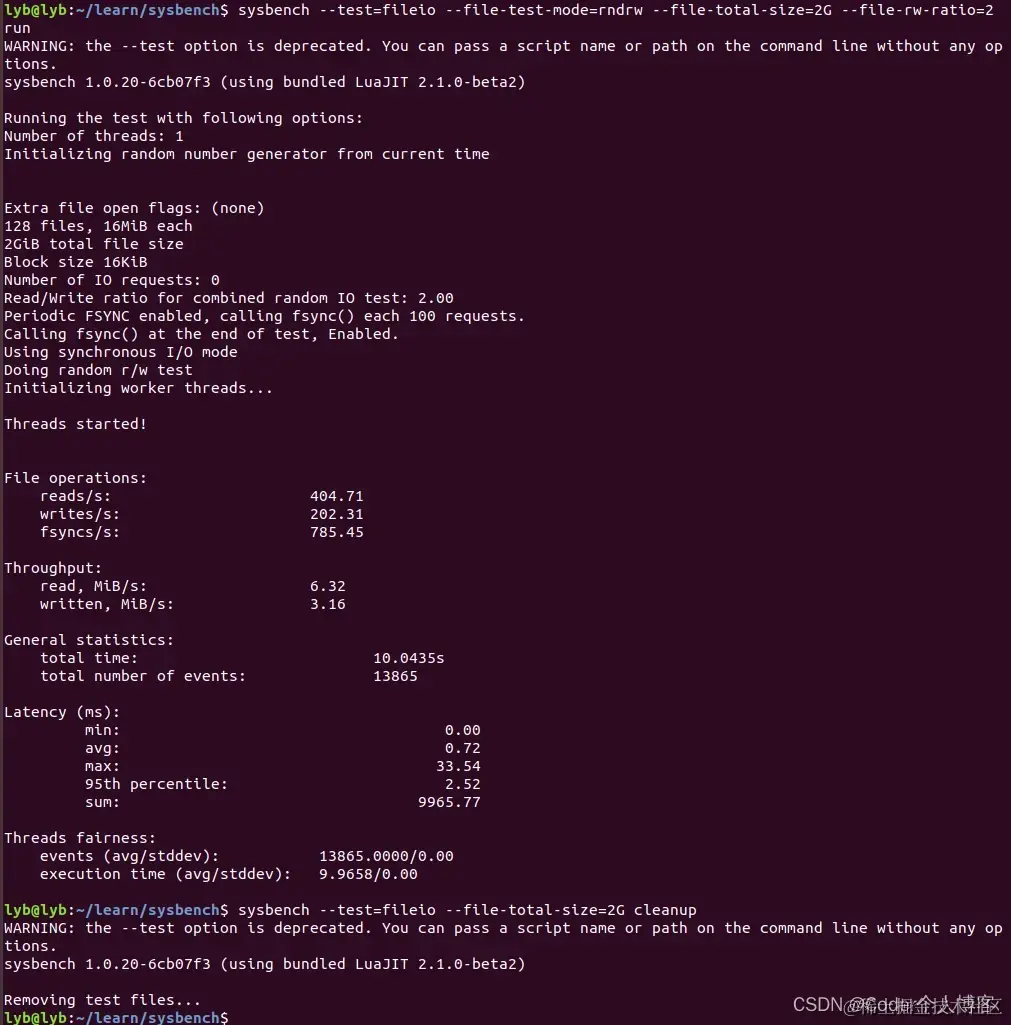
4.4、POSIX线程性能测试
使用如下命令进行POSIX线程性能压测:
bash
复制代码
sysbench --test=threads --num-threads=500 --thread-yields=100 --thread-locks=4 run
执行POSIX线程性能命令结果如下: 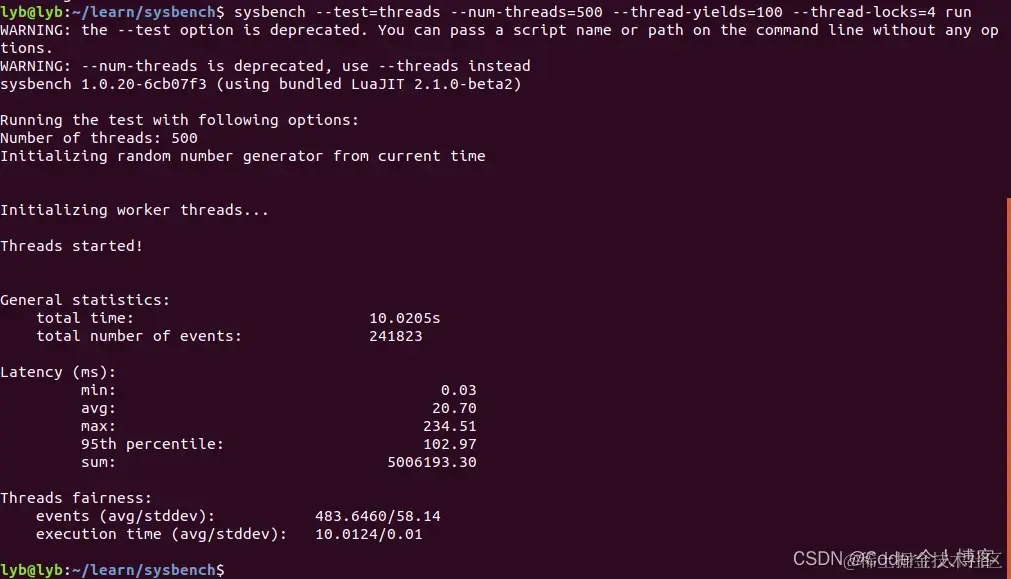
4.5、多线程调度测试
使用如下命令进行多线程调度测试:
bash
复制代码
sysbench mutex --threads=8 --mutex-num=2000 --mutex-locks=10000 --mutex-loops=5000 run
执行进行多线程调度测试命令结果如下: 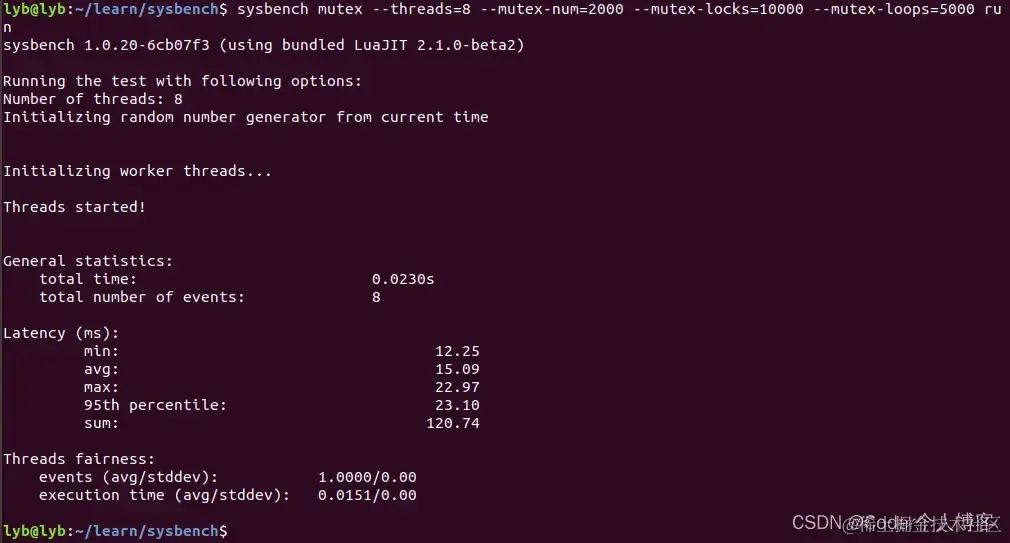
最后
为了帮助大家更好的学习网络安全,小编给大家准备了一份网络安全入门/进阶学习资料,里面的内容都是适合零基础小白的笔记和资料,不懂编程也能听懂、看懂,所有资料共282G,朋友们如果有需要全套网络安全入门+进阶学习资源包,可以点击免费领取(如遇扫码问题,可以在评论区留言领取哦)~
😝有需要的小伙伴,可以点击下方链接免费领取或者V扫描下方二维码免费领取🆓

1️⃣零基础入门
① 学习路线
对于从来没有接触过网络安全的同学,我们帮你准备了详细的学习成长路线图。可以说是最科学最系统的学习路线,大家跟着这个大的方向学习准没问题。
② 路线对应学习视频
同时每个成长路线对应的板块都有配套的视频提供:

因篇幅有限,仅展示部分资料
2️⃣视频配套资料&国内外网安书籍、文档
① 文档和书籍资料
② 黑客技术

因篇幅有限,仅展示部分资料
3️⃣网络安全源码合集+工具包
4️⃣网络安全面试题
5️⃣汇总

所有资料 ⚡️ ,朋友们如果有需要全套 《网络安全入门+进阶学习资源包》,扫码获取~


 被折叠的 条评论
为什么被折叠?
被折叠的 条评论
为什么被折叠?
 到【灌水乐园】发言


