


Codes and Results:
#11.1

import matplotlib.pyplot as plt
import numpy as np

x = np.linspace(0, 2, 100)
y = (np.sin(x - 2))**2 * np.exp(-x*x)
plt.plot(x, y, 'g-', label = 'f(x)')            #scatter plot
#plt.title('f(x) = (sin(x-2))^2 * e^(-x^2)')
plt.title('$f(x) = sin^2(x-2) * e^{-x^2}$')
plt.xlabel('x')
plt.ylabel('y')
plt.legend()

plt.show()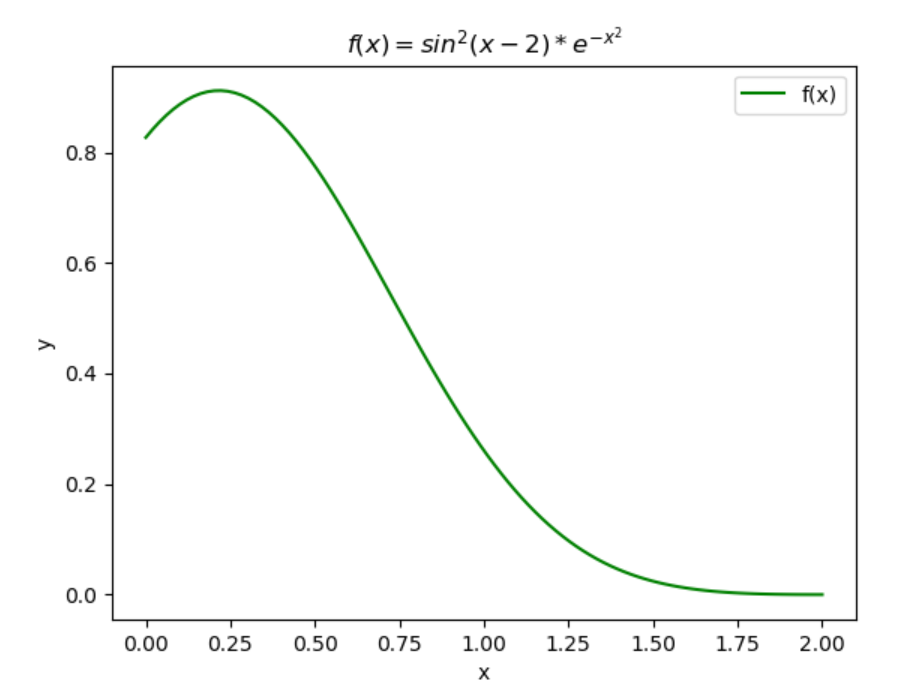
#11.2
import matplotlib.pyplot as plt
import numpy as np

var = np.arange(0,10)                 # 10 variables
X = np.random.random((20,10)) * 10    # observations of var
b = np.random.random((10,))*2-1       # [0,1) --> [-1,1)
z = np.random.normal(size=20)

y = X.dot(b) + z
b_esti = np.linalg.lstsq(X, y, rcond=-1)[0]    #least squares

f, sp = plt.subplots()
sp.plot(var, b, 'rx', label = 'True coefficients')
sp.plot(var, b_esti, 'bo', label = 'Estimated coefficients')     #scatter plot
plt.xlim((-1, 10))
plt.ylim((-1.5, 1.5))
plt.xlabel('index')
plt.ylabel('value')
plt.legend()

plt.show()
#11.3

import matplotlib.pyplot as plt
import numpy as np
import scipy.stats

z = np.random.normal(loc = 0., scale = 1., size = 10000)
x = np.linspace(np.min(z), np.max(z), 10000)
kernel = scipy.stats.gaussian_kde(z)          # Gaussian kernel density estimator
f, sp = plt.subplots()
sp.hist(z, bins = 25, density = True)         # histogram
sp.plot(x, kernel.pdf(x))
plt.title('PDF for N(0,1)')
plt.xlabel('x')
plt.ylabel('y')
plt.show()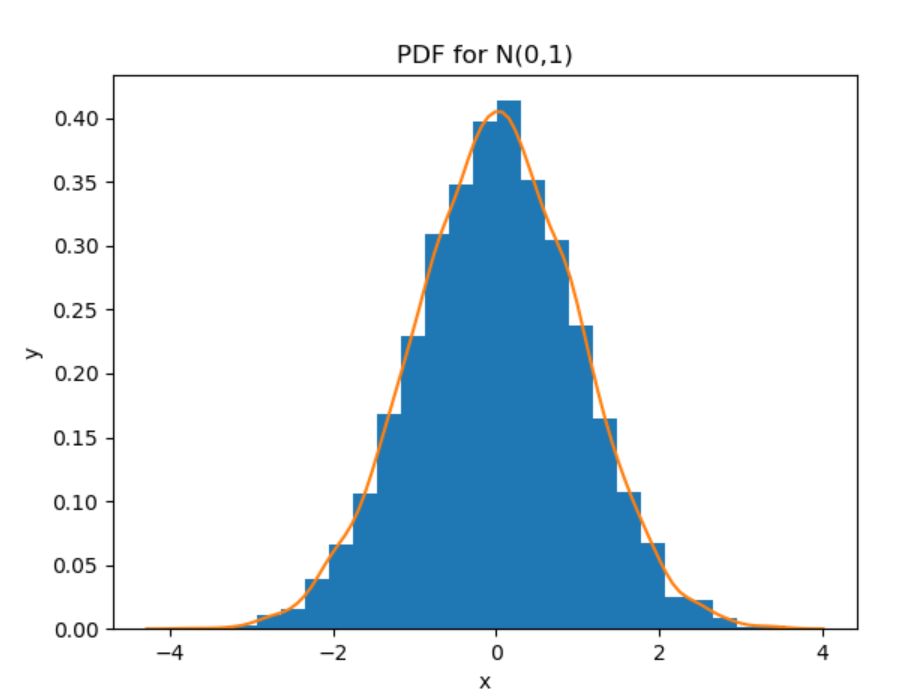


 8303
8303

 被折叠的 条评论
为什么被折叠?
被折叠的 条评论
为什么被折叠?
 到【灌水乐园】发言


