Matplotlib简介和pyplot的简单使用——直方统计图和轮廓曲线
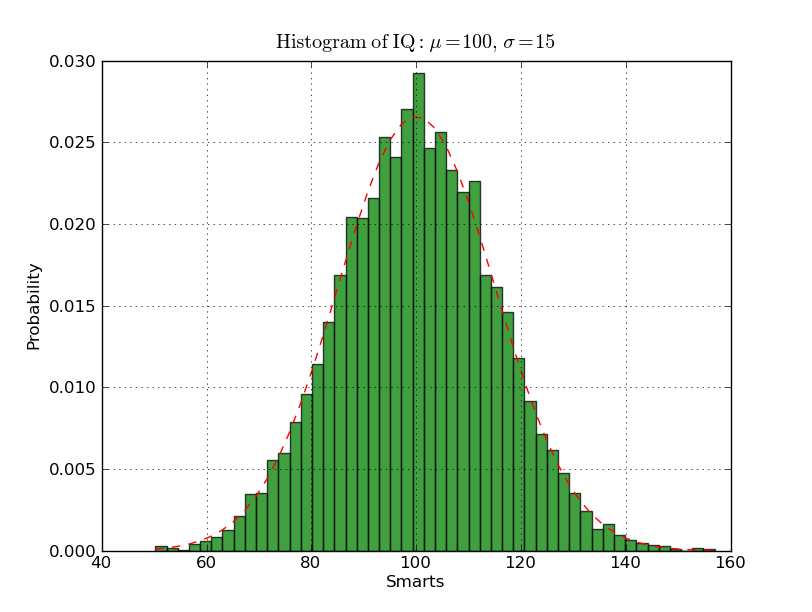
这次介绍pyplot如何画直方统计图,并且画出最合适的轮廓线。这是Matplotlib自带的一个例子,示例程序example/pyplot_examples/histdiagram_demo.py。
先看效果图
再看代码,
#!/usr/bin/env python
import numpy as np
import matplotlib.mlab as mlab
import matplotlib.pyplot as plt

mu, sigma = 100, 15
x = mu + sigma*np.random.randn(10000)

# the histogram of the data
n, bins, patches = plt.hist(x, 50, normed=1, facecolor='green', alpha=0.75)

# add a 'best fit' line
y = mlab.normpdf( bins, mu, sigma)
l = plt.plot(bins, y, 'r--', linewidth=1)

plt.xlabel('Smarts')
plt.ylabel('Probability')
plt.title(r'$\mathrm{Histogram\ of\ IQ:}\ \mu=100,\ \sigma=15$')
plt.axis([40, 160, 0, 0.03])
plt.grid(True)

plt.show()


 1万+
1万+

 被折叠的 条评论
为什么被折叠?


