


 文章描述了一次在MTK平台上遇到的内核NULL指针解引用错误,通过分析内核dumplog和使用工具如addr2line、gdb来定位问题。在内核的sysrq_handle_crash函数中发现错误,提示在147行有空指针操作。此外,还提到了如何通过打印结构体成员的指针偏移来辅助分析,并且讨论了类似LK死机问题的分析方法。
以mtk平台为例进行分析:
内核dump log如下:
echo c > /proc/sysrq-trigger [ 156.005334] <0>.(0)[1568:hang_detect][Hang_Detect] hang_detect thread counts down 2147483647:2147483647, status 0.
[ 156.646402] <1>.(1)[25:kworker/1:1]platform-pmic-temp pmic_temp: y_curr=680, t_curr=26379
[ 156.897497] <0>.(0)[7167:sh]Unable to handle kernel NULL pointer dereference at virtual address 0000000000000000
[ 156.898949] <0>.(0)[7167:sh]Mem abort info:
[ 156.899540] <0>.(0)[7167:sh] ESR = 0x96000046
[ 156.900161] <0>.(0)[7167:sh] Exception class = DABT (current EL), IL = 32 bits
[ 156.901149] <0>.(0)[7167:sh] SET = 0, FnV = 0
[ 156.901768] <0>.(0)[7167:sh] EA = 0, S1PTW = 0
[ 156.902395] <0>.(0)[7167:sh]Data abort info:
[ 156.903038] <0>.(0)[7167:sh] ISV = 0, ISS = 0x00000046
[ 156.903759] <0>.(0)[7167:sh] CM = 0, WnR = 1
[ 156.904375] <0>.(0)[7167:sh]user pgtable: 4k pages, 39-bit VAs, pgdp = 0000000034f49955
[ 156.905624] <0>.(0)[7167:sh][0000000000000000] pgd=000000006dcd6003, pud=000000006dcd6003, pmd=0000000000000000
[ 156.907007] <0>-(0)[7167:sh]Internal error: Oops: 96000046 [#1] PREEMPT SMP
[ 157.950708] <0>-(0)[7167:sh]Kernel Offset: 0x0 from 0xffffff8008000000
[ 157.951607] <0>-(0)[7167:sh]PHYS_OFFSET: 0x40000000
[ 157.952269] <0>-(0)[7167:sh]Modules linked in: gps_drv ffffff8000c77000 0000000000000000 516096 0 (O) conninfra_drv ffffff8000c30000 0000000000000000 233472 0 (O) hwnat ffffff8000c00000 0000000000000000 163840 0 (O)
[ 157.954807] <0>-(0)[7167:sh]CPU: 0 PID: 7167 Comm: sh Tainted: G O 4.19.98 #1
[ 157.955923] <0>-(0)[7167:sh]Hardware name: MediaTek evb6890v1_64_cpe (DT)
[ 157.956826] <0>-(0)[7167:sh]pstate: 60400005 (nZCv daif +PAN -UAO)
[ 157.957665] <0>-(0)[7167:sh ]pc : sysrq_handle_crash+0x28/0x34
[ 157.958439] <0>-(0)[7167:sh] lr : sysrq_handle_crash+0x14/0x34
[ 157.959205] <0>-(0)[7167:sh]sp : ffffff800c0a3c50
[ 157.959838] <0>-(0)[7167:sh]x29: ffffff800c0a3c50 x28: ffffffc02dc5b800
[ 157.960731] <0>-(0)[7167:sh]x27: 0000000000000000 x26: 0000000000000000
[ 157.961626] <0>-(0)[7167:sh]x25: 0000000056000000 x24: 0000000000000015
[ 157.962519] <0>-(0)[7167:sh]x23: 0000000000000008 x22: 0000000000000000
[ 157.963413] <0>-(0)[7167:sh]x21: 0000000000000063 x20: ffffff800988b050
[ 157.964308] <0>-(0)[7167:sh]x19: ffffff8009832000 x18: 0000000000000000
[ 157.965201] <0>-(0)[7167:sh]x17: 0000000000000000 x16: 0000000000000000
[ 157.966095] <0>-(0)[7167:sh]x15: 000000000000000a x14: 0000000000001bff
[ 157.966988] <0>-(0)[7167:sh]x13: ffffff800c0a3978 x12: ffffffffffffffff
[ 157.967881] <0>-(0)[7167:sh]x11: 0000000000000020 x10: 00000000fffffff8
[ 157.968774] <0>-(0)[7167:sh]x9 : ffffff800c0a394b x8 : ffffff8009995c43
[ 157.969668] <0>-(0)[7167:sh]x7 : 0000000000000000 x6 : 0000000000000004
[ 157.970560] <0>-(0)[7167:sh]x5 : 00ffffffffffffff x4 : 0000000000000015
[ 157.971455] <0>-(0)[7167:sh]x3 : 0000000000ad0a13 x2 : a31be716971be900
[ 157.972347] <0>-(0)[7167:sh]x1 : 0000000000000000 x0 : 0000000000000001
[ 157.973244] <0>-(0)[7167:sh]CPU: 0 PID: 7167 Comm: sh Tainted: G O 4.19.98 #1
[ 157.974357] <0>-(0)[7167:sh]Hardware name: MediaTek evb6890v1_64_cpe (DT)
[ 157.975256] <0>-(0)[7167:sh]Call trace:
[ 157.975784] <0>-(0)[7167:sh] dump_backtrace+0x0/0x158
[ 157.976463] <0>-(0)[7167:sh] show_stack+0x24/0x30
[ 157.977104] <0>-(0)[7167:sh] dump_stack+0xa0/0xdc
[ 157.977742] <0>-(0)[7167:sh] mrdump_common_die+0x184/0x250
[ 157.978476] <0>-(0)[7167:sh] ipanic_die+0x38/0x74
[ 157.979116] <0>-(0)[7167:sh] notifier_call_chain+0x70/0x90
[ 157.979853] <0>-(0)[7167:sh] __atomic_notifier_call_chain+0x4c/0x6c
[ 157.980690] <0>-(0)[7167:sh] atomic_notifier_call_chain+0x3c/0x4c
[ 157.981504] <0>-(0)[7167:sh] notify_die+0x40/0x60
[ 157.982137] <0>-(0)[7167:sh] die+0x98/0x1b8
[ 157.982711] <0>-(0)[7167:sh] die_kernel_fault+0x68/0x78
[ 157.983413] <0>-(0)[7167:sh] __do_kernel_fault+0xc4/0x104
[ 157.984138] <0>-(0)[7167:sh] do_page_fault+0x3d8/0x3f8
[ 157.984830] <0>-(0)[7167:sh] do_translation_fault+0x50/0x88
[ 157.985576] <0>-(0)[7167:sh] do_mem_abort+0x68/0xf8
[ 157.986233] <0>-(0)[7167:sh] el1_da+0x1c/0xac
[ 157.986824] <0>-(0)[7167:sh] sysrq_handle_crash+0x28/0x34
[ 157.987548] <0>-(0)[7167:sh] __handle_sysrq+0xa4/0x150
[ 157.988240] <0>-(0)[7167:sh] write_sysrq_trigger+0x178/0x18c
[ 157.989005] <0>-(0)[7167:sh] proc_reg_write+0x7c/0xbc
[ 157.989689] <0>-(0)[7167:sh] __vfs_write+0x60/0x16c
[ 157.990346] <0>-(0)[7167:sh] vfs_write+0xd4/0x190
[ 157.990982] <0>-(0)[7167:sh] ksys_write+0x74/0xe0
[ 157.991616] <0>-(0)[7167:sh] __arm64_sys_write+0x24/0x30
[ 157.992335] <0>-(0)[7167:sh] el0_svc_common.constprop.0+0x98/0x110
[ 157.993160] <0>-(0)[7167:sh] el0_svc_handler+0x44/0x78
[ 157.993851] <0>-(0)[7167:sh] el0_svc+0x8/0xc
通过内核编译出的System.map或者反汇编出来的vmlinux.dis来看:
可以定位出sysrq_handle_crash对应的地址:ffffff800852ff78 <sysrq_handle_crash>:
[ 157.957665] <0>-(0)[7167:sh]pc : sysrq_handle_crash+0x28/0x34
[ 157.958439] <0>-(0)[7167:sh]lr : sysrq_handle_crash+0x14/0x34
即可推出:
pc:FFFFFF800852FFA0
lr:FFFFFF800852FF8C
aarch64-poky-linux-objdump -d vmlinux > vmlinux.dis
aarch64-poky-linux-addr2line -Cafpe vmlinux FFFFFF800852FFA0 FFFFFF800852FF8C
0xffffff800852ffa0: sysrq_handle_crash at
ap/src/kernel/linux/v4.xx/drivers/tty/sysrq.c:147 //此处oops
0xffffff800852ff8c: sysrq_handle_crash at
ap/src/kernel/linux/v4.xx/drivers/tty/sysrq.c:145
找出对应的代码行,在./drivers/tty/sysrq.c驱动可以看到在147行对killer 空指针进行了操作:
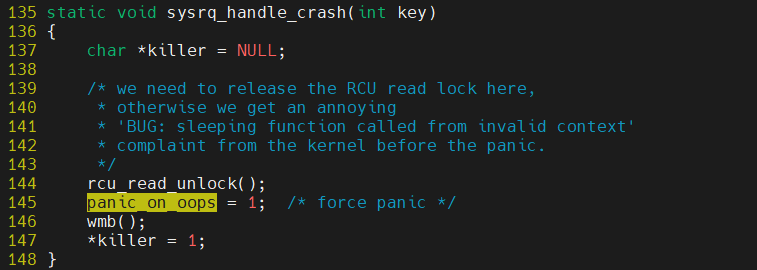
打印结构体成员对于结构体本身的指针偏移
printk(KERN_EMERG "usb_flag_offset:%px,%px\n",&(usb->flags),&usb);
然后进行详见即可得offset。
另外对于lk的死机问题同样也可做类似分析:
aarch64-poky-linux-addr2line -Cafpe lk.elf 0xfffffff04211125d
也可用gdb分析vmlinux用于分析oops问题定位:
aarch64-poky-linux-gdb vmlinux
GNU gdb (GDB) 8.2
Copyright (C) 2018 Free Software Foundation, Inc.
License GPLv3+: GNU GPL version 3 or later < http://gnu.org/licenses/gpl.html>
This is free software: you are free to change and redistribute it.
There is NO WARRANTY, to the extent permitted by law.
Type "show copying" and "show warranty" for details.
This GDB was configured as "--host=x86_64-oesdk-linux --target=aarch64-poky-linux".
Type "show configuration" for configuration details.
For bug reporting instructions, please see:
< http://www.gnu.org/software/gdb/bugs/>.
Find the GDB manual and other documentation resources online at:
< http://www.gnu.org/software/gdb/documentation/>.
For help, type "help".
Type "apropos word" to search for commands related to "word"...
Reading symbols from vmlinux...done.
(gdb) list
(gdb) list *(sysrq_handle_crash+0x28)
0xffffff800852ffa0 is in sysrq_handle_crash (ap/src/kernel/linux/v4.xx/drivers/tty/sysrq.c:147).
142 in /ap/src/kernel/linux/v4.xx/drivers/tty/sysrq.c
(gdb)
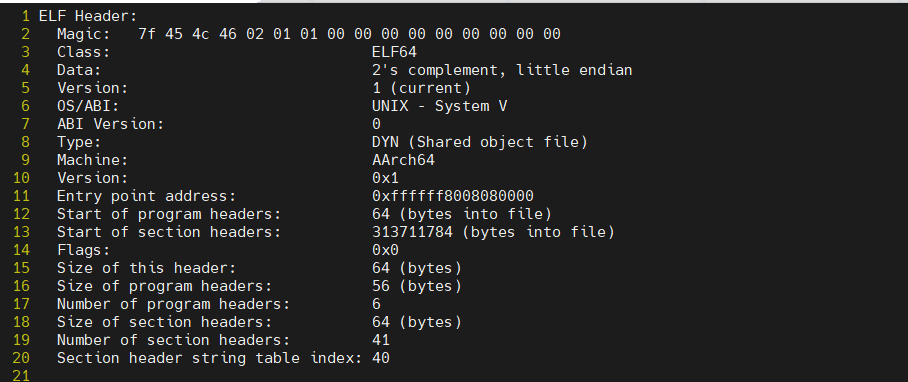
查看内核符号表信息以及kernel 入口地址:


 1755
1755

 被折叠的 条评论
为什么被折叠?
被折叠的 条评论
为什么被折叠?
 到【灌水乐园】发言


