


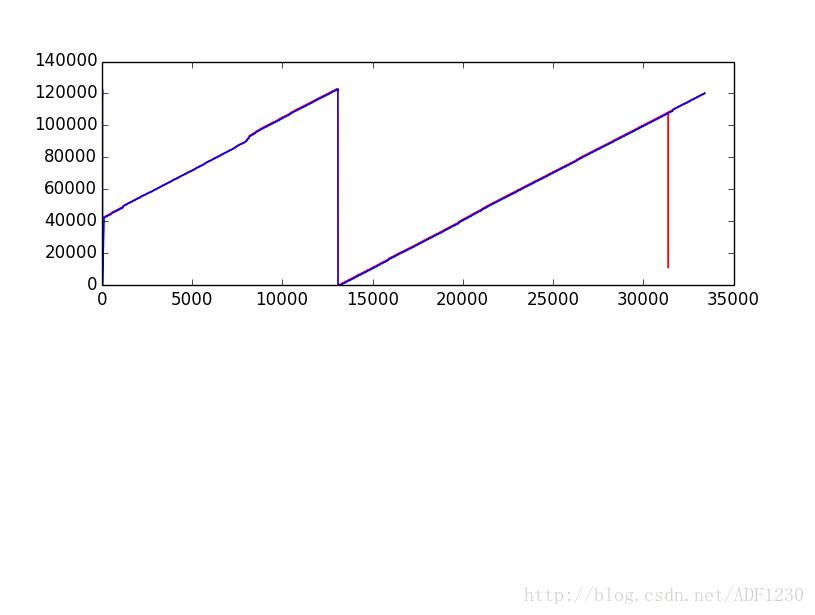
log分析使用python等脚本语言更方便可定制,使用正则提取需要的数据,使用matplotlib绘制出图形,以进行分析。
下图是示例,详细例子下载:点击打开链接 ,内里包含:pythonv3.3.2的安装包,matplotlib与其依赖包。除此之外,还有一个log文件,log.py用于示例如何使用python进行图形化的log分析。
代码:
import re
import matplotlib.pyplot as plt

print("analyse video input pts!...")

#[16:11:08:535] [INFO] CRingBuffer::WriteFile() begin m_llCurWriteMemPos=1536000  m_llCurWriteDsikPos=1331200
#[16:11:08:535] [INFO] CRingBuffer::WriteFile() begin m_RbFile.llCurWritePos=87654400  m_RbFile.llCurReadPos=0
regex  = re.compile("m_RbFile.llCurWritePos=(\d+)")
regex2 = re.compile("m_RbFile.llCurReadPos=(\d+)")

WritePos_index = []
WritePos   = []
ReadPos_index = []
ReadPos    = []

file  = open("RingBuffer_Source.txt", "r")
log = file.read()
file.close()

#write pos
m = regex.findall(log)
if m:
    print("write pos match success")
    i = 0
    j = 0
    for pos in m:
        if(int(pos) < 10000000000) :
            WritePos_index.append(i)
            WritePos.append(int(pos)/1000)
            i = i+1
else:
    print("not match")

#read pos
m = regex2.findall(log)
if m:
    print("read pos match success")
    i = 0
    j = 0
    for pos in m:
        if(int(pos) < 10000000000) :
            ReadPos_index.append(i)
            ReadPos.append(int(pos)/1000)
            i = i+1
else:
    print("not match")

print("begin to plot")

fig = plt.figure()
video_pts_plot = fig.add_subplot(211)
video_pts_plot.plot(WritePos_index, WritePos, 'r')
video_pts_plot.plot(ReadPos_index, ReadPos, 'b')
plt.show()


 431
431


 被折叠的 条评论
为什么被折叠?
被折叠的 条评论
为什么被折叠?
 到【灌水乐园】发言


