


Echarts 常用各类图表模板配置
注意: 这里主要就是基于各类图表,更多的使用 Echarts 的各类配置项;
以下代码都可以复制到 Echarts 官网,直接预览;
图标模板目录
一、3D 柱状图
注意: 以下背景图来源于网络,如果失效请自行替换;
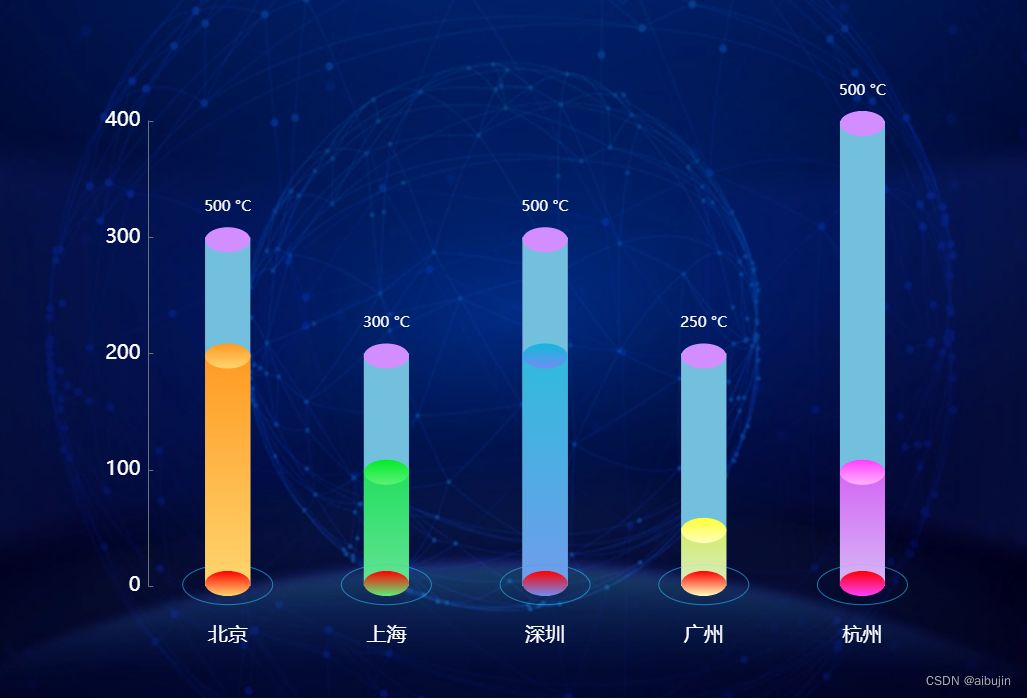
var xAxisData = ['北京', '上海', '深圳', '广州', '杭州'];
var data1 = [200, 100, 200, 50, 100];
var data2 = [300, 200, 300, 200, 400];
option = {
backgroundColor: '#191970',
tooltip: {
trigger: 'item'
},
grid: {
top: '20%',
bottom: '20%',
right: '10%',
left: '18%'
},
graphic: [
{
type: 'image', // 图形元素类型
id: 'logo', // 更新或删除图形元素时指定更新哪个图形元素,如果不需要用可以忽略。
right: 'center', // 根据父元素进行定位 (居中)
bottom: '0%', // 根据父元素进行定位 (0%), 如果bottom的值是 0,也可以删除该bottom属性值。
z: 0, // 层叠
bounding: 'all', // 决定此图形元素在定位时,对自身的包围盒计算方式
style: {
image:
'https://img0.baidu.com/it/u=3846011338,1538056540&fm=253&fmt=auto&app=138&f=PNG?w=889&h=500', // 这里一定要注意、注意,必须是https开头的图片路径地址
width: 1345,
height: 800
}
}
],
xAxis: {
data: xAxisData,
axisTick: {
show: false
},
axisLine: {
show: false
},
axisLabel: {
interval: 0,
textStyle: {
color: '#fff',
fontSize: 20
},
margin: 40
}
},
yAxis: {
splitLine: {
show: false
},
axisTick: {
show: true,
alignWithLabel: true,
inside: true
},
axisLine: {
show: true
},
axisLabel: {
textStyle: {
color: '#fff',
fontSize: 20
}
}
},
series: [
// 底部的光晕
{
name: '',
type: 'pictorialBar',
tooltip: {
show: false
},
symbolSize: [90, 40],
symbolOffset: [0, 20],
z: 1,
itemStyle: {
normal: {
color: 'transparent',
borderColor: '#26B2E8',
borderType: 'solid',
borderWidth: 4
}
},
data: [1, 1, 1, 1, 1]
},
{
//三个最低下的圆片
name: '',
type: 'pictorialBar',
symbolSize: [45, 25],
symbolOffset: [0, 10],
z: 12,
itemStyle: {
opacity: 1,
color: function (params) {
var a = params.name.slice(0, 2);
if (a === '北京') {
return new echarts.graphic.LinearGradient(
0,
0,
0,
1,
[
{
offset: 0,
color: 'red' // 0% 处的颜色
},
{
offset: 1,
color: '#FFD56E' // 100% 处的颜色
}
],
false
);
} else if (a === '上海') {
return new echarts.graphic.LinearGradient(
0,
0,
0,
1,
[
{
offset: 0,
color: 'red' // 0% 处的颜色
},
{
offset: 1,
color: '#5DF076' // 100% 处的颜色
}
],
false
);
} else if (a === '深圳') {
return new echarts.graphic.LinearGradient(
0,
0,
0,
1,
[
{
offset: 0,
color: 'red' // 0% 处的颜色
},
{
offset: 1,
color: '#6F8EF2' // 100% 处的颜色
}
],
false
);
} else if (a === '广州') {
return new echarts.graphic.LinearGradient(
0,
0,
0,
1,
[
{
offset: 0,
color: 'red' // 0% 处的颜色
},
{
offset: 1,
color: '#FFFFBB' // 100% 处的颜色
}
],
false
);
} else if (a === '杭州') {
return new echarts.graphic.LinearGradient(
0,
0,
0,
1,
[
{
offset: 0,
color: 'red' // 0% 处的颜色
},
{
offset: 1,
color: '#FF3EFF' // 100% 处的颜色
}
],
false
);
}
}
},
data: [0, 0, 0, 0, 0]
},
//下半截柱状图
{
name: '2020',
type: 'bar',
barWidth: 45,
barGap: '-100%',
itemStyle: {
opacity: 0.7,
color: function (params) {
var a = params.name.slice(0, 2);
if (a === '北京') {
return new echarts.graphic.LinearGradient(
0,
0,
0,
1,
[
{
offset: 0,
color: '#FF9A22' // 0% 处的颜色
},
{
offset: 1,
color: '#FFD56E' // 100% 处的颜色
}
],
false
);
} else if (a === '上海') {
return new echarts.graphic.LinearGradient(
0,
0,
0,
1,
[
{
offset: 0,
color: '#00EC28' // 0% 处的颜色
},
{
offset: 1,
color: '#5DF076' // 100% 处的颜色
}
],
false
);
} else if (a === '深圳') {
return new echarts.graphic.LinearGradient(
0,
0,
0,
1,
[
{
offset: 0,
color: '#12B9DB' // 0% 处的颜色
},
{
offset: 1,
color: '#6F8EF2' // 100% 处的颜色
}
],
false
);
} else if (a === '广州') {
return new echarts.graphic.LinearGradient(
0,
0,
0,
1,
[
{
offset: 0,
color: '#FFFF33' // 0% 处的颜色
},
{
offset: 1,
color: '#FFFFBB' // 100% 处的颜色
}
],
false
);
} else if (a === '杭州') {
return new echarts.graphic.LinearGradient(
0,
0,
0,
1,
[
{
offset: 0,
color: '#FF3EFF' // 0% 处的颜色
},
{
offset: 1,
color: '#FFB3FF' // 100% 处的颜色
}
],
false
);
}
}
},
data: data1
},
{
name: '2022',
type: 'bar',
barWidth: 45,
barGap: '-100%',
itemStyle: {
color: function (params) {
var a = params.name.slice(0, 2);
if (a === '北京') {
return new echarts.graphic.LinearGradient(
0,
0,
0,
1,
[
{
offset: 0,
color: '#FF9A22' // 0% 处的颜色
},
{
offset: 1,
color: '#FFD56E' // 100% 处的颜色
}
],
false
);
}
}
},
data: data1
},
{
name: '', // 头部
type: 'pictorialBar',
symbolSize: [45, 25],
symbolOffset: [0, -10],
z: 12,
symbolPosition: 'end',
itemStyle: {
color: '#D28EFF',
opacity: 1
},
data: data2
},
{
name: '',
type: 'pictorialBar',
symbolSize: [45, 25],
symbolOffset: [0, -10],
z: 12,
itemStyle: {
opacity: 1,
color: function (params) {
var a = params.name.slice(0, 2);
if (a === '北京') {
return new echarts.graphic.LinearGradient(
0,
0,
0,
1,
[
{
offset: 0,
color: '#FF9A22' // 0% 处的颜色
},
{
offset: 1,
color: '#FFD56E' // 100% 处的颜色
}
],
false
);
} else if (a === '上海') {
return new echarts.graphic.LinearGradient(
0,
0,
0,
1,
[
{
offset: 0,
color: '#00EC28' // 0% 处的颜色
},
{
offset: 1,
color: '#5DF076' // 100% 处的颜色
}
],
false
);
} else if (a === '深圳') {
return new echarts.graphic.LinearGradient(
0,
0,
0,
1,
[
{
offset: 0,
color: '#12B9DB' // 0% 处的颜色
},
{
offset: 1,
color: '#6F8EF2' // 100% 处的颜色
}
],
false
);
} else if (a === '广州') {
return new echarts.graphic.LinearGradient(
0,
0,
0,
1,
[
{
offset: 0,
color: '#FFFF33' // 0% 处的颜色
},
{
offset: 1,
color: '#FFFFBB' // 100% 处的颜色
}
],
false
);
} else if (a === '杭州') {
return new echarts.graphic.LinearGradient(
0,
0,
0,
1,
[
{
offset: 0,
color: '#FF3EFF ' // 0% 处的颜色
},
{
offset: 1,
color: '#FFB3FF' // 100% 处的颜色
}
],
false
);
}
}
},
symbolPosition: 'end',
data: data1
},
{
name: '2021',
type: 'bar',
barWidth: 45,
barGap: '-100%',
z: 0,
itemStyle: {
color: '#E8CCFF',
opacity: 0.7
},
data: data2
},
{
name: '总数',
type: 'bar',
barWidth: 45,
barGap: '-100%',
z: 0,
label: {
show: true,
lineHeight: 30,
formatter: function (params) {
var index = params.dataIndex;
return data1[index] + data2[index] + ' °C';
},
position: 'top',
textStyle: {
color: '#fff',
fontSize: 15
},
padding: [10, 0]
},
data: data2
}
]
};
二、环形图
echarts 环形图:多层嵌套,自定义 legend 位置、颜色,中间插入数据及文字,颜色渐变;
文字链接: https://blog.csdn.net/aibujin/article/details/124796709?spm=1001.2014.3001.5501
三、k 线图
文章链接: https://blog.csdn.net/aibujin/article/details/124797924?spm=1001.2014.3001.5501
四、折线图
echarts 折线图,横纵坐标轴线颜色、文字颜色,网格线,坐标轴两侧留白,数据渐变,刻度线等;
文章链接: https://blog.csdn.net/aibujin/article/details/124802512?spm=1001.2014.3001.5501
文章链接:https://blog.csdn.net/aibujin/article/details/130157140?spm=1001.2014.3001.5501
文章链接:https://blog.csdn.net/aibujin/article/details/130223130?spm=1001.2014.3001.5501
五、横向柱状图
echarts 横向柱状图,坐标轴隐藏,网格线颜色渐变,网格默认背景,柱状图边框宽度/颜色,数据渐变,刻度线隐藏等;
文章链接: https://blog.csdn.net/aibujin/article/details/124802889?spm=1001.2014.3001.5501
六、折线图 + 柱状图
echarts 折线图 + 柱状图,左右两侧y轴线,横纵坐标轴线颜色、文字颜色,网格线,坐标轴两侧留白,数据渐变,刻度线等;
文章链接: https://blog.csdn.net/aibujin/article/details/124803493?spm=1001.2014.3001.5501
七、工程项目可视化
echarts 工程项目可视化,依据x轴时间坐标轴,叠加展示不同阶段的项目节点,y轴展示项目阶段名、文字颜色,网格线,坐标轴两侧留白、背景色等;
文章链接: https://blog.csdn.net/aibujin/article/details/130237643?spm=1001.2014.3001.5501
八、雷达图
echarts 雷达图,自定义指示器名称,线条样式、区域填充样式、折线拐点标志、自定义名称样式、坐标轴分隔线、坐标轴两侧留白、背景色等;
文章链接:https://blog.csdn.net/aibujin/article/details/130266382?spm=1001.2014.3001.5501
九、象形柱图
echarts 象形柱图,隐藏横纵坐标轴、网格线,坐标轴两侧留白,自定义矢量图,文字提示框、图形类型、背景色等;
文章链接:https://blog.csdn.net/aibujin/article/details/130289101?spm=1001.2014.3001.5501
十、环形占比图
echarts 环形占比图,环形图、仪表盘、刻度线,自定义提示框、颜色渐变、背景色等;
文章链接:https://blog.csdn.net/aibujin/article/details/130265744?spm=1001.2014.3001.5501
十一、圆环动画
echarts 圆环动画,饼图、环形图、图表动画、网格线,颜色渐变,图行矢量,文字提示框、图表层级、背景色等;
文章链接:https://blog.csdn.net/aibujin/article/details/130288849?spm=1001.2014.3001.5501


 515
515


 被折叠的 条评论
为什么被折叠?
被折叠的 条评论
为什么被折叠?
 到【灌水乐园】发言


