


第16章 下载数据
文件下载
https://ehmatthes.github.io/pcc/
16.1 CSV文件格式
16.1.1 分析CSV文件头
16.1.2 打印文件头及其位置
16.1.3 提取并读取数据
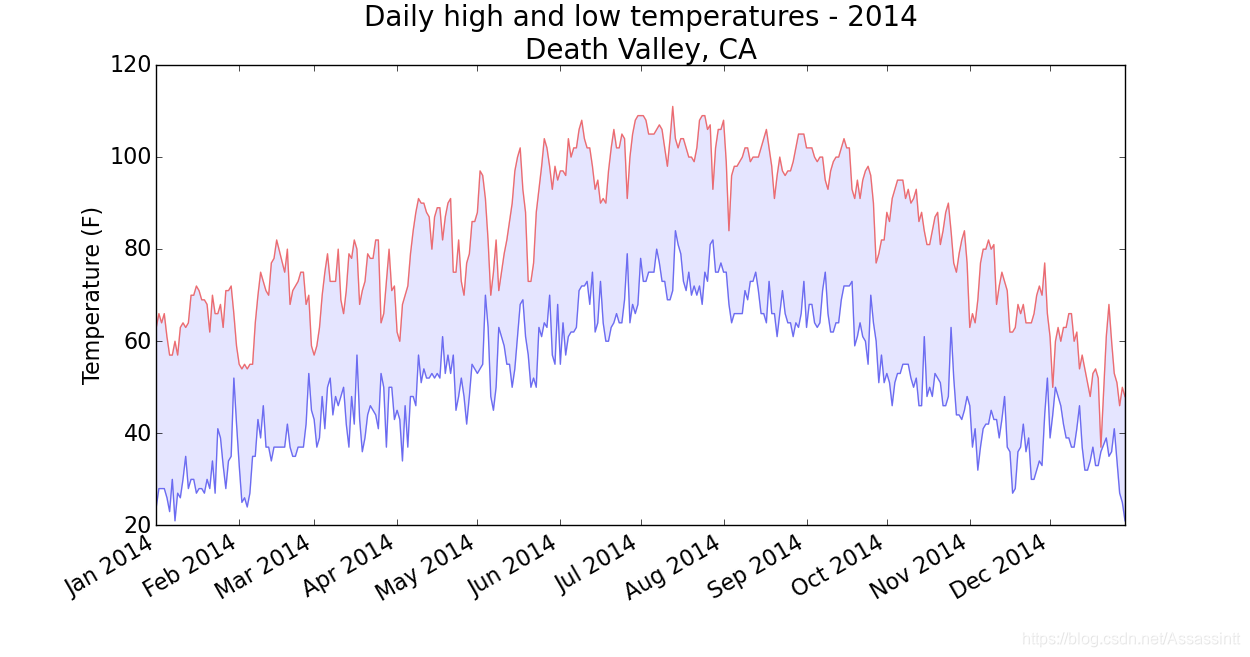
16.1.4 绘制气温图表
16.1.5 模块datetime
16.1.6 在图表中添加日期
16.1.7 涵盖更长的时间
16.1.8 再绘制一个数据系列
16.1.9 给图表区域着色
16.1.10 错误检查
import csv
from datetime import datetime
from matplotlib import pyplot as plt

# 从文件中获取最高气温 and 日期
filename = 'death_valley_2014.csv'
with open(filename) as f:
    reader = csv.reader(f)
    header_row = next(reader)
    dates,highs,lows = [],[],[]
    #错误检查
    for row in reader:
        try:
            current_date = datetime.strptime(row[0], "%Y-%m-%d")
            high = int(row[1])
            low = int(row[3])
        except ValueError:
            print(current_date, 'missing data')
        else:
            dates.append(current_date)
            highs.append(high)
            lows.append(low)

    print(highs)

# 根据数据绘制图形
fig = plt.figure(dpi=128, figsize=(10,6))
plt.plot(dates, highs, c='red', alpha=0.5)
plt.plot(dates, lows, c='blue', alpha=0.5)
#填充区域颜色
plt.fill_between(dates, highs, lows, facecolor='blue',alpha=0.2)

#设置图形的格式
plt.title("Daily high and low temperatures - 2014", fontsize=24)
plt.xlabel('', fontsize = 10)
#绘制斜的日期标签,以免它们彼此重叠
fig.autofmt_xdate()
plt.ylabel("Temperature (F)", fontsize=10 )
# 设置刻度标记的大小
plt.tick_params(axis='both', which='major',labelsize=10)


plt.show()
16.2 制作世界人口地图:JSON格式
16.2.1 下载世界人口数据
16.2.2 提取相关的数据
16.2.3 将字符串转换为数字值
16.2.4 获取两个字母的国别码
from pygal_maps_world.i18n import COUNTRIES
#Pygal使用的国别码存储在模块 i18n (internationalization的缩写

#字典 COUNTRIES 包含的键和值分别为两个字母的国别码和国家名
def get_country_code(country_name):
    """根据指定的国家, 返回pygal使用的两个字母的国别码"""
    for code, name in COUNTRIES.items():
        if name == country_name:
            return code
    return None
16.2.5 制作世界地图
import pygal

wm = pygal.maps.world.World()
wm.title = 'North, Central, and South America'

#add接受一个标签和一个列表,其中后者包含我们要突出的国家的国别码
wm.add('North America', ['ca', 'mx', 'us'])
wm.add('Central America', ['bz', 'cr', 'gt', 'hn', 'ni', 'pa', 'sv'])
wm.add('South America', ['ar', 'bo', 'br', 'cl', 'co', 'ec', 'gf',
    'gy', 'pe', 'py', 'sr', 'uy', 've'])

wm.render_to_file('americas.svg')
16.2.6 在世界地图上呈现数字数据
import pygal

wm = pygal.maps.world.World()
wm.title = 'Populations of Countries in North America'
wm.add('North America', {'ca': 34126000, 'us': 309349000, 'mx': 113423000})

wm.render_to_file('na_populations.svg')
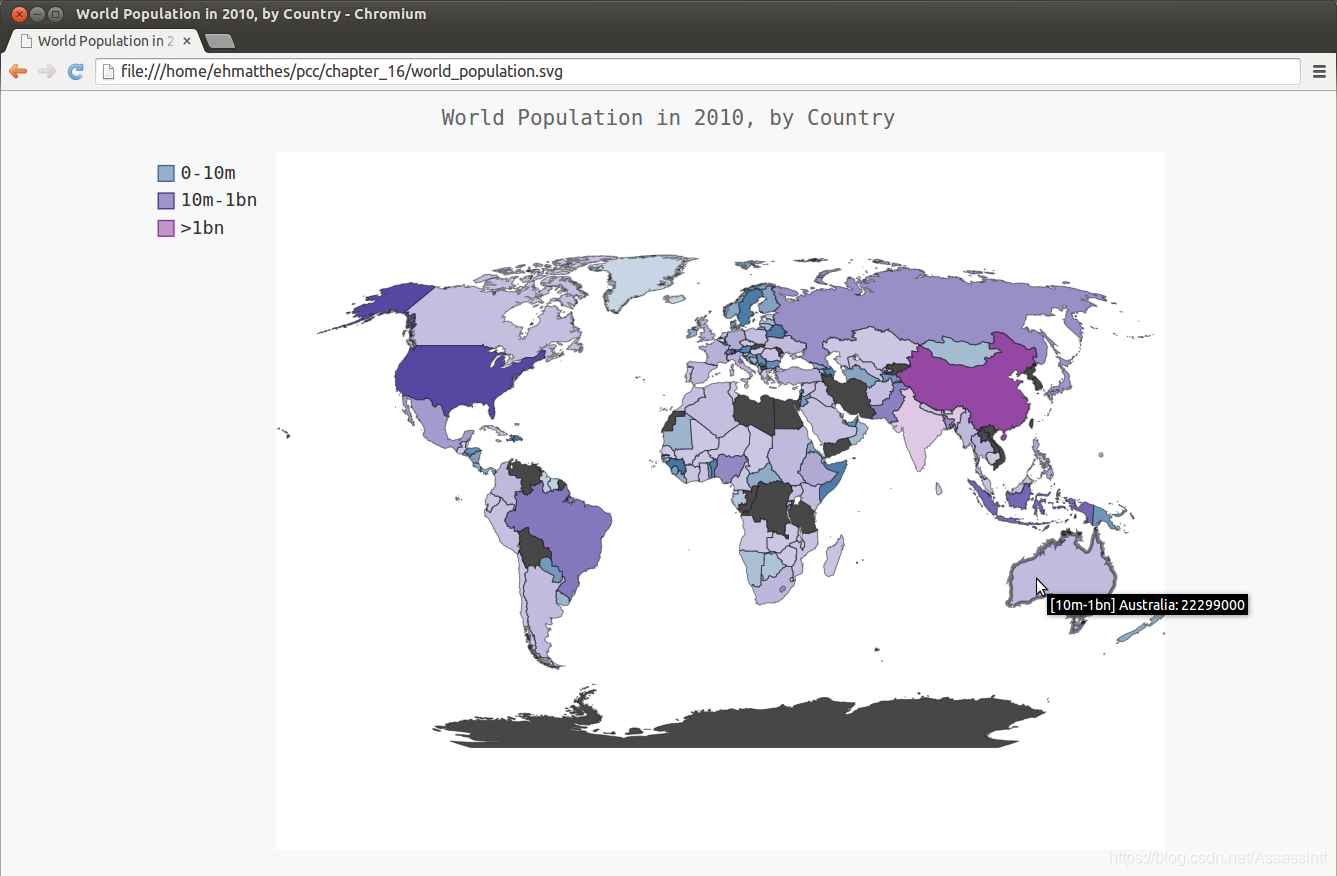
16.2.7 绘制完整的世界人口地图
16.2.8 根据人口数量将国家分组
16.2.9 使用Pygal设置世界地图的样式
16.2.10 加亮颜色主题
import json

import pygal
from pygal.style import RotateStyle, LightColorizedStyle
from country_codes import get_country_code


#将数据加载到一个列表中
filename = 'population_data.json'
with open(filename) as f:
    pop_data = json.load(f)
#函数 json.load() 将数据转换为Python能够处理的格式,这里是一个列表

#创建一个包含人口数量的字典
cc_populations = {}
#打印每个国家2010年人口数量
for pop_dict in pop_data:
    if pop_dict['Year'] == '2010':
        country_name = pop_dict['Country Name']
        population = int(float(pop_dict['Value']))
        #Python不能直接将包含小数点的字符串 '37398.85751' 转换为整数, 先转换成float
        code = get_country_code(country_name)
        if code:
            print(code+': '+str(population))
            cc_populations[code] = population

# 根据人口数量将所有的国家分成三组
cc_pops_1, cc_pops_2, cc_pops_3 = {},{},{}
for cc, pop in cc_populations.items():
    if pop < 10000000:
        cc_pops_1[cc] = pop
    elif pop < 1000000000:
        cc_pops_2[cc] = pop
    else:
        cc_pops_3[cc] = pop

#看看每组分别包含多少个国家
print(len(cc_pops_1), len(cc_pops_2), len(cc_pops_3))

#wm_style = RotateStyle('#336699') # 提供基色
#wm_style = LightColorizedStyle  #加亮颜色
wm_style = RotateStyle('#336699', base_style=LightColorizedStyle) #组合
wm = pygal.maps.world.World(style=wm_style)
wm.title = 'World Population in 2010, by Country'
#wm.add('2010', cc_populations)
wm.add('0-10m', cc_pops_1)
wm.add('10m-1bn', cc_pops_2)
wm.add('>1bn', cc_pops_3)

wm.render_to_file('world_population.svg')
第17章 使用API
17.1 使用Web API
17.1.1 Git和GitHub
17.1.2 使用API调用请求数据
https://api.github.com/search/repositories?q=language:python&sort=stars
第一部分( https://api.github.com/ )将请求发送到GitHub网站中响应API调用的部分;接下来的一部分( search/repositories )让API搜索GitHub上的所有仓库。repositories 后面的问号指出我们要传递一个实参。 q 表示查询,而等号让我们能够开始指定
查询( q= )。通过使用 language:python ,我们指出只想获取主要语言为Python的仓库的信息。最后一部分( &sort=stars )指定将项目按其获得的星级进行排序。

GitHub总共有3888365个Python项目
"incomplete_results"的值为 true, GitHub无法全面处理该API,
接下来的列表中显示了返回的 "items" ,其中包含GitHub上最受欢迎
的Python项目的详细信息。
17.1.3 安装requests
17.1.4 处理API响应
17.1.5 处理响应字典
17.1.6 概述最受欢迎的仓库
import requests

#执行API调用并存储响应
url = 'https://api.github.com/search/repositories?q=language:python&sort=stars'
r = requests.get(url)
print("Status code", r.status_code)

#将api响应存储在一个变量中
response_dict = r.json()

#处理结果
print(response_dict.keys())
print("Total repositories:", response_dict['total_count'])

#搜索有关仓库的信息
repo_dicts = response_dict['items']
print("Repositories returned:", len(repo_dicts))

#研究第一个仓库
#repo_dict = repo_dicts[0]
#print("\nKeys:",len(repo_dict))
#for key in sorted(repo_dict.keys()):
#    print(key)

print("\nSelected information about each repository:")
for repo_dict in repo_dicts:
    print('Name:', repo_dict['name'])
    print('Owner:', repo_dict['owner']['login'])
    print('Stars:', repo_dict['stargazers_count'])
    print('Repository:', repo_dict['html_url'])
    print('Created:', repo_dict['created_at'])
    print('Updated:', repo_dict['updated_at'])
    print('Description:', repo_dict['description'])
17.1.7 监视API的速率限制
大多数API都存在速率限制,即你在特定时间内可执行的请求数存在限制。要获悉你是否接近了GitHub的限制,请在浏览器中输入https://api.github.com/rate_limit 极限为每分钟10个请求, 但获得API密钥后,配额将高得多
"search": {
"limit": 10,
"remaining": 8,
"reset": 1426078803
}
17.2 使用Pygal可视化仓库
17.2.1 改进Pygal图表
import pygal
from pygal.style import LightColorizedStyle as LCS, LightenStyle as LS
import requests

#执行API调用并存储响应
url = 'https://api.github.com/search/repositories?q=language:python&sort=stars'
r = requests.get(url)
print("Status code", r.status_code)

#将api响应存储在一个变量中
response_dict = r.json()

#处理结果
print(response_dict.keys())
print("Total repositories:", response_dict['total_count'])

#搜索有关仓库的信息
repo_dicts = response_dict['items']

names, stars = [],[]
for repo_dict in repo_dicts:
   names.append(repo_dict['name'])
   stars.append(repo_dict['stargazers_count'])

#可视化
my_style = LS('#333366', base_style=LCS)
#让标签绕x轴旋转45度( x_label_rotation=45 ),并隐藏了图例
#chart = pygal.Bar(style=my_style, x_label_rotation=45, show_legend=False)

my_config = pygal.Config()
my_config.x_label_rotation = 45
my_config.show_legend = False  #隐藏了图例
my_config.title_font_size = 24
my_config.label_font_size = 14
my_config.major_label_font_size = 18 #主标签是y轴上为5000整数倍的刻度;这些标签应更大,以与副标签区分开来。
my_config.truncate_label = 15  #将较长的项目名缩短为15个字符,(如果将鼠标指向被截短的项目名,将显示完整的项目名)
my_config.show_y_guides = False #以隐藏图表中的水平线
my_config.width = 1000

chart = pygal.Bar(my_config, style=my_style)
chart.title = 'Most-Starred Python Projects on Github'
chart.x_labels = names
chart.add('', stars)
chart.render_to_file('python_repos.svg')

17.2.2 添加自定义工具提示
import pygal
from pygal.style import LightColorizedStyle as LCS, LightenStyle as LS

my_style = LS('#333366', base_sytle=LCS)
chart = pygal.Bar(style=my_style, x_label_rotation=45, show_legend=False)

chart.title='Python Projects'
chart.x_labels = ['httpie', 'django', 'flask']

plot_dicts = [
    {'value': 16101, 'label': 'Description of httpie.'},
    {'value': 15028, 'label': 'Description of django.'},
    {'value': 14798, 'label': 'Description of flask.'},
]

chart.add('',plot_dicts)
chart.render_to_file('bar_descriptions.svg')
17.2.3 根据数据绘图
17.2.4 在图表中添加可单击的链接
import pygal
from pygal.style import LightColorizedStyle as LCS, LightenStyle as LS
import requests

#执行API调用并存储响应
url = 'https://api.github.com/search/repositories?q=language:python&sort=stars'
r = requests.get(url)
print("Status code", r.status_code)

#将api响应存储在一个变量中
response_dict = r.json()


#搜索有关仓库的信息
repo_dicts = response_dict['items']

names, plot_dicts = [],[]
for repo_dict in repo_dicts:
    names.append(repo_dict['name'])
    #description 键值可能为空, 会无法画图, 需要赋值
    if repo_dict['description'] == None:
        descrip = "None"
    else:
        descrip = repo_dict['description']
    plot_dict = {
        'value': repo_dict['stargazers_count'],
        'label': descrip,
        'xlink': repo_dict['html_url']
        }
    plot_dicts.append(plot_dict)

#可视化
my_style = LS('#333366', base_style=LCS)
#让标签绕x轴旋转45度( x_label_rotation=45 ),并隐藏了图例
chart = pygal.Bar(style=my_style, x_label_rotation=45, show_legend=False)

chart.title = 'Most-Starred Python Projects on Github'
chart.x_labels = names
chart.add('', plot_dicts)
chart.render_to_file('python_repos.svg')
17.3 Hacker News API
Hacker News的API让你能够访问有关该网站所有文章和评论的信息,且不要求你通过注册获得密钥
下面的调用返回编写时最热门的文章的信息:
https://hacker-news.firebaseio.com/v0/item/9884165.json
{
'url': 'http://www.bbc.co.uk/news/science-environment-33524589',
'type': 'story',
'title': 'New Horizons: Nasa spacecraft speeds past Pluto',
'descendants': 141,
'score': 230,
'time': 1436875181,
'text': '',
'by': 'nns',
'id': 9884165,
'kids': [9884723, 9885099, 9884789, 9885604, 9885844]
}
import requests
from operator import itemgetter
#执行API 调用并存储响应
url = 'https://hacker-news.firebaseio.com/v0/topstories.json'
r = requests.get(url)
print("Status code:", r.status_code)
#处理有关每篇文章的信息
submission_ids = r.json()
submission_dicts = []
for submission_id in submission_ids[:30]:
#对于每篇文章, 都执行一个API调用
url = ('https://hacker-news.firebaseio.com/v0/item/' +
str(submission_id) + '.json')
submission_r = requests.get(url)
print(submission_r.status_code)
response_dict = submission_r.json()
submission_dict = {
'title': response_dict['title'],
'link': 'http://news.ycombinator.com/item?id=' + str(submission_id),
'comments': response_dict.get('descendants',0)
#如果文章还没有评论,响应字典中将没有键'descendants'
#方法 dict.get() ,它在指定的键存在时返回与之相关联的值,并在指定的键不存在时返回你指定的值(这里是0)
}
submission_dicts.append(submission_dict)
submission_dicts = sorted(submission_dicts, key=itemgetter('comments'), reverse=True)
for submission_dict in submission_dicts:
print("\nTitle:", submission_dict['title'])
print("Discussion link:", submission_dict['link'])
print("Comments:", submission_dict['comments'])


 7535
7535


 被折叠的 条评论
为什么被折叠?
被折叠的 条评论
为什么被折叠?
 到【灌水乐园】发言


